EURUSD I Bullish Bounce Off Based on the H4 chart analysis, the price is falling toward our buy entry level at 1.1699, a pullback support that aligns with the 38.2% Fib retracement.
Our take profit is set at 1.1745, a pullback resistance.
The stop loss is placed at 1.1638, below the 61.8% Fib retracement.
High Risk Investment Warning
Trading Forex/CFDs on margin carries a high level of risk and may not be suitable for all investors. Leverage can work against you.
Stratos Markets Limited (tradu.com ):
CFDs are complex instruments and come with a high risk of losing money rapidly due to leverage. 63% of retail investor accounts lose money when trading CFDs with this provider. You should consider whether you understand how CFDs work and whether you can afford to take the high risk of losing your money.
Stratos Europe Ltd (tradu.com ):
CFDs are complex instruments and come with a high risk of losing money rapidly due to leverage. 63% of retail investor accounts lose money when trading CFDs with this provider. You should consider whether you understand how CFDs work and whether you can afford to take the high risk of losing your money.
Stratos Global LLC (tradu.com ):
Losses can exceed deposits.
Please be advised that the information presented on TradingView is provided to Tradu (‘Company’, ‘we’) by a third-party provider (‘TFA Global Pte Ltd’). Please be reminded that you are solely responsible for the trading decisions on your account. There is a very high degree of risk involved in trading. Any information and/or content is intended entirely for research, educational and informational purposes only and does not constitute investment or consultation advice or investment strategy. The information is not tailored to the investment needs of any specific person and therefore does not involve a consideration of any of the investment objectives, financial situation or needs of any viewer that may receive it. Kindly also note that past performance is not a reliable indicator of future results. Actual results may differ materially from those anticipated in forward-looking or past performance statements. We assume no liability as to the accuracy or completeness of any of the information and/or content provided herein and the Company cannot be held responsible for any omission, mistake nor for any loss or damage including without limitation to any loss of profit which may arise from reliance on any information supplied by TFA Global Pte Ltd.
The speaker(s) is neither an employee, agent nor representative of Tradu and is therefore acting independently. The opinions given are their own, constitute general market commentary, and do not constitute the opinion or advice of Tradu or any form of personal or investment advice. Tradu neither endorses nor guarantees offerings of third-party speakers, nor is Tradu responsible for the content, veracity or opinions of third-party speakers, presenters or participants.
Harmonic Patterns

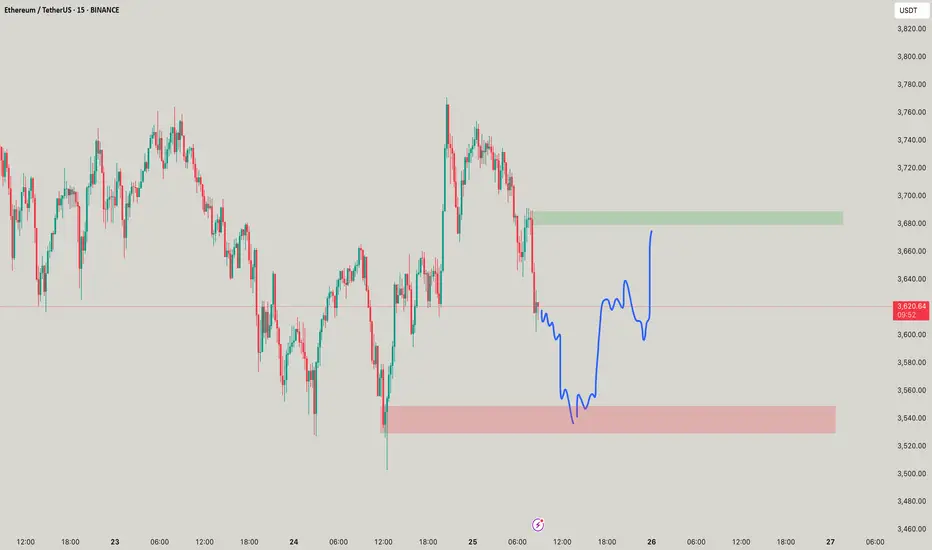
ETH ~ Receive more than you expect!Such nice momentum to see but buys at red! but always place to limits to take those buys!
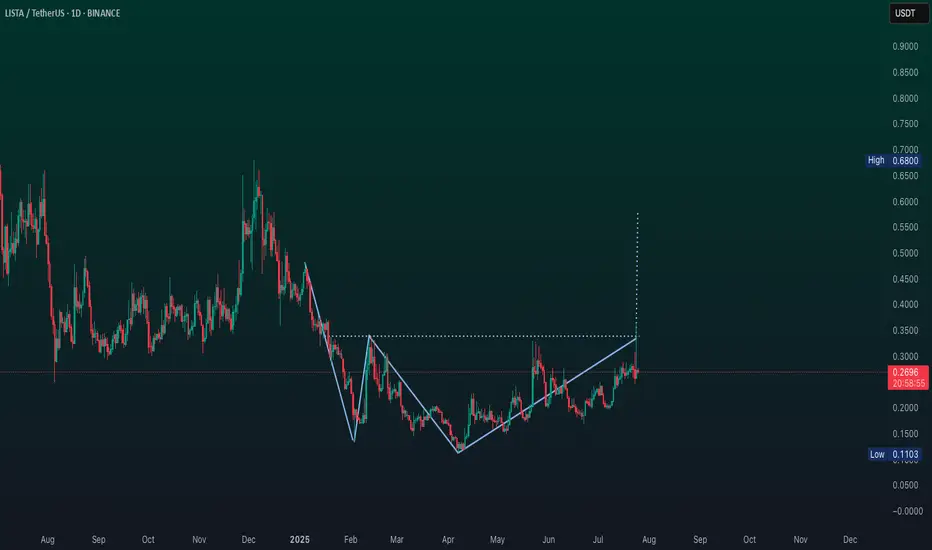
$lista ready to fly?Lista DAO’s 3.65% 24-hour price rise appears driven by a major exchange listing, bullish technical momentum, and strategic ecosystem developments.
Bithumb listing (24 July) boosted accessibility for South Korean traders.
Technical indicators show bullish momentum above key moving averages.
Partnerships with NanoLabs and protocol upgrades enhanced investor confidence.
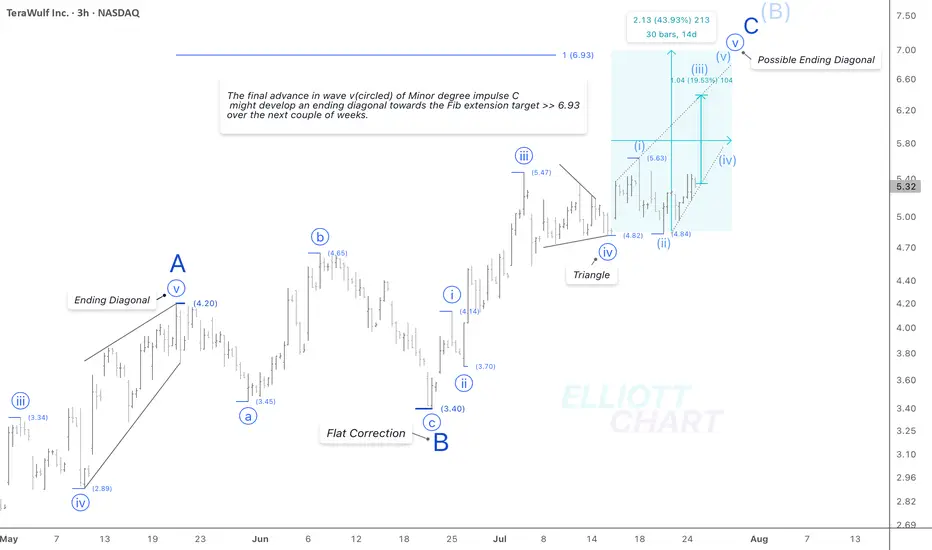
WULF / 3hWave Analysis >> While the current outlook on WULF remains consistent with previous analysis, the internal structure of wave v (circled) suggests the potential development of an ending diagonal in the final leg of Minor degree wave C.
Trend Analysis >> Upon completion of Minor degree wave C, the countertrend advance of Intermediate degree wave (B), which has been unfolding since April 9, is likely to give way to a decline in wave (C) of the same degree. This downtrend might begin in the coming days and potentially extend through the end of the year.
NASDAQ:WULF CRYPTOCAP:BTC BITSTAMP:BTCUSD MARKETSCOM:BITCOIN
#CryptoStocks #WULF #BTCMining #Bitcoin #BTC
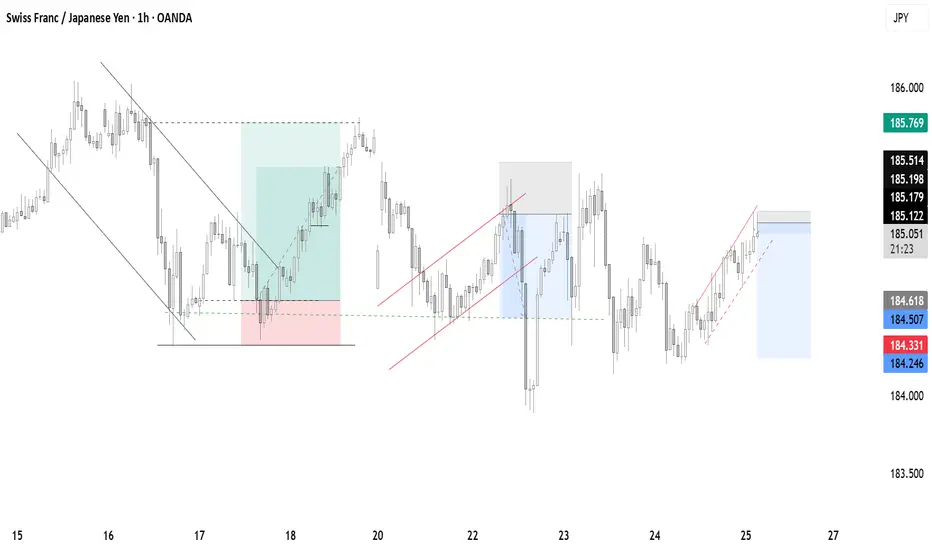
CHFJPY ASIA Session BearsDuring this trading session, we should see price retest the lows created before a strong bullish continuation.
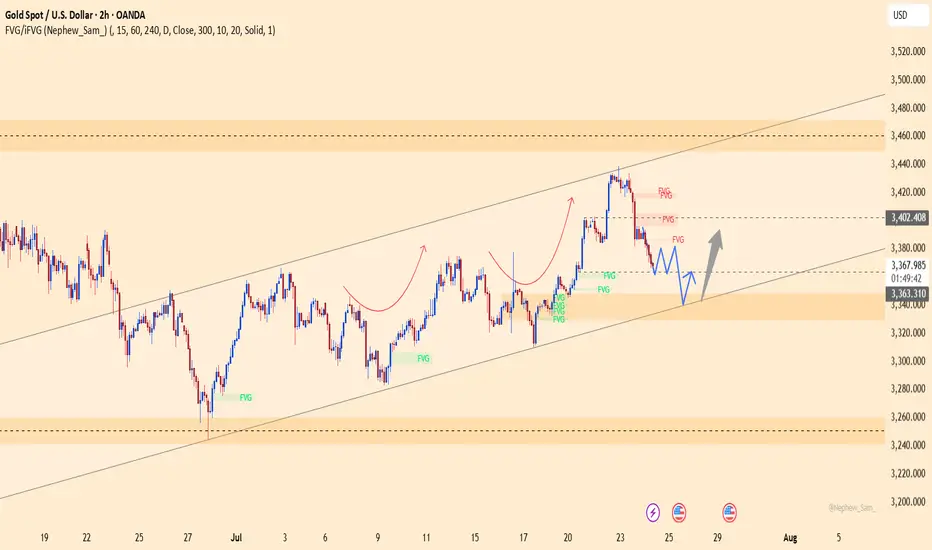
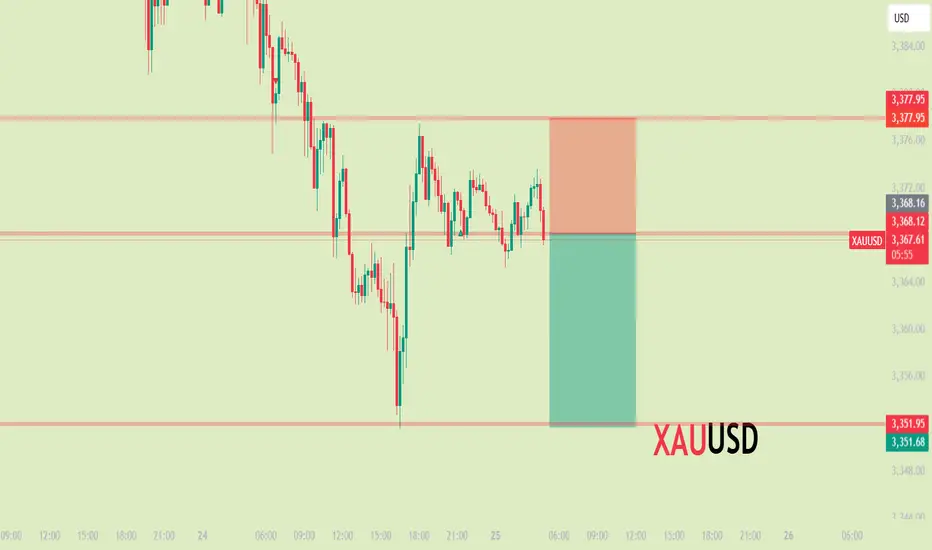
XAUUSD – healthy correction, ready to bounce from 3,338Gold is retracing within an ascending channel after facing rejection at the FVG zone near 3,402.800. This pullback is seen as a healthy correction, with confluence support around 3,338, which previously acted as a springboard for bullish momentum.
As long as price holds above this zone, a rebound toward 3,402 remains likely.
Primary scenario
Buy zone: 3,338
Target: 3,402
Invalidation: Break below 3,320
Note
Weak volume near the FVG zone may cause short-term consolidation, but the broader trend still favors buyers.
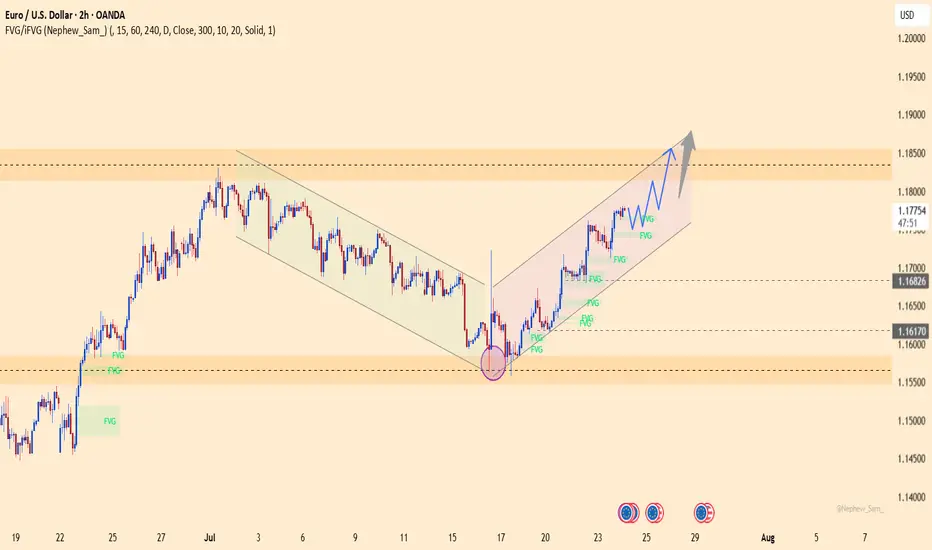
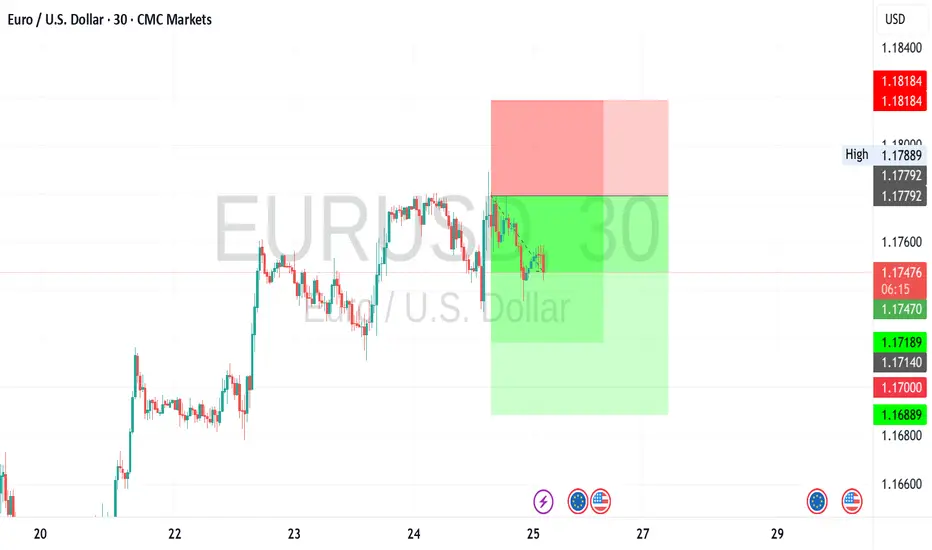
EURUSD – The Comeback is Real! After weeks trapped in a descending channel, EURUSD has broken out in style, launching into a clean bullish channel. Price is now carving a staircase of FVG zones, with momentum clearly favoring the bulls.
What’s fueling the fire?
Flash Manufacturing PMI from Europe beat forecasts
Eurozone consumer confidence improved
Markets pricing in dovish Fed as jobless claims dropped but inflation expectations stall
As long as price stays above 1.1750 and respects the ascending channel, the 1.1850 zone is well within reach.
Strategy: Buy the dips inside the bullish channel. FVGs act as stepping stones for further upside.
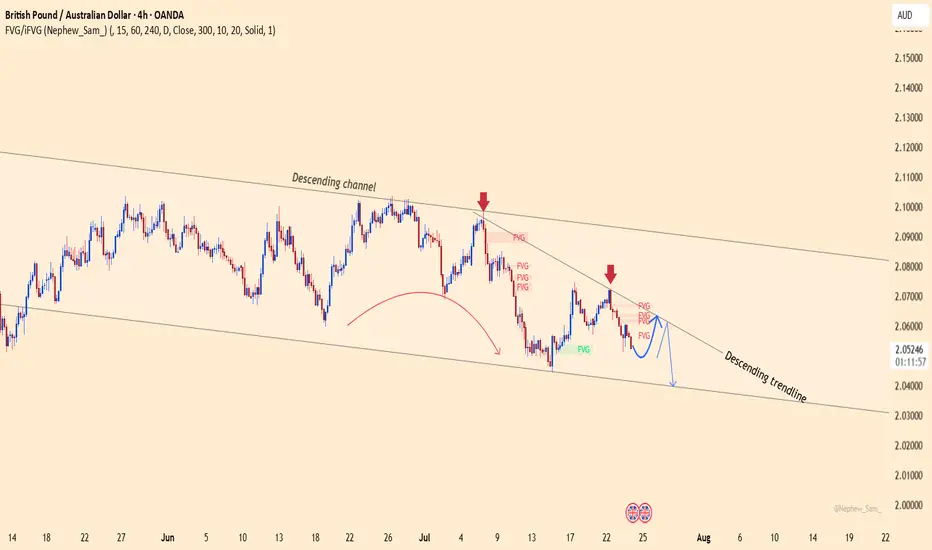
GBPAUD – False breakout or the next sharp drop?The GBPAUD pair continues to trade within a well-defined descending channel, with every bullish attempt being firmly rejected by the descending trendline. Recent candlesticks show a clear sell signal right at the FVG resistance zone.
Market-moving news:
Australia’s manufacturing PMI surprised to the upside → strong support for AUD
GBP remains under pressure after dovish comments from the BoE, diminishing hopes of further rate hikes.
If the price fails to break above the 2.0640 zone — creating yet another fake top — a sharp drop toward 2.0400 is highly likely.
Strategy: Look to SELL near the trendline and FVG zone, targeting 2.0400.
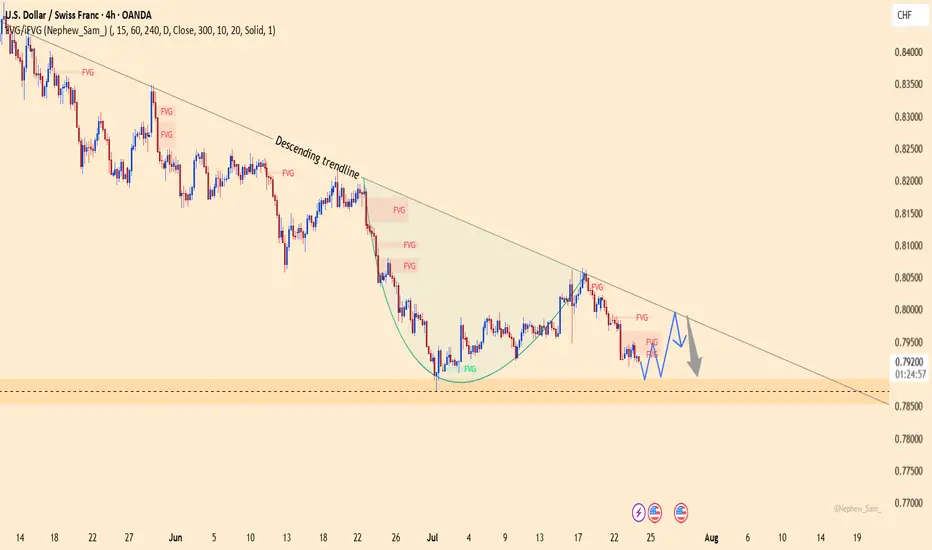
USDCHF – The Wind Still Blows South!USDCHF remains trapped below the descending trendline since June. Every bullish attempt has been sharply rejected – showing sellers are still in control.
Fresh U.S. data just released:
Jobless claims dropped → strong labor market → Fed likely to keep rates high → USD gains strength.
Manufacturing PMI beat expectations → resilient economy → more reason for a hawkish Fed.
But don’t forget: CHF is attracting safe-haven flows, adding downward pressure on USD!
If price fails to break above 0.7990 and gets rejected at the trendline, a drop toward 0.7890 is likely.
Strategy: Look to SELL around the trendline – follow the trend, not your emotions!
XAUUSDXAUUSD Updated in 15M :
The gold signal is marked on the chart based on the latest price changes and the supply and demand in the market. These points include the entry point, stop loss, and take profit
EURUSD Identified a more pronounced risk aversion bias Identified a more pronounced risk aversion bias in the current market after integrating news opinion, social media keyword distribution and institutional trading behavior. Recent economic data has deviated from expectations, raising concerns about global economic growth. Relevant currency pairs gradually lost the initiative in the market, and the price trend showed signs of weak oscillation or downward break.
From the viewpoint of sentiment index, investors generally turned to be cautious, and the attraction of safe-haven assets such as the dollar, yen, Swiss franc, etc. rose. This risk aversion is also confirmed on the flow side of the equation - the system recognizes that some funds have withdrawn from risky currency pairs and flowed to more liquid assets.
Combines these dynamic information to judge that the bearish trend may continue in the short term, and recommends that investors maintain a defensive mindset and lay out their strategies in a predominantly short direction.
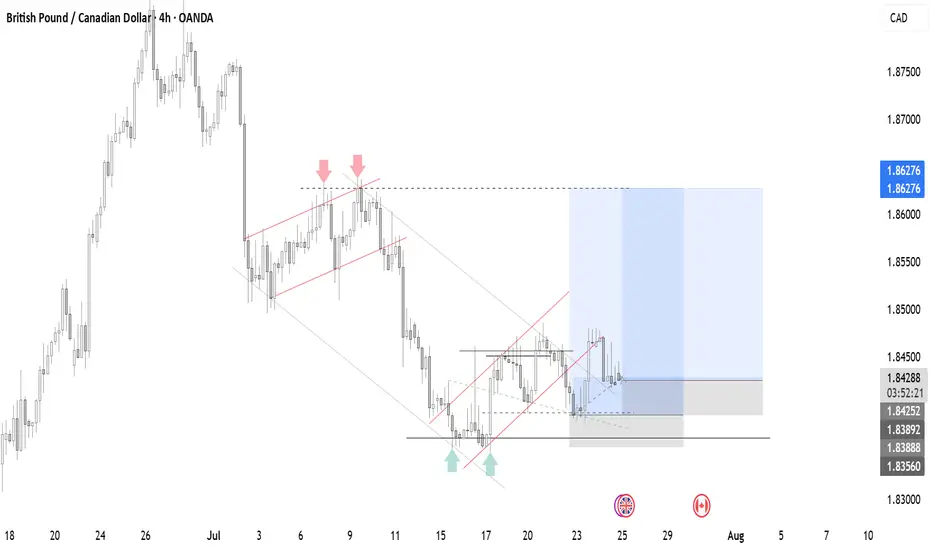
BUY GBPCADHere is an opportunity to reenter buy positions on GBPCAD. The bullish trend has officially began.
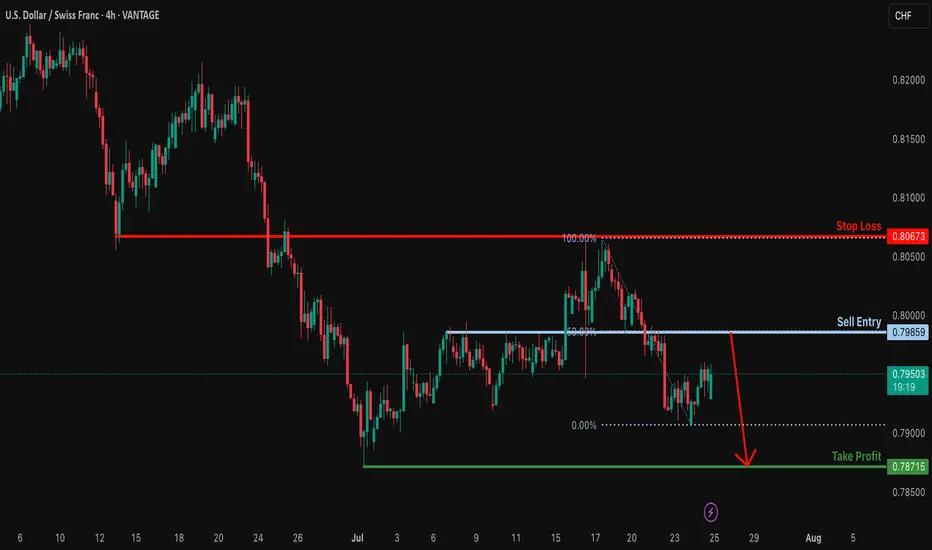
Bearish drop?USD/CHF is rising towards the resistance level which is an overlap resitance that lines up with the 50% FIbonacci retracement and could reverse from this level to our take profit.
Entry: 0.7985
Why we like it:
There is an overlap reistance that lines up with the 50% FIbonacci retraecment.
Stop loss: 0.8067
Why we like it:
There is an overlap resitance.
Take profit: 0.7871
Why we like it:
There is a swing low support.
Enjoying your TradingView experience? Review us!
Please be advised that the information presented on TradingView is provided to Vantage (‘Vantage Global Limited’, ‘we’) by a third-party provider (‘Everest Fortune Group’). Please be reminded that you are solely responsible for the trading decisions on your account. There is a very high degree of risk involved in trading. Any information and/or content is intended entirely for research, educational and informational purposes only and does not constitute investment or consultation advice or investment strategy. The information is not tailored to the investment needs of any specific person and therefore does not involve a consideration of any of the investment objectives, financial situation or needs of any viewer that may receive it. Kindly also note that past performance is not a reliable indicator of future results. Actual results may differ materially from those anticipated in forward-looking or past performance statements. We assume no liability as to the accuracy or completeness of any of the information and/or content provided herein and the Company cannot be held responsible for any omission, mistake nor for any loss or damage including without limitation to any loss of profit which may arise from reliance on any information supplied by Everest Fortune Group.
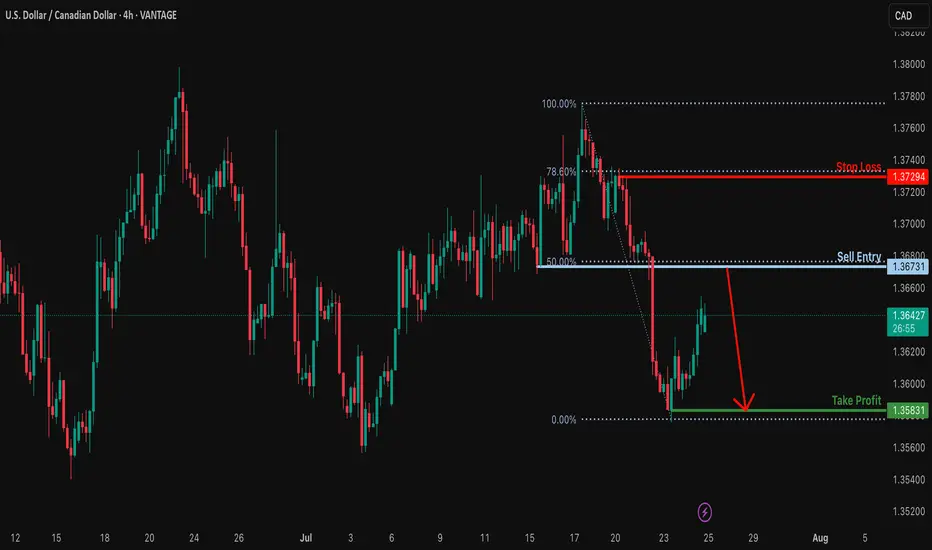
Heading into 50% Fibonacci resistance?USD/CAD is rising towards the resistance level, which serves as a pullback resistance that aligns with the 50% Fibonacci retracement and could reverse from this level to our take-profit target.
Entry: 1.3673
Why we like it:
There is a pullback resistance that lines up with the 50% Fibonacci retracement.
Stop loss: 1.3729
Why we like it:
There is a pullback resistance that lines up with the 78.6% Fibonacci retracement.
Take profit: 1.3583
Why we like it:
There is a swing low support.
Enjoying your TradingView experience? Review us!
Please be advised that the information presented on TradingView is provided to Vantage (‘Vantage Global Limited’, ‘we’) by a third-party provider (‘Everest Fortune Group’). Please be reminded that you are solely responsible for the trading decisions on your account. There is a very high degree of risk involved in trading. Any information and/or content is intended entirely for research, educational and informational purposes only and does not constitute investment or consultation advice or investment strategy. The information is not tailored to the investment needs of any specific person and therefore does not involve a consideration of any of the investment objectives, financial situation or needs of any viewer that may receive it. Kindly also note that past performance is not a reliable indicator of future results. Actual results may differ materially from those anticipated in forward-looking or past performance statements. We assume no liability as to the accuracy or completeness of any of the information and/or content provided herein and the Company cannot be held responsible for any omission, mistake nor for any loss or damage including without limitation to any loss of profit which may arise from reliance on any information supplied by Everest Fortune Group.
Bullish bounce for the Cable?The price is falling towards the suoprt level which is an overlap support that is slightly above the 61.8% Fibonacci retracement and could bounce from this level to our take profit.
Entry: 1.3468
Why we like it:
There is an overlap support that is slightly above the 61.8% Fibonacci retracement.
Stop loss: 1.3377
Why we like it:
There is a swing low support.
Take profit: 1.3577
Why we like it:
There is a pullback resistance.
Enjoying your TradingView experience? Review us!
Please be advised that the information presented on TradingView is provided to Vantage (‘Vantage Global Limited’, ‘we’) by a third-party provider (‘Everest Fortune Group’). Please be reminded that you are solely responsible for the trading decisions on your account. There is a very high degree of risk involved in trading. Any information and/or content is intended entirely for research, educational and informational purposes only and does not constitute investment or consultation advice or investment strategy. The information is not tailored to the investment needs of any specific person and therefore does not involve a consideration of any of the investment objectives, financial situation or needs of any viewer that may receive it. Kindly also note that past performance is not a reliable indicator of future results. Actual results may differ materially from those anticipated in forward-looking or past performance statements. We assume no liability as to the accuracy or completeness of any of the information and/or content provided herein and the Company cannot be held responsible for any omission, mistake nor for any loss or damage including without limitation to any loss of profit which may arise from reliance on any information supplied by Everest Fortune Group.

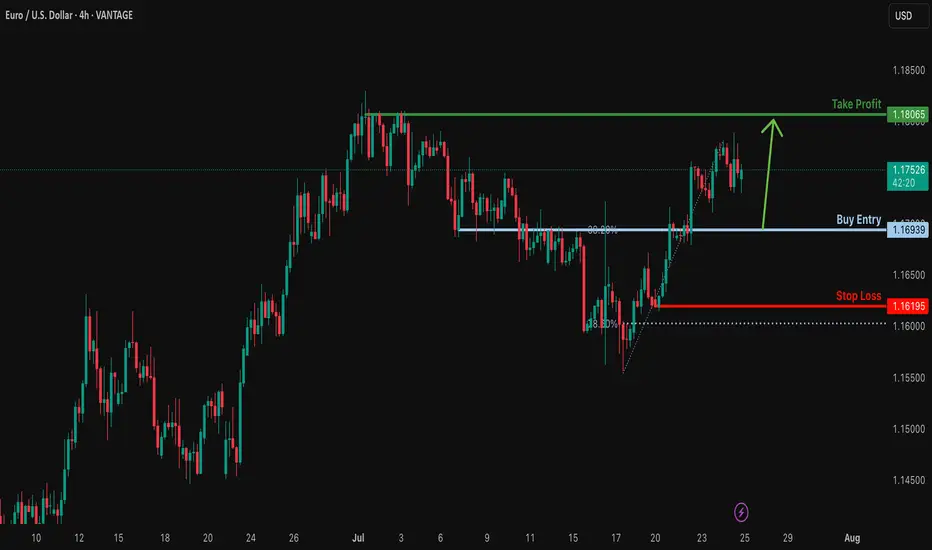
Bullish bounce off overlap support?EUR/USD is falling towards the support level, which is an overlap support that aligns with the 38.2% Fibonacci retracement and could bounce from this level to our take profit.
Entry: 1.1693
Why we like it:
There is an overlap support that lines up with the 38.2% Fibonacci retracement.
Stop loss: 1.1619
Why we like it:
There is a pullback support that is slightly above the 78.6% Fibonacci retracement.
Take profit: 1.1806
Why we like it:
There is a swing high resistance.
Enjoying your TradingView experience? Review us!
Please be advised that the information presented on TradingView is provided to Vantage (‘Vantage Global Limited’, ‘we’) by a third-party provider (‘Everest Fortune Group’). Please be reminded that you are solely responsible for the trading decisions on your account. There is a very high degree of risk involved in trading. Any information and/or content is intended entirely for research, educational and informational purposes only and does not constitute investment or consultation advice or investment strategy. The information is not tailored to the investment needs of any specific person and therefore does not involve a consideration of any of the investment objectives, financial situation or needs of any viewer that may receive it. Kindly also note that past performance is not a reliable indicator of future results. Actual results may differ materially from those anticipated in forward-looking or past performance statements. We assume no liability as to the accuracy or completeness of any of the information and/or content provided herein and the Company cannot be held responsible for any omission, mistake nor for any loss or damage including without limitation to any loss of profit which may arise from reliance on any information supplied by Everest Fortune Group.
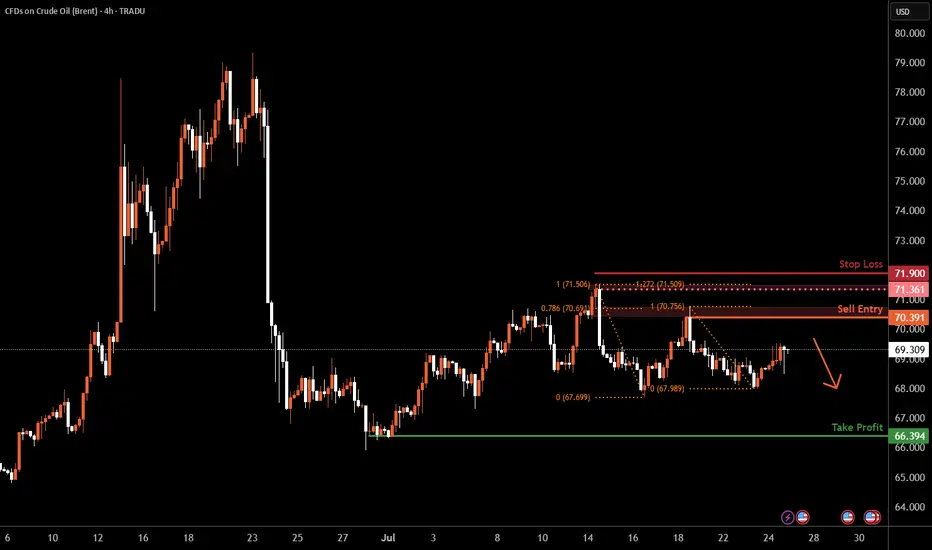
Brent Oil H4 | Heading into a swing-high resistanceBrent oil (UKOIL) is rising towards a swing-high resistance and could potentially reverse off this level to drop lower.
Sell entry is at 70.39 which is a swing-high resistance that aligns closely with the 78.6% Fibonacci retracement.
Stop loss is at 71.90 which is a level that sits above the 127.2% Fibonacci extension and a swing-high resistance.
Take profit is at 66.39 which is a swing-low support.
High Risk Investment Warning
Trading Forex/CFDs on margin carries a high level of risk and may not be suitable for all investors. Leverage can work against you.
Stratos Markets Limited (tradu.com ):
CFDs are complex instruments and come with a high risk of losing money rapidly due to leverage. 66% of retail investor accounts lose money when trading CFDs with this provider. You should consider whether you understand how CFDs work and whether you can afford to take the high risk of losing your money.
Stratos Europe Ltd (tradu.com ):
CFDs are complex instruments and come with a high risk of losing money rapidly due to leverage. 66% of retail investor accounts lose money when trading CFDs with this provider. You should consider whether you understand how CFDs work and whether you can afford to take the high risk of losing your money.
Stratos Global LLC (tradu.com ):
Losses can exceed deposits.
Please be advised that the information presented on TradingView is provided to Tradu (‘Company’, ‘we’) by a third-party provider (‘TFA Global Pte Ltd’). Please be reminded that you are solely responsible for the trading decisions on your account. There is a very high degree of risk involved in trading. Any information and/or content is intended entirely for research, educational and informational purposes only and does not constitute investment or consultation advice or investment strategy. The information is not tailored to the investment needs of any specific person and therefore does not involve a consideration of any of the investment objectives, financial situation or needs of any viewer that may receive it. Kindly also note that past performance is not a reliable indicator of future results. Actual results may differ materially from those anticipated in forward-looking or past performance statements. We assume no liability as to the accuracy or completeness of any of the information and/or content provided herein and the Company cannot be held responsible for any omission, mistake nor for any loss or damage including without limitation to any loss of profit which may arise from reliance on any information supplied by TFA Global Pte Ltd.
The speaker(s) is neither an employee, agent nor representative of Tradu and is therefore acting independently. The opinions given are their own, constitute general market commentary, and do not constitute the opinion or advice of Tradu or any form of personal or investment advice. Tradu neither endorses nor guarantees offerings of third-party speakers, nor is Tradu responsible for the content, veracity or opinions of third-party speakers, presenters or participants.
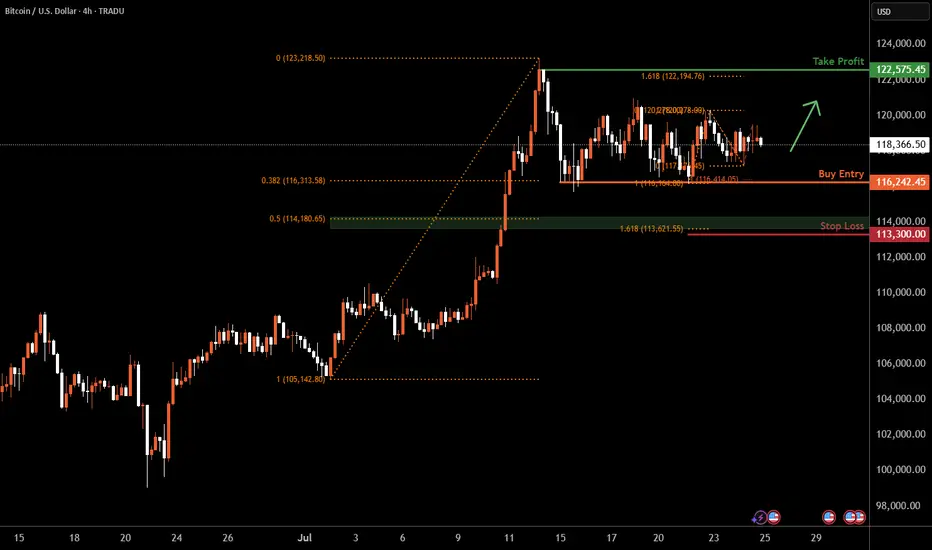
Bitcoin H4 | Falling toward a multi-swing-low supportBitcoin (BTC/USD) is falling towards a multi-swing-low support and could potentially bounce off this level to climb higher.
Buy entry is at 116,242.45 which is a multi-swing-low support that aligns with a confluence of Fibonacci levels i.e. the 38.2% retracement and the 100% projection.
Stop loss is at 113,300.00 which is a level that lies underneath a support zone that is identified by a confluence of Fibonacci levels i.e. the 50% retracement and the 161.8% extension.
Take profit is at 122,575.45 which is a swing-high resistance that aligns close to the all-time-high.
High Risk Investment Warning
Trading Forex/CFDs on margin carries a high level of risk and may not be suitable for all investors. Leverage can work against you.
Stratos Markets Limited (tradu.com ):
CFDs are complex instruments and come with a high risk of losing money rapidly due to leverage. 66% of retail investor accounts lose money when trading CFDs with this provider. You should consider whether you understand how CFDs work and whether you can afford to take the high risk of losing your money.
Stratos Europe Ltd (tradu.com ):
CFDs are complex instruments and come with a high risk of losing money rapidly due to leverage. 66% of retail investor accounts lose money when trading CFDs with this provider. You should consider whether you understand how CFDs work and whether you can afford to take the high risk of losing your money.
Stratos Global LLC (tradu.com ):
Losses can exceed deposits.
Please be advised that the information presented on TradingView is provided to Tradu (‘Company’, ‘we’) by a third-party provider (‘TFA Global Pte Ltd’). Please be reminded that you are solely responsible for the trading decisions on your account. There is a very high degree of risk involved in trading. Any information and/or content is intended entirely for research, educational and informational purposes only and does not constitute investment or consultation advice or investment strategy. The information is not tailored to the investment needs of any specific person and therefore does not involve a consideration of any of the investment objectives, financial situation or needs of any viewer that may receive it. Kindly also note that past performance is not a reliable indicator of future results. Actual results may differ materially from those anticipated in forward-looking or past performance statements. We assume no liability as to the accuracy or completeness of any of the information and/or content provided herein and the Company cannot be held responsible for any omission, mistake nor for any loss or damage including without limitation to any loss of profit which may arise from reliance on any information supplied by TFA Global Pte Ltd.
The speaker(s) is neither an employee, agent nor representative of Tradu and is therefore acting independently. The opinions given are their own, constitute general market commentary, and do not constitute the opinion or advice of Tradu or any form of personal or investment advice. Tradu neither endorses nor guarantees offerings of third-party speakers, nor is Tradu responsible for the content, veracity or opinions of third-party speakers, presenters or participants.
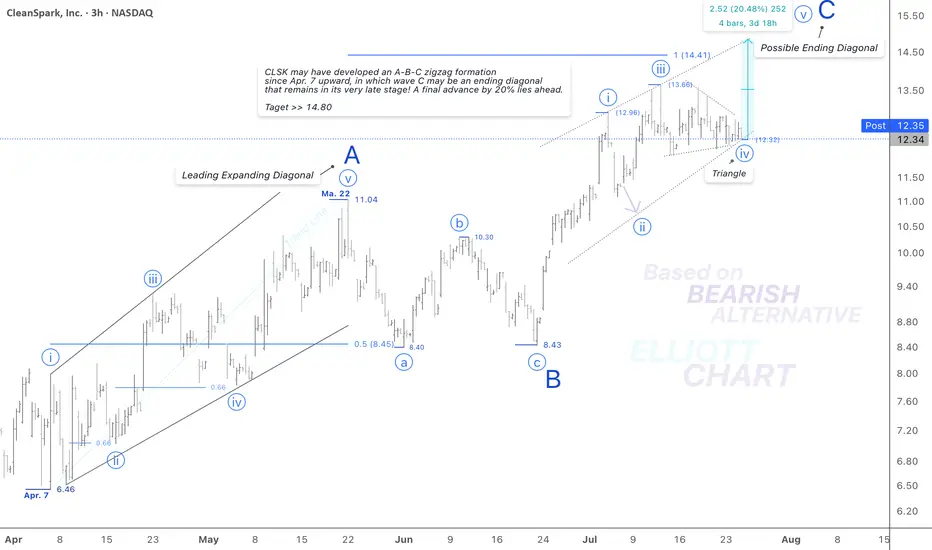
$CLSK / 3hNASDAQ:CLSK
According to the bearish alternative in my weekly frame(not posted!), I'd analyzed the rising tide since April 7 as an A-B-C zigzag formation in a correction of the Intermediate degree wave (B) <<. Not shown in this 3h frame.
Wave Analysis >> As illustrated in the 3h-frame above, the Minor degree wave C as the last part of the correction upward in wave (B) may thoroughly develop in an ending diagonal, which remains in its very late stage; after a triangle correction in Minute degree wave iv(circled) now a final advance in the same degree wave v(circled) is anticipated to follow very soon to conclude the ending diagonal wave C of the countertrend advance of wave (B).
Trend Analysis >> After completion of the possible ending diagonal as Minor degree wave C, the trend will soon turn downward in an ultimate decline in Intermediate degree wave (C), which will likely last until the end of the year!!
#CryptoStocks #CLSK #BTCMining #Bitcoin #BTC
NASDAQ:CLSK CRYPTOCAP:BTC BITSTAMP:BTCUSD MARKETSCOM:BITCOIN
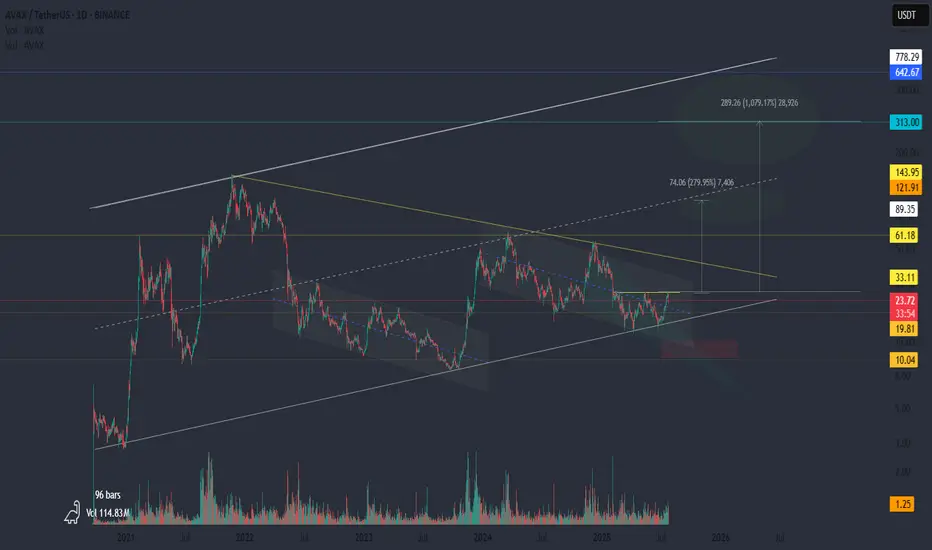
AVAX: A Quiet Rocket?This might be the calm before the cycle.
📍 All the liquidity is above.
Levels like 33 and 61 aren’t just resistance — they’re fuel. Clusters of short liquidations and forgotten limit orders are sitting right there. If we get a breakout, it could be sharp. And if there’s another pullback? Don’t panic. That would be the test — the shakeout before the move.
🚀 If the cycle kicks in, AVAX could be one of the silent leaders.
While the crowd is focused elsewhere, AVAX has been building quietly: structure, accumulation, time. The kind of setup that doesn’t scream hype, but whispers opportunity.
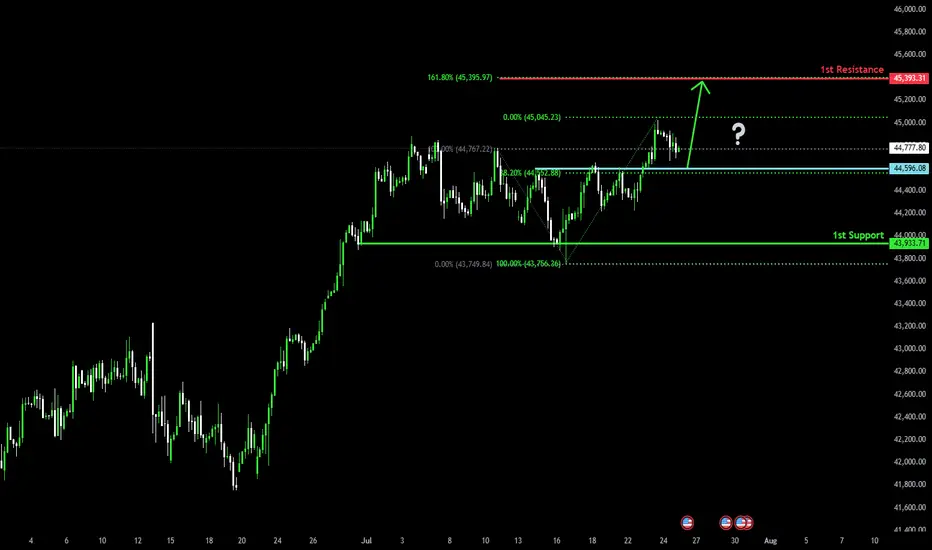
Bullish bounce off pullback support?Dow Jones (US30) is falling towards the pivot and could bounce to the 161.8% Fibonacci resistance.
Pivot: 44,596.08
1st Support: 43,933.71
1st Resistance: 45,393.31
Risk Warning:
Trading Forex and CFDs carries a high level of risk to your capital and you should only trade with money you can afford to lose. Trading Forex and CFDs may not be suitable for all investors, so please ensure that you fully understand the risks involved and seek independent advice if necessary.
Disclaimer:
The above opinions given constitute general market commentary, and do not constitute the opinion or advice of IC Markets or any form of personal or investment advice.
Any opinions, news, research, analyses, prices, other information, or links to third-party sites contained on this website are provided on an "as-is" basis, are intended only to be informative, is not an advice nor a recommendation, nor research, or a record of our trading prices, or an offer of, or solicitation for a transaction in any financial instrument and thus should not be treated as such. The information provided does not involve any specific investment objectives, financial situation and needs of any specific person who may receive it. Please be aware, that past performance is not a reliable indicator of future performance and/or results. Past Performance or Forward-looking scenarios based upon the reasonable beliefs of the third-party provider are not a guarantee of future performance. Actual results may differ materially from those anticipated in forward-looking or past performance statements. IC Markets makes no representation or warranty and assumes no liability as to the accuracy or completeness of the information provided, nor any loss arising from any investment based on a recommendation, forecast or any information supplied by any third-party.
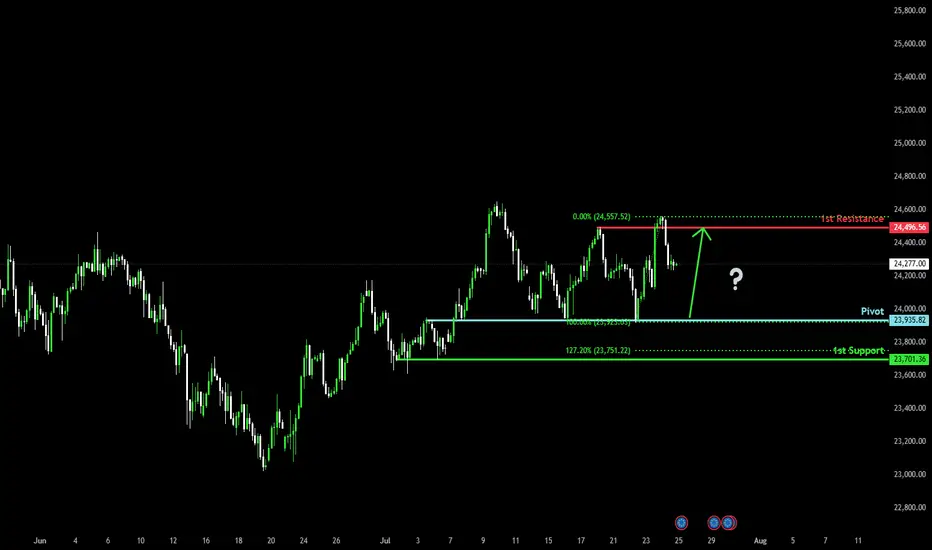
Bullish bounce off major support?DAX40 (DE40) is falling towards the pivot, which has been identified as an overlap support and could bounce to the 1st resistance.
Pivot: 23,935.82
1st Support: 23,701.36
1st Resistance: 24,496.56
Risk Warning:
Trading Forex and CFDs carries a high level of risk to your capital and you should only trade with money you can afford to lose. Trading Forex and CFDs may not be suitable for all investors, so please ensure that you fully understand the risks involved and seek independent advice if necessary.
Disclaimer:
The above opinions given constitute general market commentary, and do not constitute the opinion or advice of IC Markets or any form of personal or investment advice.
Any opinions, news, research, analyses, prices, other information, or links to third-party sites contained on this website are provided on an "as-is" basis, are intended only to be informative, is not an advice nor a recommendation, nor research, or a record of our trading prices, or an offer of, or solicitation for a transaction in any financial instrument and thus should not be treated as such. The information provided does not involve any specific investment objectives, financial situation and needs of any specific person who may receive it. Please be aware, that past performance is not a reliable indicator of future performance and/or results. Past Performance or Forward-looking scenarios based upon the reasonable beliefs of the third-party provider are not a guarantee of future performance. Actual results may differ materially from those anticipated in forward-looking or past performance statements. IC Markets makes no representation or warranty and assumes no liability as to the accuracy or completeness of the information provided, nor any loss arising from any investment based on a recommendation, forecast or any information supplied by any third-party.
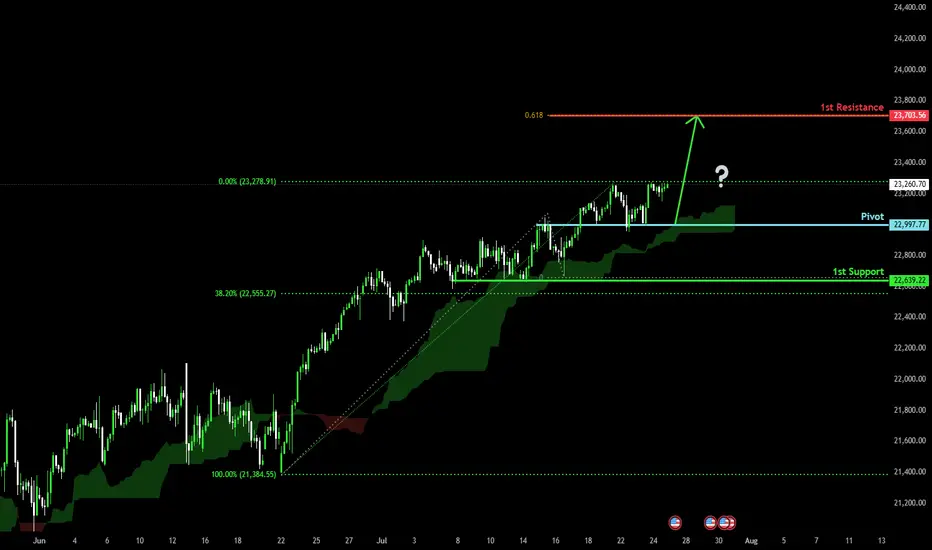
Bullish continuation?USTEC has bounced off the pivot and could potentially rise to the 1st resistancewhihc lines up with the 61.8% Fibonacci projection.
Pivot: 22,997.77
1st Support: 22,639.22
1st Resistance: 23,703.56
Risk Warning:
Trading Forex and CFDs carries a high level of risk to your capital and you should only trade with money you can afford to lose. Trading Forex and CFDs may not be suitable for all investors, so please ensure that you fully understand the risks involved and seek independent advice if necessary.
Disclaimer:
The above opinions given constitute general market commentary, and do not constitute the opinion or advice of IC Markets or any form of personal or investment advice.
Any opinions, news, research, analyses, prices, other information, or links to third-party sites contained on this website are provided on an "as-is" basis, are intended only to be informative, is not an advice nor a recommendation, nor research, or a record of our trading prices, or an offer of, or solicitation for a transaction in any financial instrument and thus should not be treated as such. The information provided does not involve any specific investment objectives, financial situation and needs of any specific person who may receive it. Please be aware, that past performance is not a reliable indicator of future performance and/or results. Past Performance or Forward-looking scenarios based upon the reasonable beliefs of the third-party provider are not a guarantee of future performance. Actual results may differ materially from those anticipated in forward-looking or past performance statements. IC Markets makes no representation or warranty and assumes no liability as to the accuracy or completeness of the information provided, nor any loss arising from any investment based on a recommendation, forecast or any information supplied by any third-party.