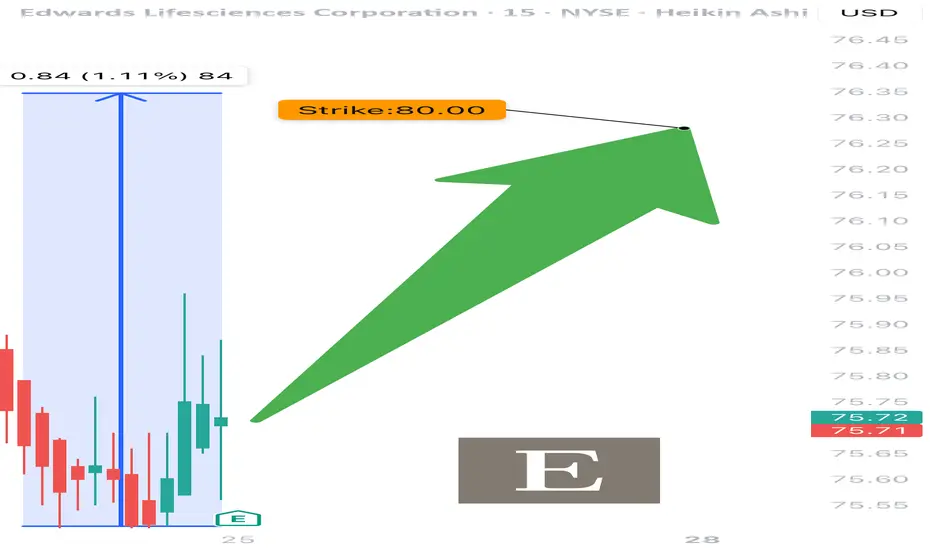
EW EARNINGS TRADE SETUP
📈 EW EARNINGS TRADE SETUP (07/24) 📈
💥 Quiet stock, loud opportunity. Fundamentals strong. Market asleep. We’re not.
🧠 Quick Read:
• Beat rate: 88% over 8 quarters
• Margins elite (OP Margin: 29%, Net: 75.7%)
• RSI 43 → Neutral setup with room to run
• Big OI at $80 calls (6.7k+) 💪
• IV not bloated → low crush risk ✅
🎯 TRADE IDEA
🟢 Buy EW $80 Call exp 8/15
💰 Entry: $1.55
🎯 Target: $4.65
🛑 Stop: $0.77
📈 Confidence: 70%
📊 Why it works:
• Medical device demand + aging population = macro tailwind
• Market ignoring it = opportunity
• Risk-on tape + IV sweet spot
#EW #OptionsAlert #MedicalTechStocks #EarningsSetup #LongCall #RiskReward #OptionsTrading #StockAlert #SwingTrade #TradingView #SmartMoneyFlow
Harmonic Patterns
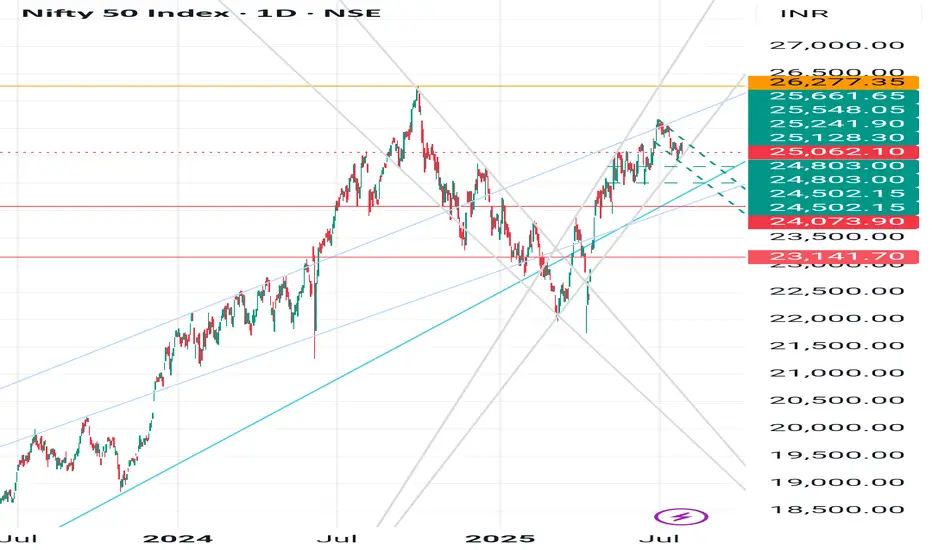
Nifty : range bound and down trend Nifty is making a pattern and following a channel for finishing up the pattern. Important levels to watch next is : 24800 & 24500 as major support.
Post this we nay expect great rally towards upside 2600, 26700
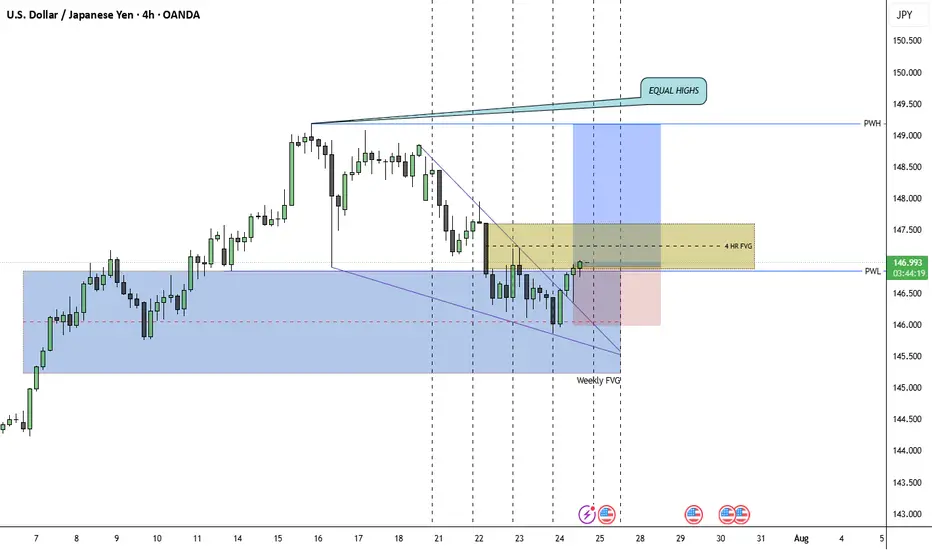
Bullish on usdjpyI am currently long USDJPY. It's Thursday, and there’s still plenty of buy-side liquidity left. The highs from Monday, Tuesday, and Wednesday remain unchallenged. We've also traded into a weekly PD array (weekly FVG), respecting the C.E. and moving away, which signals a local low for me. Additionally, we're breaking out of a falling wedge, with the breakout target being the top of the wedge. Lastly, DXY is beginning to show bullish market structure shifts on the 15m and 1h timeframes. I am targeting those relative equal highs. Invalidation lies at the most recent swing low.
Is it time to buy?Rising from a significant low, a pullback, and increasing volume can be good signs for a potential buy.
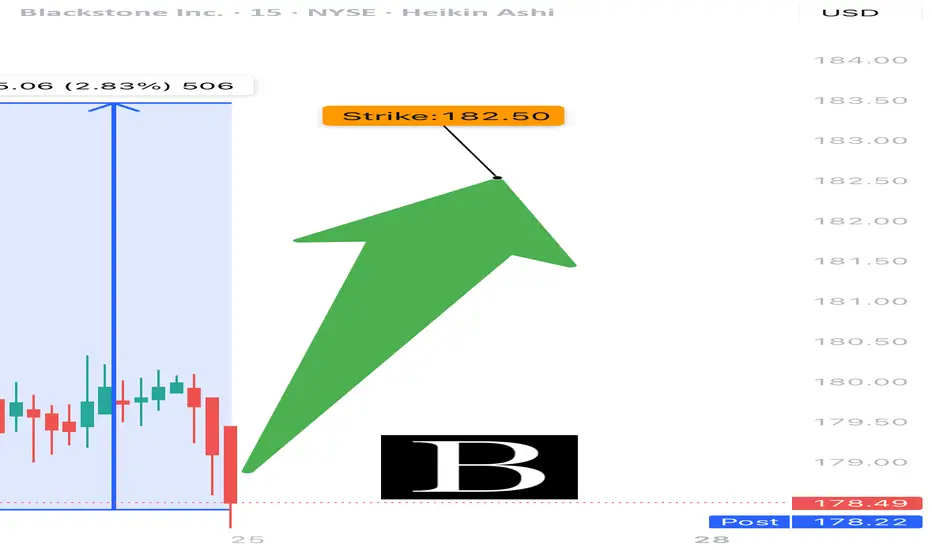
BX EARNINGS TRADE (07/24)
🚨 BX EARNINGS TRADE (07/24) 🚨
💼 Blackstone drops earnings after close — setup looks 🔥 bullish
🧠 Key Insights:
• 📉 TTM Revenue: -8.2%, but Q2 bounce back = $764M profit
• 💰 Margins: Strong → 45.3% operating, 20.6% net
• 📈 RSI: 73.88 = HOT momentum
• 🧠 AUM: $1.2 Trillion = 🐘 heavyweight
• 🔥 Options Flow: Call skew at $182.50 = institutional bullish bets
• 🧮 Expected move: ~5% post-earnings
💥 TRADE SETUP
🟢 Buy BX $182.50 Call exp 7/25
💰 Entry: $0.69
🎯 Target: $1.38–$2.07 (200–300%)
🛑 Stop: $0.34
📈 Confidence: 85%
⏰ Entry: Before Close Today (Pre-Earnings)
📊 IV Rank: 0.75 → options decently priced
⚠️ Watch resistance at $185 — breakout = 🚀
Tight risk, big reward. Pure earnings momentum play.
#BX #EarningsPlay #OptionsTrading #Blackstone #UnusualOptionsActivity #CallOption #TradingView #FinanceStock #InstitutionalFlow #OptionsAlert
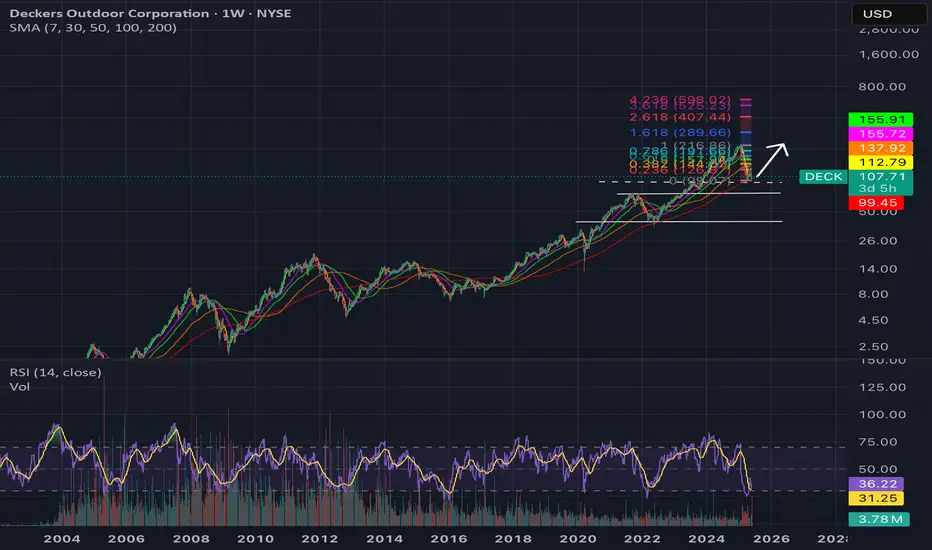
Long $DECK - NYSE:DECK is the only growth story I'm comfortable buying. This was wall street darling for many years. I believe sell off was overdone.
- It has lot of room to run. It is getting traction and NYSE:NKE because of law of large number is not growing much in %age.
- However, NYSE:DECK has lot of road ahead and it can grow for many years to come. Global expansion is also not out of the question.
- I strongly believe NYSE:DECK will make an all time high when this tariff narrative takes a backseat.
- Another bullish thing for NYSE:DECK is that Trump doesn't plan to bring back shoes or clothing manufacturing back in US.
DOGECOIN : Should we expect an increase?Hello friends🙌
📈Given the decline we had, you can see that buyers entered at the specified support and formed a double bottom reversal pattern, which is a strong signal on support.
📉Considering the possible market correction, we placed two more buy levels lower so that we can buy there if the price corrects.
⚠Don't forget about capital and risk management, friends.
🔥Follow us for more signals🔥
*Trade safely with us*

APT : Long term purchaseHello friends🙌
👀You see that the price is in a range and now we are at the bottom of the range. The scenario is simple. The bottom of the range is a good buying opportunity that can be used because 80% of the failures in the range are fake.
⚠So we can buy with risk and capital management and move with it to the specified targets.
🔥Follow us for more signals🔥
*Trade safely with us*

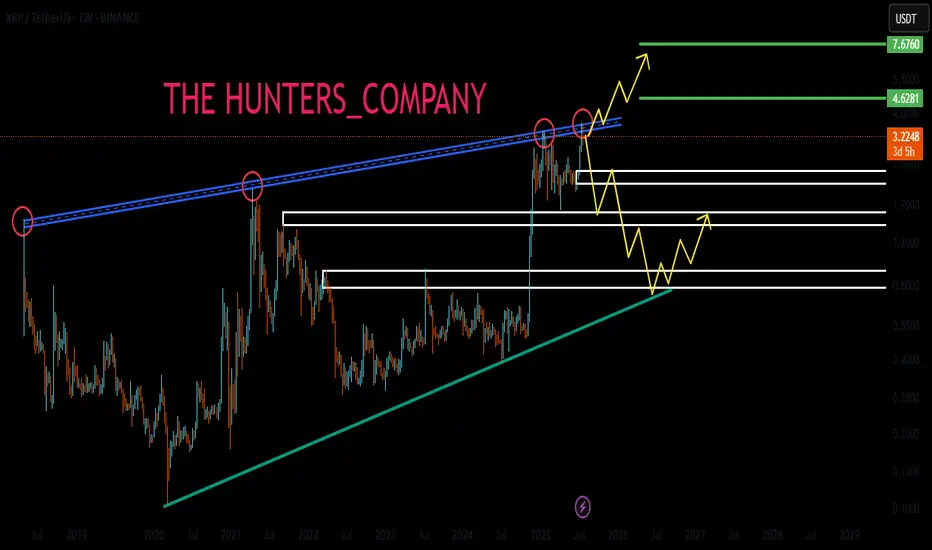
XRP : Long term analysisHello friends🙌
🔊Considering the great growth that the price has had and has set a new ceiling, be careful because we are at the ceiling and when we are at the price ceiling, we should always expect a price correction...
⚠Now, given the strong upward trend we have, you can buy with risk and capital management, but our suggestion is lower prices for the possibility of a correction and the possibility of a reversal pattern.
So we have identified important support levels for you and we have also identified price targets.
🔥Follow us for more signals🔥
*Trade safely with us*
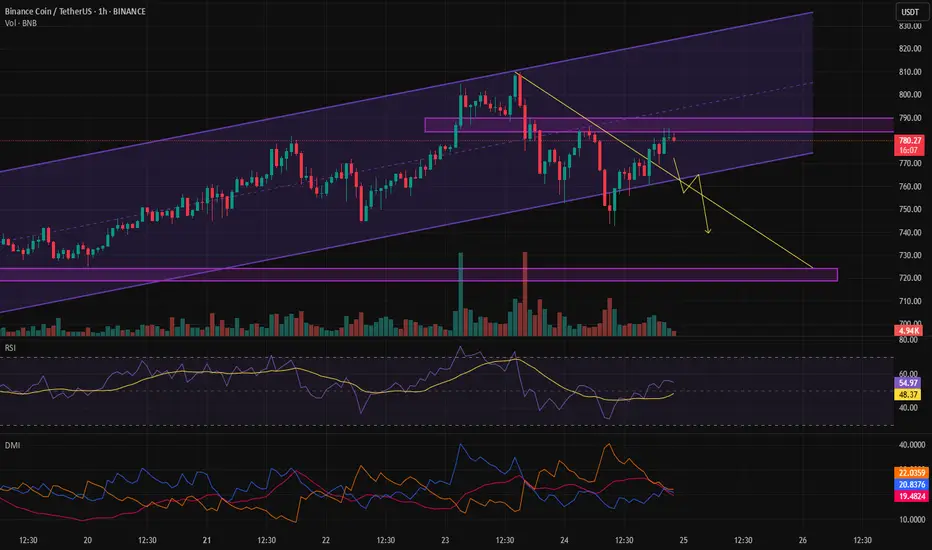
The sell signal is about to be triggered.Considering the weakness in the trend, if the price moves toward the bottom of the channel one more time, there's a possibility of the channel breaking to the downside.
BNB WEEKLYHello friends🙌
🔊We are here with BNB analysis:
A long-term analysis that can be viewed as an investment, but in the long term, with patience and capital management...
You can see that after weeks of price suffering, a good upward move has now been formed by buyers, which has also caused a new ceiling to be set. Considering the market decline and the decline of most currencies, you can see that BNB is well supported and its price has suffered.
⚠Now, with the arrival of buyers, you can enter a long-term buy trade with capital management.
🔥Follow us for more signals🔥
*Trade safely with us*
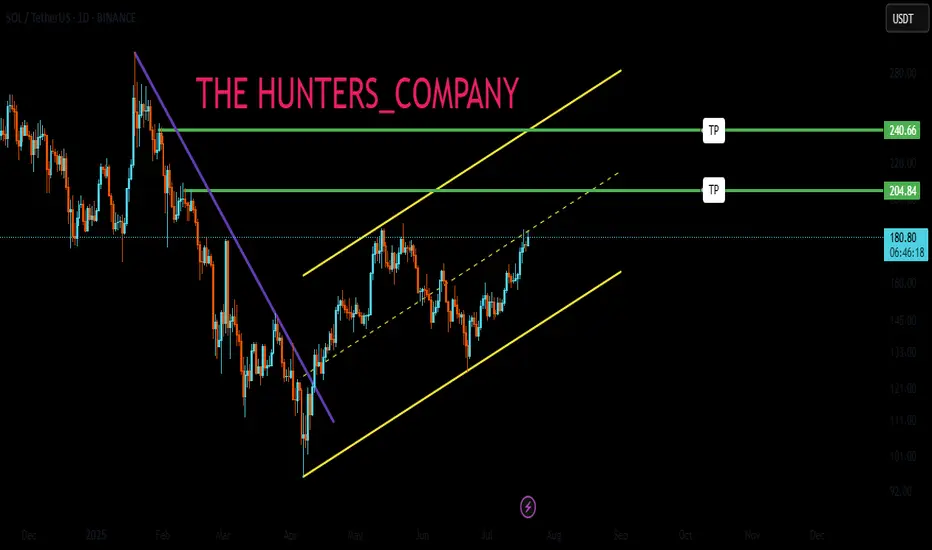
SOLANA UPDATEHello friends🙌
📉Given the decline we had, you can see that buyers came in and supported the price and were able to change the trend and create an ascending channel.
📈Now, considering that the price is hitting higher ceilings and floors, we can expect an ascending wave until the ceiling of the channel.
Don't forget risk and capital management.⚠
🔥Follow us for more signals🔥
*Trade safely with us*
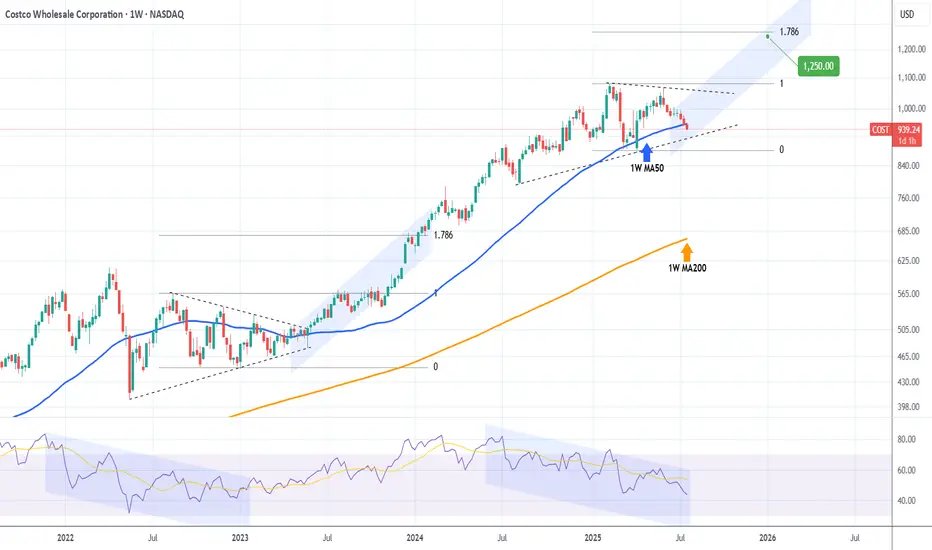
COSTCO Looking for a bottom to fuel rally to $1250.Last time we looked at Costco (COST) was 6 months ago (January 21) when we gave the most optimal buy signal exactly at the bottom of the Channel Up at the time, easily hitting our $1045 Target:
Since then, the stock has entered a new Accumulation Phase in the form of a Triangle and this week broke below its 1W MA50 (blue trend-line), which is where its previous bottom (Higher Low) was formed.
The last similar Triangle pattern was formed straight after the May 16 2022 market bottom and once it broke upwards it led to a massive rally. Even the 1W RSI sequences between the two fractals are similar.
Our Target is $1250, just below the 1.786 Fibonacci extension.
-------------------------------------------------------------------------------
** Please LIKE 👍, FOLLOW ✅, SHARE 🙌 and COMMENT ✍ if you enjoy this idea! Also share your ideas and charts in the comments section below! This is best way to keep it relevant, support us, keep the content here free and allow the idea to reach as many people as possible. **
-------------------------------------------------------------------------------
💸💸💸💸💸💸
👇 👇 👇 👇 👇 👇
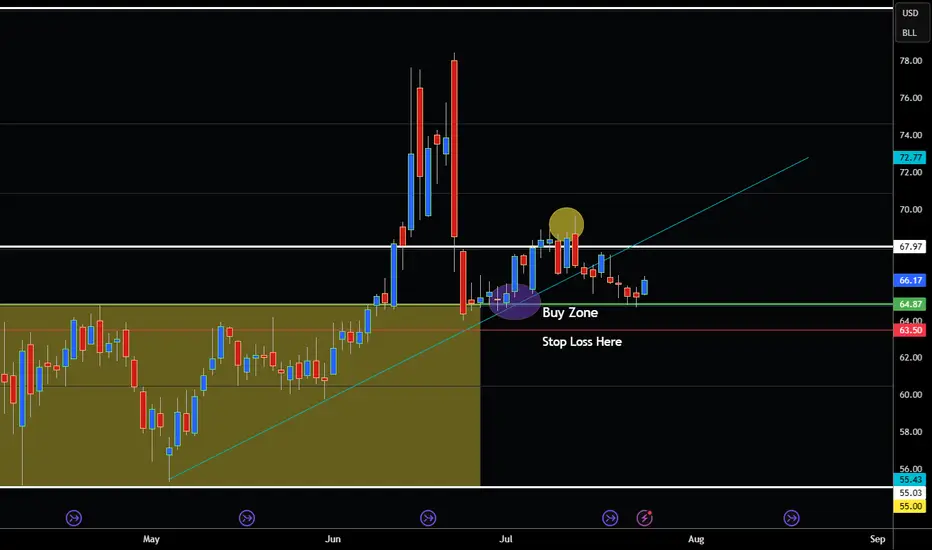
CRUDE OIL PULLS BACK AND RE-ENTERS BUY ZONE!Hey Traders so looking at Crude Oil today still showing signs of strength. I think it's still bullish because Dollar is still showing weakening signs at the moment. Plus a few daily closes above $68.
Also we are still in Summer which is normally a Seasonally Bullish time for Crude and energies. Not to mention still lots of uncertainty as always. 🙄
So I say if your bullish continue to buy in the zone $64.80-$66.00 place stop under support around 63.50 which looks like it could be safe place to not get stopped out.
However if bearish wait for close below 63.50 before selling the rally. Or better wait until September when the Seasonally Weak period begins in energy markets.
Good Luck & Always use Risk Management!
(Just in we are wrong in our analysis most experts recommend never to risk more than 2% of your account equity on any given trade.)
Hope This Helps Your Trading 😃
Clifford
Sell opportunity?If the trendline breaks in the lower timeframe, a short position can be taken down to the bottom of the channel.**
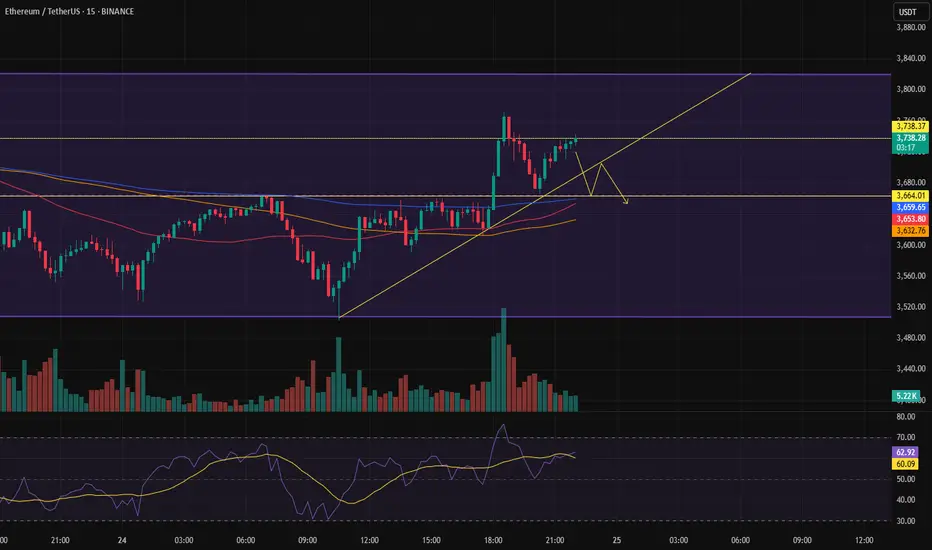
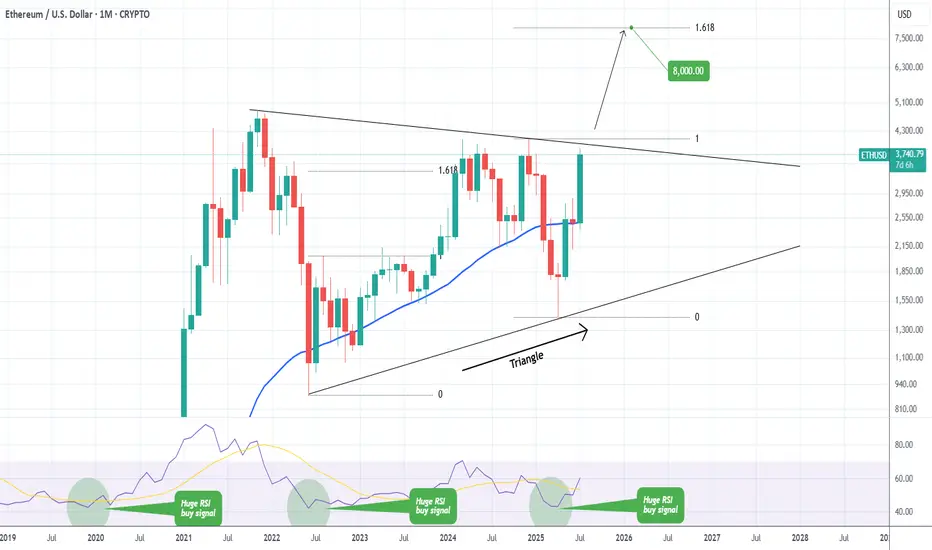
ETHEREUM Massive Triangle break-out ahead??Ethereum (ETHUSD) has been trading within a 4-year Triangle for the entirety of this Cycle. The recent post April rally has been the most aggressive since the parabolic rally that led to the Top of the previous Cycle.
The price is now almost on the top (Lower Highs trend-line) of the Triangle. A break above it, can initiate an aggressive Bullish Leg towards the 1.618 Fibonacci extension ($8000), which was the level that was marginally exceeded during ETH's first rally of this Cycle.
-------------------------------------------------------------------------------
** Please LIKE 👍, FOLLOW ✅, SHARE 🙌 and COMMENT ✍ if you enjoy this idea! Also share your ideas and charts in the comments section below! This is best way to keep it relevant, support us, keep the content here free and allow the idea to reach as many people as possible. **
-------------------------------------------------------------------------------
💸💸💸💸💸💸
👇 👇 👇 👇 👇 👇