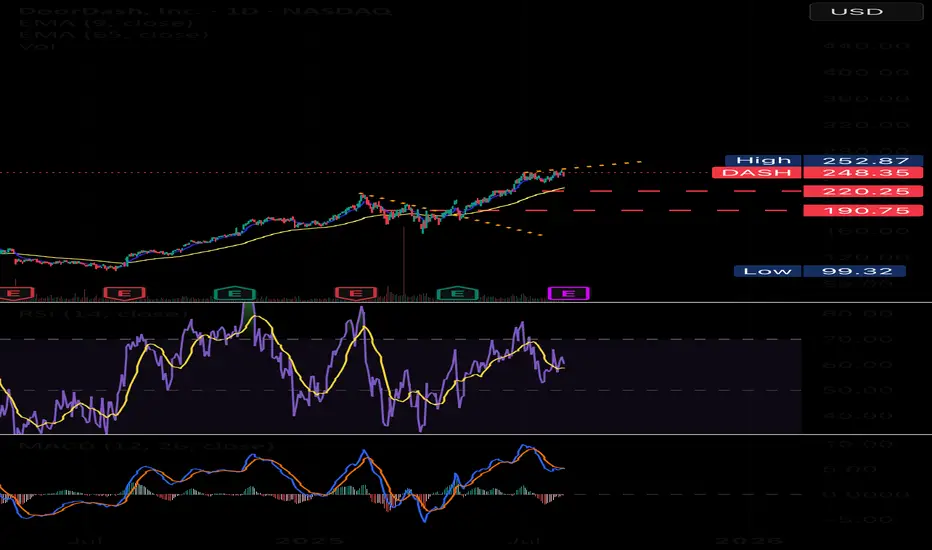
$DASH NASDAQ:DASH buyers look hesitant to buy right now after the weak job report and the Fed signaling no rate cuts anytime soon. This adds pressure on consumer pockets, limiting discretionary spending. If this trend continues, we might see DoorDash consumers slow down their activity, which could impact the company’s revenue growth.
With macro headwinds and reduced consumer demand, NASDAQ:DASH price action could remain under pressure in the short term. A break below key support levels may trigger further downside unless the market sentiment shifts with improved economic data.
Harmonic Patterns
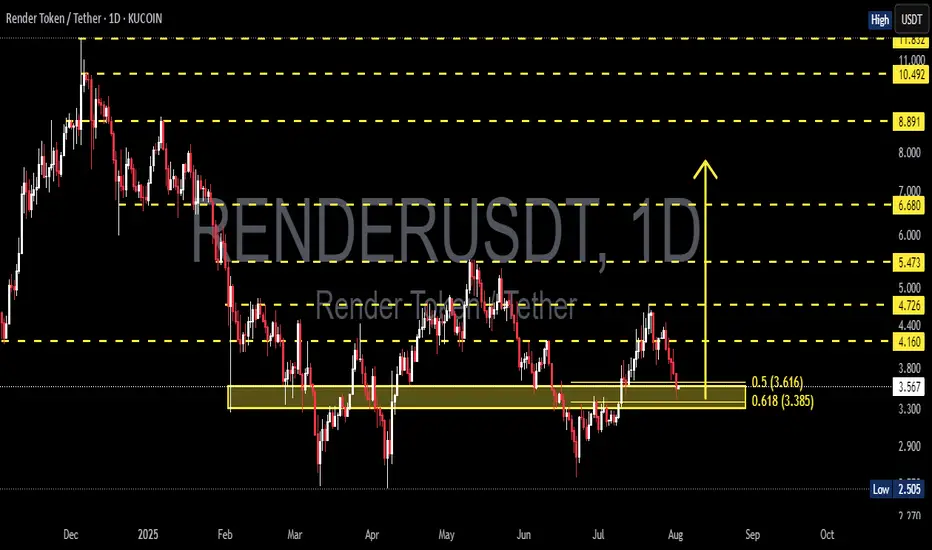
RNDR/USDT at a Critical Turning Point: Golden Pocket as the Key?✨ Overview:
Render Token (RNDR) is currently testing a crucial support zone — the Golden Pocket Fibonacci Retracement between 0.5 (3.616) and 0.618 (3.385). This zone not only represents a significant retracement level but has historically acted as a strong demand area, often serving as a springboard for major price reversals.
---
🧠 Detailed Technical Analysis:
🔸 Support Zone & Golden Pocket
Price has retraced back to the 0.5 – 0.618 Fibonacci zone, a high-probability reversal area.
This zone has acted as a demand base multiple times since February 2025.
How the price reacts here will likely define the next major trend direction.
🔸 Market Structure
The overall structure shows a mid-term downtrend, marked by lower highs and lower lows.
However, the current price action shows slowing bearish momentum, indicating potential hidden accumulation.
A potential double bottom pattern could be forming, hinting at a bullish reversal if confirmed.
---
📈 Bullish Scenario:
1. Strong Rebound from the Golden Pocket
Watch for bullish candlestick patterns (e.g., pin bar, bullish engulfing) near $3.38–$3.61.
Initial resistance levels: $4.16 – $4.72
If broken, mid-term targets could extend to $5.47 – $6.68
2. Double Bottom Confirmation
A confirmed double bottom with a neckline breakout around $4.16 would greatly strengthen bullish momentum.
3. Increased Buying Volume
A spike in volume during the rebound would validate bullish sentiment and potential trend reversal.
---
📉 Bearish Scenario:
1. Breakdown Below the Golden Pocket
If the price breaks below $3.385 with strong volume, we could see a move down toward $2.77, the next significant support.
2. Weak Bounce / Lower High
A failed breakout above $4.16 may indicate a bearish continuation after a temporary relief rally.
---
📌 Summary:
RNDR is currently at a technically sensitive zone. The Golden Pocket between $3.38 and $3.61 is the key area to watch. A strong bullish reaction could signal the start of a trend reversal, while a breakdown could trigger further downside continuation. Traders are advised to wait for clear confirmation via price action before committing to any strong positions.
---
🔖 Key Levels to Watch:
Level Description
3.38 – 3.61 Golden Pocket (Potential Buy Zone)
4.16 Minor Resistance
4.72 Bullish Breakout Trigger
5.47 – 6.68 Mid-Term Reversal Targets
2.77 Strong Support if Breakdown Occurs
---
🧩 Chart Patterns Observed:
Potential Double Bottom – early bullish reversal signal.
Golden Pocket Reaction Setup
Descending Structure – still intact but weakening.
---
🔍 Trade Ideas:
🔄 Wait-and-see approach: Wait for clear bullish confirmation on daily candles.
🎯 Aggressive Long Entry: Around 3.40–3.60 with a tight stop-loss.
⚠️ Short Opportunity: If a strong breakdown below 3.38 occurs with volume confirmation.
#RNDR #RenderToken #RNDRUSDT #CryptoAnalysis #GoldenPocket #FibonacciRetracement #DoubleBottom #PriceAction #SupportResistance #AltcoinSetup #CryptoSignals #TechnicalAnalysis
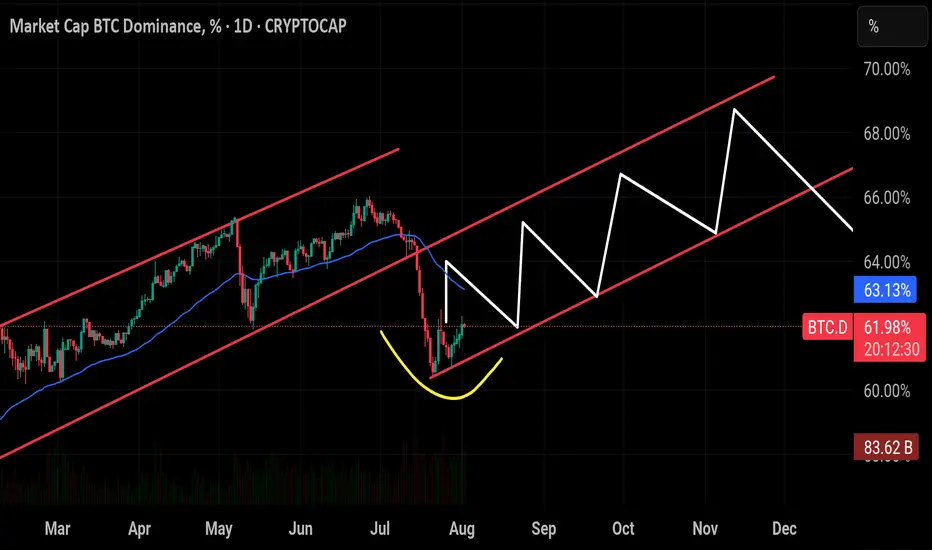
$BTC Dominance seems to be replaying its historical pattern —CRYPTOCAP:BTC Dominance seems to be replaying its historical pattern — after peaking around 66%, it’s now pulling back toward the critical 60% support zone. If the breaks below this level have triggered sharp drops toward 54%, often marking the start of strong altcoin seasons. Unless BTC.D closes back above 65%–66%, history suggests we could see another wave of altcoin outperformance in the weeks ahead. And looking at the chart structure, a breakout in BTC’s price action could align with this cycle, potentially driving Bitcoin toward a new all-time high soon.
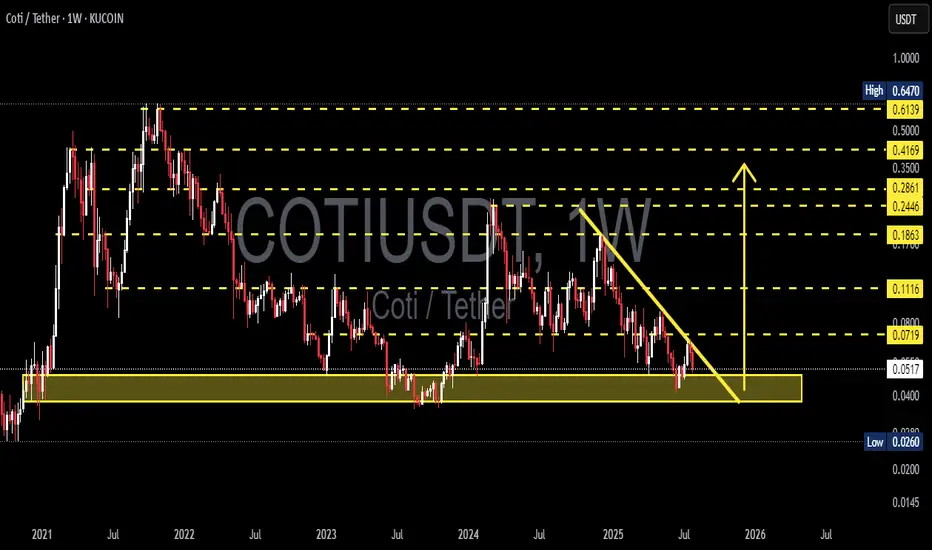
COTIUSDT Weekly Analysis Potential Reversal?📍 Current Price Position – On Top of Historical Support!
The COTI/USDT pair is currently testing a crucial support zone between $0.0400 – $0.0517, which has been a key demand zone since early 2021. This isn't just any support — it's a macro psychological area that has repeatedly triggered strong reversals in the past.
We are at a make-or-break level, where the next move could define the mid-term trend.
---
🧩 Price Structure and Pattern
📐 The chart shows a descending triangle pattern with:
Consistently lower highs (marked by the downward yellow trendline),
Flat horizontal base around the major support zone.
This pattern can result in:
A powerful breakout if the trendline is broken, or
A sharp breakdown if the horizontal support fails.
---
📈 Bullish Scenario: Reversal Momentum Building?
If price:
Breaks above the descending trendline (~$0.0719), and
Closes a weekly candle above that resistance zone,
➡️ We could see a breakout move with targets at:
Resistance Level Target
Initial Target $0.1116
Mid-Term Target $0.1863
Strong Zone $0.2446 – $0.2861
Long-Term Bullish $0.35 – $0.4169
📌 A confirmed higher high and higher low structure above $0.11 would strengthen the bullish case.
---
📉 Bearish Scenario: Breakdown from Support
If:
Price fails to hold the $0.0517 – $0.0400 support area,
and prints a weekly close below this zone,
➡️ The next bearish targets could be:
Support Level Target
First Support $0.0260
Psychological Level $0.0200
Extreme Panic Zone $0.0150 – $0.0100
⚠️ This would indicate a capitulation phase, likely to trigger panic selling and deeper lows.
---
🧠 Strategy Notes for Traders
✅ For Position Traders:
The $0.040 – $0.0517 area is a prime watch zone for reversal setups with tight stop-loss below $0.040.
Excellent Risk:Reward potential if reversal confirms.
✅ For Swing Traders:
Breakout above the trendline offers a solid entry signal.
Targets up to $0.1863 look achievable with strong volume.
✅ For Conservative Traders:
Wait for breakout + retest confirmation before entering.
Avoid FOMO — let the weekly candle close guide your decision.
---
⚡️ Final Takeaway
> COTI/USDT is at a tipping point!
This long-standing support is the last line of defense for the bulls. A breakout can trigger a macro trend reversal, while a breakdown will extend the downtrend and invite heavier selling pressure.
Watch for the weekly close, trendline reaction, and volume behavior — the next major move is likely just around the corner.
#COTI #COTIUSDT #CryptoAnalysis #AltcoinWatch #DescendingTriangle #BreakoutTrading #SupportAndResistance #PriceAction #ChartPattern #WeeklyAnalysis
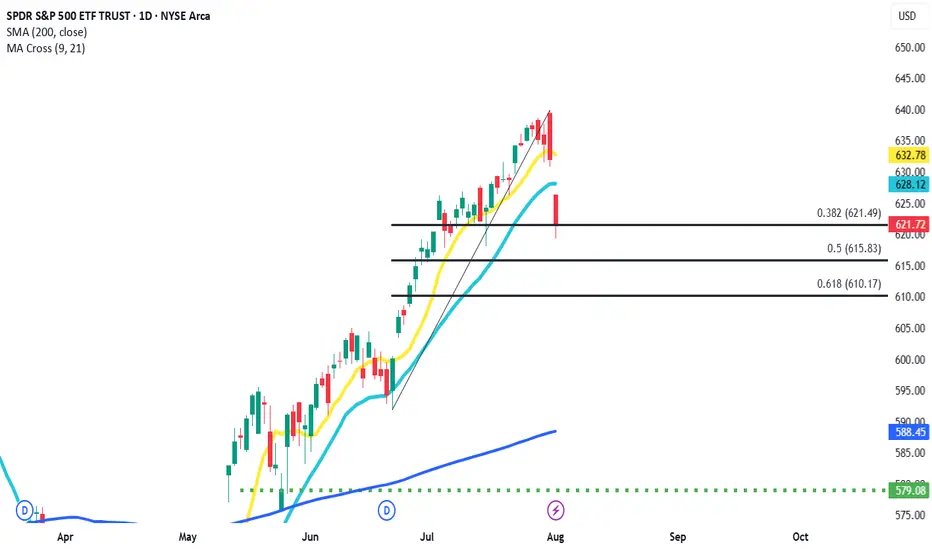
FIBO touch and goPretty violent last couple of days in July, but I honestly think it might be over for now. Price action couldn't break past .38 fibo retracement. If I'm right we could see continuation of uptrend in coming weeks.
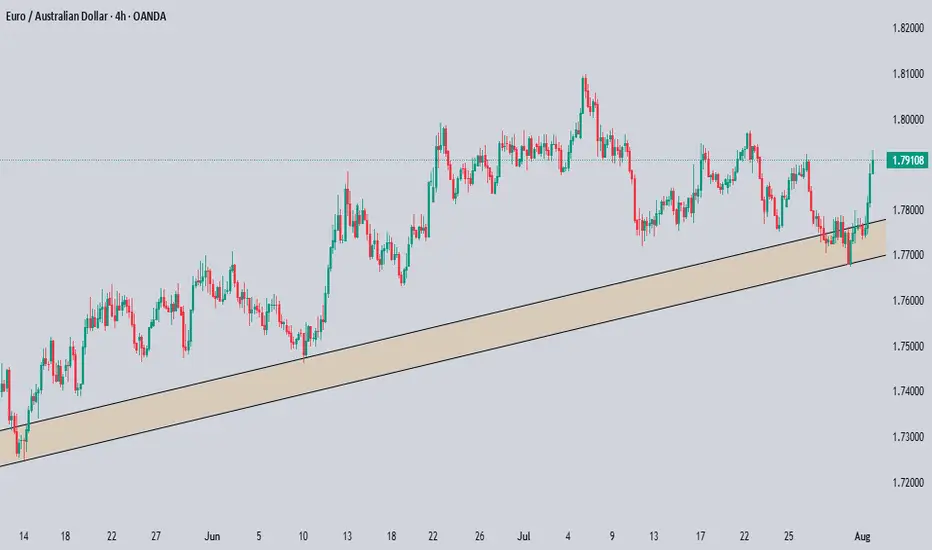
EURAUD BULLISH MOVE CONTINUESOur analysis is based on a multi-timeframe top-down approach and fundamental analysis.
Based on our assessment, the price is expected to return to the monthly level.
DISCLAIMER: This analysis may change at any time without notice and is solely intended to assist traders in making independent investment decisions. Please note that this is a prediction, and I have no obligation to act on it, nor should you.
Please support our analysis with a boost or comment!
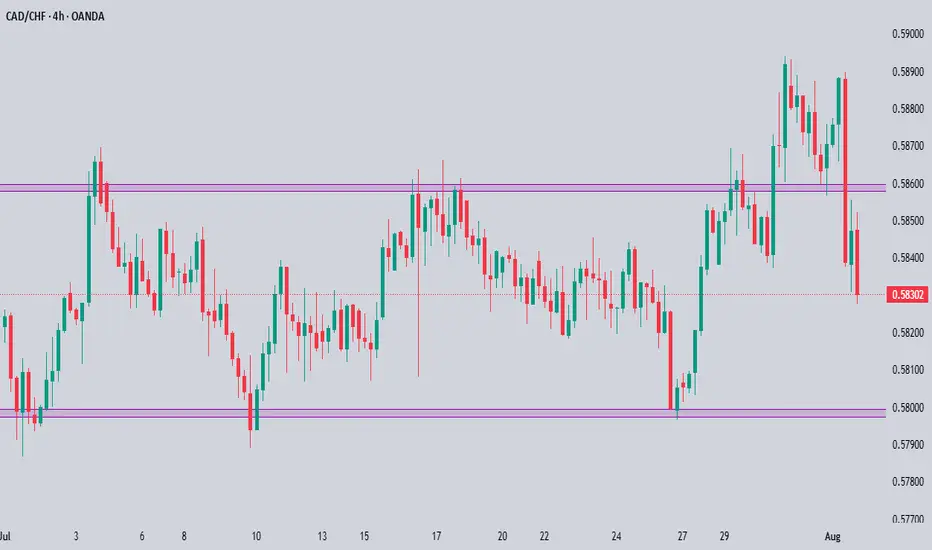
CADCHF Technical & Order Flow AnalysisOur analysis is based on a multi-timeframe top-down approach and fundamental analysis.
Based on our assessment, the price is expected to return to the monthly level.
DISCLAIMER: This analysis may change at any time without notice and is solely intended to assist traders in making independent investment decisions. Please note that this is a prediction, and I have no obligation to act on it, nor should you.
Please support our analysis with a boost or comment!
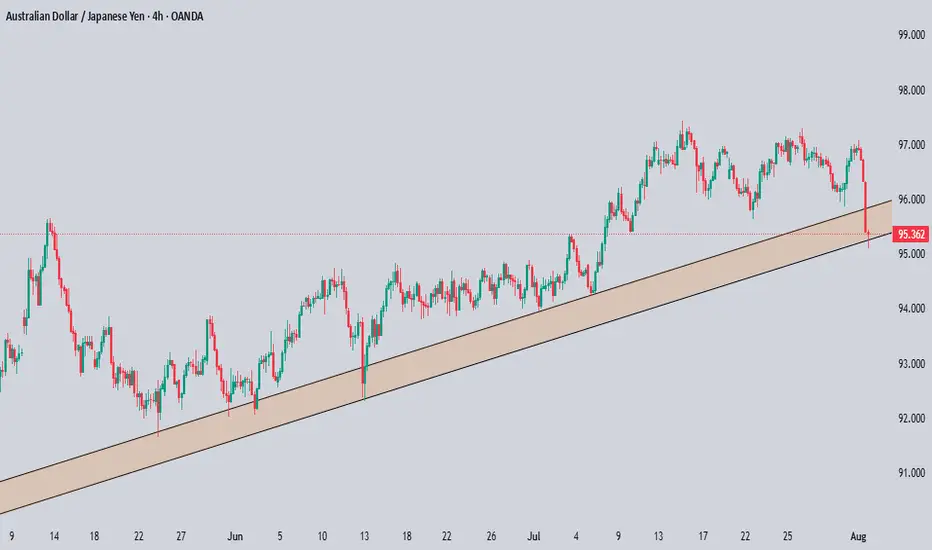
AUDJPY Technical & Order Flow AnalysisOur analysis is based on a multi-timeframe top-down approach and fundamental analysis.
Based on our assessment, the price is expected to return to the monthly level.
DISCLAIMER: This analysis may change at any time without notice and is solely intended to assist traders in making independent investment decisions. Please note that this is a prediction, and I have no obligation to act on it, nor should you.
Please support our analysis with a boost or comment!
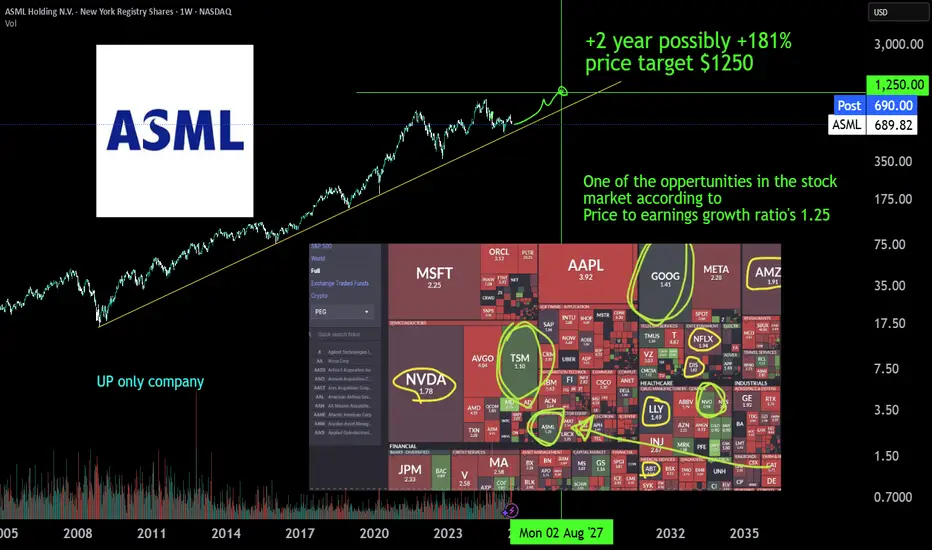
ASML monopolist, AI expanding +181% | 2Y oppertunity ASML is the monopoly Extreme ultra violet machinery company. There is no one close to it's technology or there is no one investing enough to R&D a thing like it. The whole AI datacenter and cloud chip growth depends on EUV machinery of ASML developed in 2013 (>10y of PhD level R&D deveopment). The first new High-NA EUV systems have been deployed at Intel in July 2025 for research purposes and will scale just like the EUV already does to keep pace with moore's law. TSMC has stated it will not yet depoly the machines but has to expand with to 10 year older tech EUV machines just to get the AI chip demand going. AI chip demand at NVIDIA is growing harder than expected comfirmed by latest earnigns of alphabet, microsoft, meta and amazon.
Also don't sleep on BESI a packing machinery wonder due to hydrid bonding technology, which makes 3D chip staking possible.
#GoHighTechNetherlands
Daily Orderflow on ES and NQ. 01.08.2025, NFP FridayCME_MINI:NQ1! CME_MINI:ES1!
Orderflow explanation. Sessional delivery and New York Price action

Reversal from Channel Bottom or a Real Breakdown? Identifying th
🎯 BTCUSDT - Analysis
🔹 Analysis Date: 1 August 2025
📉BTCUSDT:
Price is currently moving inside an ascending channel and has touched the bottom of the channel again, offering a potential buy opportunity.
However, for those seeking a low-risk entry, the zone around 118,000 could be ideal—if price returns to the channel and confirms support.
Although it seems the channel’s lower boundary might break, this could be a fake break to mislead traders before a rebound.
The support at 110,000 is a crucial short-term level; if it fails, a deeper correction toward 98,090 or even 94,000 is likely.
Our targets remain at the upper boundary of the channel.
⚠️ Risk Management Tip: Wait for confirmation near 118,000 if unsure, and always size positions based on overall volatility.

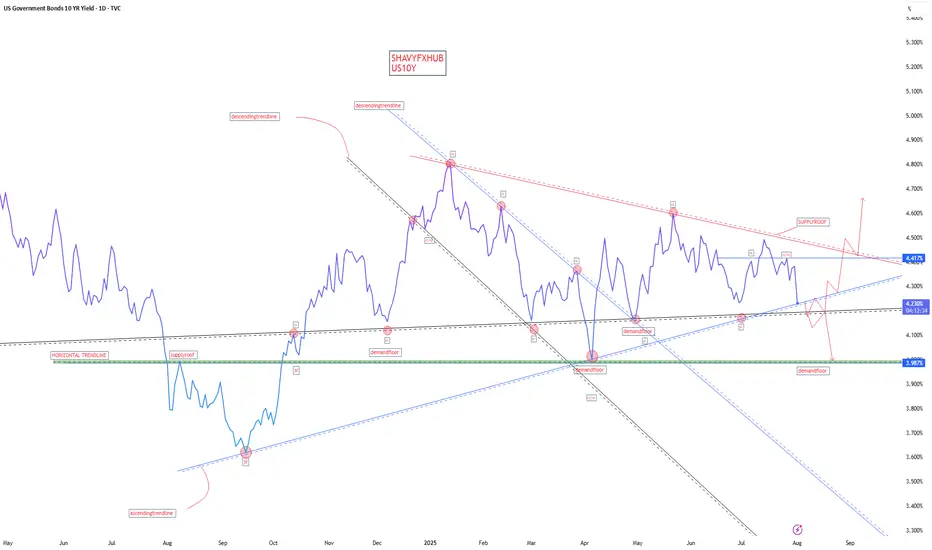
US10Y1. Labor Market Data
Average Hourly Earnings m/m:
Actual: 0.3%
Forecast: 0.3%
Previous: 0.2%
Interpretation: In-line with forecast and slightly above the prior period, indicating stable wage growth. This suggests inflationary pressures from labor costs remain steady, not accelerating unexpectedly.
Non-Farm Employment Change:
Actual: 73,000
Forecast: 106,000
Previous: 14,000
Interpretation: A clear downside surprise; job gains are well below expectations, and while up from a low previous period, this points to softening labor demand—an early sign of slack in the job market.
Unemployment Rate:
Actual: 4.2%
Forecast: 4.2%
Previous: 4.1%
Interpretation: Matches the forecast but marks a slight uptick, reinforcing mild labor market weakness.
Fed View: The Fed will interpret softer than expected job growth and a higher unemployment rate as evidence of easing labor market pressures—a dovish signal that could support future policy easing if the trend continues.
2. Manufacturing and Industry
Final Manufacturing PMI (S&P Global):
Actual: 49.8
Forecast: 49.7
Previous: 49.5
Interpretation: Slightly above forecast but still below the 50 threshold, indicating contraction persists but is less severe.
ISM Manufacturing PMI:
Actual: 48.0
Forecast: 49.5
Previous: 49.0
Interpretation: Below both forecast and prior; contraction in the manufacturing sector is deepening.
ISM Manufacturing Prices:
Actual: 64.8
Forecast: 69.9
Previous: 69.7
Interpretation: Lower than both forecast and previous, signaling input price pressures are easing—positive for the Fed’s inflation outlook.
Fed View: Ongoing contraction in manufacturing and lower input prices support the argument that inflation risks are cooling from the supply side, allowing for a more dovish stance.
3. Consumer and Construction
Revised UoM Consumer Sentiment:
Actual: 61.7
Forecast: 62.0
Previous: 61.8
Interpretation: Slightly below forecast, little change—consumer confidence remains relatively subdued.
Construction Spending m/m:
Actual: -0.4%
Forecast: 0.0%
Previous: -0.4%
Interpretation: Same as previous, misses forecast—ongoing weakness in construction and real estate investment.
Fed View: Weak consumer sentiment and persistent soft construction data reinforce slower demand-side dynamics, an argument in favor of pausing or even cutting rates.
4. Inflation Expectations
Revised UoM Inflation Expectations:
Actual: 4.5%
Forecast: Not directly listed (prior 4.4%)
Interpretation: Ticks up slightly, indicating that consumers expect inflation to remain higher. This could temper the Fed’s willingness to cut rates too soon—if expectations become unanchored, the Fed may have to stay hawkish.
Overall Fed Interpretation
Labor market: Softer than forecast, unemployment up—dovish for rates.
Manufacturing/industry: Slight improvement in PMI, but ISM shows contraction; input prices are easing—dovish.
Consumer/construction: Little improvement, still weak—dovish.
Inflation expectations: Up slightly—potential hawkish caution.
Net result: The data is mostly dovish—except for the higher inflation expectation which remains a concern. The Fed will likely see this data as supporting a “watchful pause” and adopt a more flexible stance: no immediate rate cut, but the case for easing is growing unless inflation expectations keep drifting higher. Sustained weak jobs or further easing in prices would increase the chances of a rate cut in coming months. Elevated inflation expectations will keep the Fed cautious about acting too quickly.
#DOLLAR #US10Y #STOCKS #BONDS #YIELD
xauusd sellsell xauusd
XAUUSD
idea order block active with high volume here
and it back to test it
OANDA:XAUUSD
BTC CLS RANGEWaiting for the daily candle to close inside of the range as seen on the graph with the horizontal line.
Then I will be immediatly looking for an entry, either a FVG or a OB or an IFVG. (I will update the entry points asap)
Then I will target 50% of the range as seen on the graph market 0 .5 on the fibonacci retracement where I will take 75% of the position.
Then I will set my SL at my entry price and target the opposing range or LQ which is at 119500-120000K

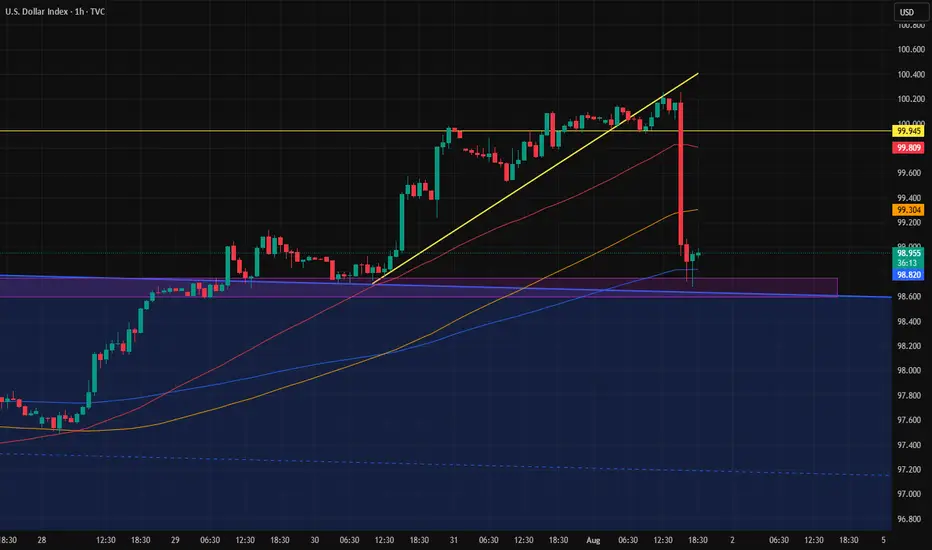
The strength of the PMI reportWe all saw how a large and strong candle formed right after the news, hitting the top of the previous channel.
So now that channel top zone has proven to be valid.
Now we have to see whether this candle leads to another drop in the dollar, or if the dollar recovers and slowly starts moving back toward 100.
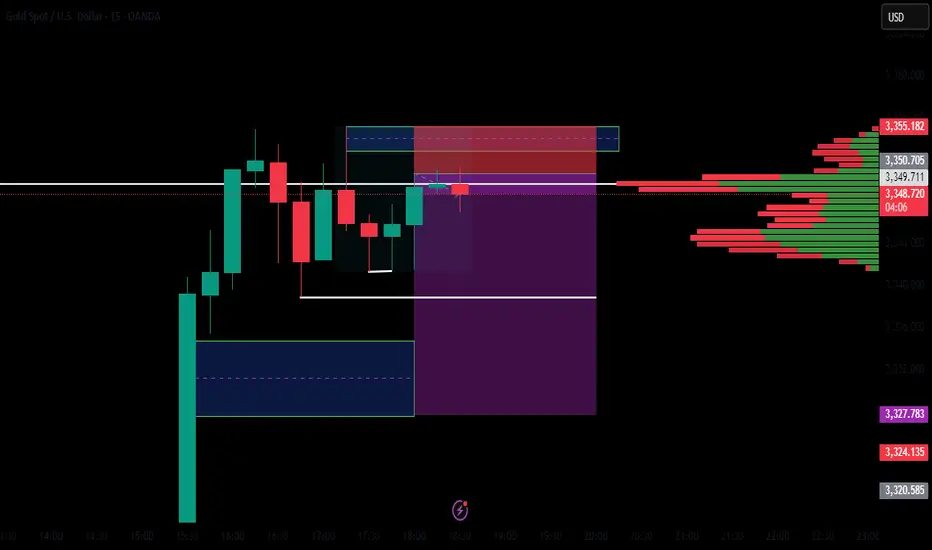
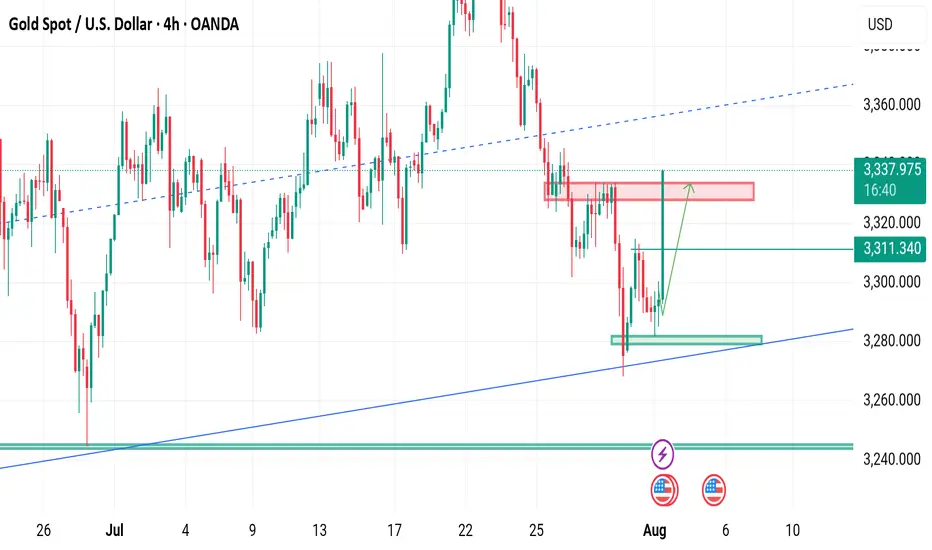
XAUUSD
XAUUSD Updated in 30M :
The gold signal is marked on the chart based on the latest price changes and the supply and demand in the market. These points include the entry point, stop loss, and take profit.

Closing all my orders in profits I mentioned throughout Today's commentary session:
My strategy is still the same – i took buy from 3290-3294
Very happy with the profits so far.
My medium-term targets remain 3335-3345 which is achieved 300 pips achieved alhumdullilah.
All I say thanks to those who followed us and made profits.
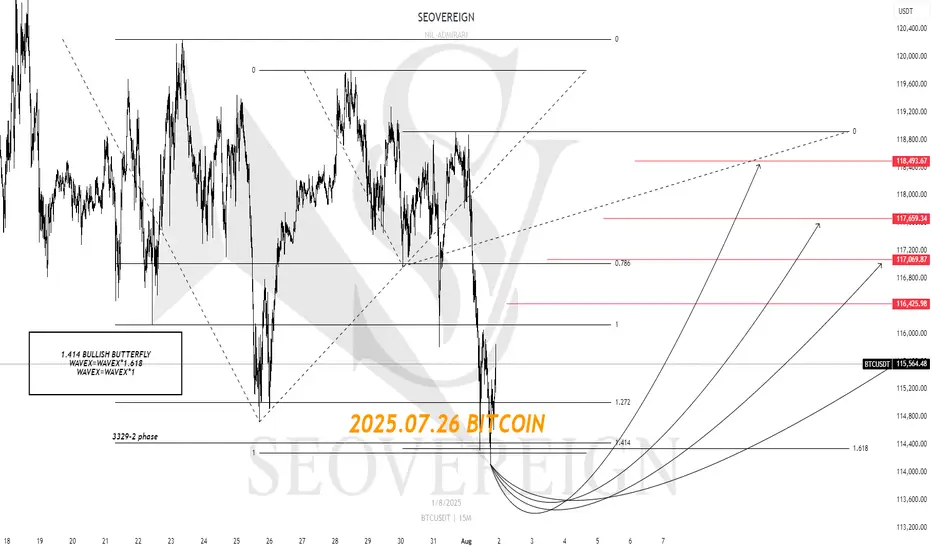
[SeoVereign] BITCOIN BULLISH Outlook – August 1, 2025We are the SeoVereign Trading Team.
With sharp insight and precise analysis, we regularly share trading ideas on Bitcoin and other major assets—always guided by structure, sentiment, and momentum.
🔔 Follow us to never miss a market update.
🚀 Boosts provide strong motivation and drive to the SeoVereign team.
--------------------------------------------------------------------------------------------------------
Hello.
This is SeoVereign.
My fundamental view on Bitcoin, as mentioned in the previous idea, is that I am anticipating an overall downward trend. In the mid- to long-term, I believe the downward pressure will gradually increase, and this is partially confirmed by various indicators and the overall market sentiment.
However, before we fully enter this downward phase, I have been judging that one more upward wave is likely to remain. I have focused my strategy on capturing this upward segment, and I have recently reached a point where I can specifically predict the development of that particular wave.
If this upward move unfolds successfully, I plan to set my take-profit range conservatively. The reason is simple: I still believe there is a high possibility that the market will shift back into a downtrend afterward. The core of this strategy is to minimize risk while realizing profits as efficiently as possible toward the tail end of the wave.
The relevant pattern and structure have been marked in detail on the chart, so please refer to it for a clearer understanding.
In summary, I view this rise as a limited rebound that could represent the last opportunity before a downturn, and I believe this idea marks the beginning of that move.
I will continue to monitor the movement and update this idea with additional evidence. Thank you.
BULLISH THEN BEARISH AFTER HITTING PRZExpecting the news momentum for NFP to push the market into PRZ before a sudden fall into 38.2 and 61.8 fib levels

DOLLAR INDEXDepartments Responsible for Each Economic Report
Indicator Responsible Department/Source
Average Hourly Earnings m/m U.S. Bureau of Labor Statistics (BLS), part of the Department of Labor
Non-Farm Employment Change BLS (Establishment Survey)
Unemployment Rate BLS (Household Survey)
Final Manufacturing PMI S&P Global/Markit (private company)
ISM Manufacturing PMI Institute for Supply Management (ISM, private sector)
ISM Manufacturing Prices Institute for Supply Management (ISM)
Revised University of Michigan (UoM) Consumer Sentiment University of Michigan (private/public university)
Construction Spending m/m U.S. Census Bureau, Department of Commerce
Revised UoM Inflation Expectations University of Michigan
How the Federal Reserve Interprets “Greater Than” or “Lower Than” Forecast
1. Average Hourly Earnings,
2.Non-Farm Payrolls,
3. Unemployment Rate
Higher than forecast (stronger labor market):
Tight labor markets (higher wages, more jobs, lower unemployment) suggest inflationary pressure.
The Fed may view this as a signal to keep rates higher for longer, as wage and job growth could fuel inflation.
Lower than forecast (weaker labor market):
Signals cooling in employment and wage growth, reducing upward pressure on inflation.
The Fed may see this as justification to consider easing policy or at least pausing further rate hikes.
2. Manufacturing PMIs (ISM, S&P)
Above 50: Signals expansion in manufacturing; below 50 indicates contraction.
Higher than forecast: Points to stronger economic momentum; the Fed may see upside risks to inflation.
Lower than forecast: Indicates weaker manufacturing activity; a possible sign of slowing demand, which could support rate cuts or dovish policy if persistent.
3. ISM Manufacturing Prices
Higher than forecast: Suggests inflationary pressures in manufacturing input costs; Fed interprets this as a reason for vigilance on inflation.
Lower than forecast: Implies easing input price pressures, supporting a dovish outlook if inflation remains subdued.
4. University of Michigan Consumer Sentiment & Inflation Expectations
Stronger than forecast sentiment: Consumers are more optimistic, often a sign of solid spending potential. May amplify inflation if this leads to greater demand.
Higher inflation expectations: If consumers expect higher future inflation, this can become self-fulfilling and the Fed may maintain tighter policy.
Weaker sentiment/lower inflation expectations: Reduces inflation risk, gives the Fed more flexibility to ease if needed.
5. Construction Spending
Higher than forecast: Indicates resilient investment and demand in the real economy.
Lower than forecast: Suggests cooling real estate and infrastructure spending; may support a dovish Fed outlook if sustained.
Summary Table
Data Surprises Interpretation for Fed Policy
Higher-than-forecast More hawkish; raises risk of persistent inflation
Lower-than-forecast More dovish; reduces pressure to hold rates higher
The Fed looks at the overall pattern across these data. Persistent upside surprises heighten concerns about inflation, supporting tighter policy. Downside surprises suggest cooling economic momentum and may encourage future rate cuts or pauses. The relative impact depends on which indicators surprise and the broader economic context.
#DXY #DOLLAR

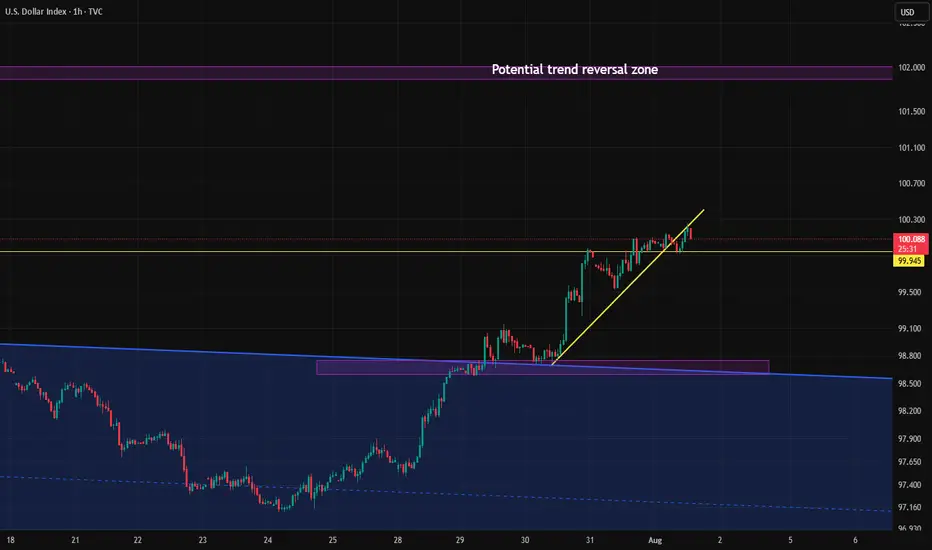
Candle close above 100 after 2 months.If the Dollar Index manages to close above the 100 level today, following the important news release, there's a chance the upward move could continue toward the key 101 zone next week.
However, unless it breaks above the 101 level with strong momentum, the overall trend in the higher timeframes still remains bearish.
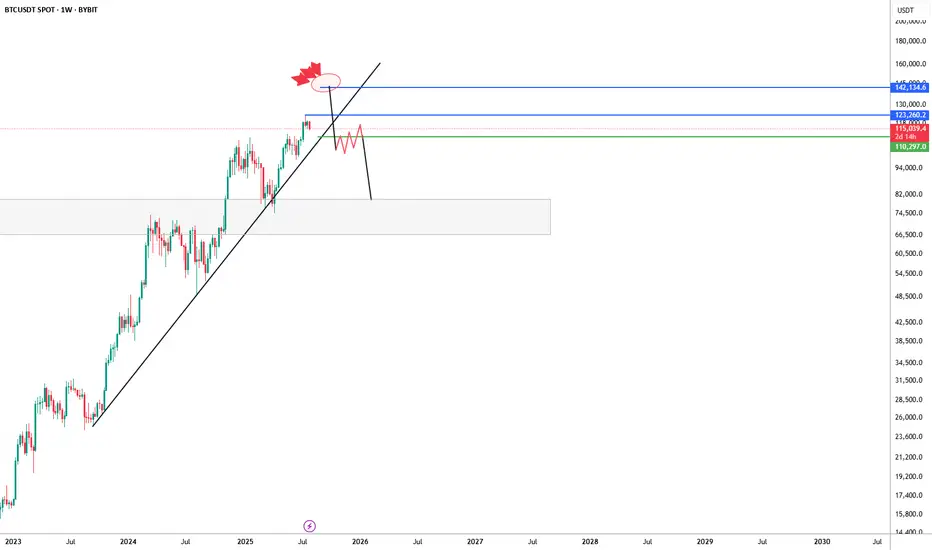
BTC/USDT Weekly – Bearish Rejection Brewing?Bitcoin has been riding a strong uptrend supported by a long-term ascending trendline, but recent price action is showing signs of exhaustion near the $123K–$142K supply zone.
The chart suggests a potential deviation above resistance, marked by a fakeout wick and aggressive rejection (highlighted with red blast icon). If price fails to reclaim and hold above $123K, the structure risks breaking down below trendline support — opening the door to a larger correction.
🔹 Key Resistance Zone: $123,260–$142,134
🔹 Critical Trendline Support: Recently broken — watch for retest/failure
🔹 Bearish Confirmation: Clean break & lower high formation under $109K
🔹 Next Major Demand Zone: $75K–$85K region
This setup leans bearish unless bulls can reclaim the upper blue range and re-establish control. If not, we could be looking at a significant macro retest of previous breakout levels.
#Bitcoin #BTC #BTCUSDT #CryptoChart #TrendReversal #BearishScenario