Smart Liquidity in TradingIntroduction: What Is Smart Liquidity in Trading?
Liquidity is the backbone of financial markets—it refers to how easily assets can be bought or sold without causing drastic price changes. But as markets have evolved with the rise of algorithmic trading, decentralized finance (DeFi), and AI, a more sophisticated concept has emerged: Smart Liquidity.
Smart Liquidity isn’t just about having buyers and sellers in a market. It’s about efficient, dynamic, and intelligent liquidity—where technology, data, and algorithms converge to improve how trades are executed, how markets function, and how risks are managed. Whether in traditional stock markets, forex, or blockchain-based platforms, smart liquidity is now central to modern trading strategies.
Chapter 1: Understanding Traditional Liquidity
Before diving into smart liquidity, let's revisit the basics of traditional liquidity:
Bid-Ask Spread: A narrow spread indicates high liquidity; a wide one shows low liquidity.
Market Depth: The volume of orders at different price levels.
Turnover Volume: How frequently assets are traded.
Price Impact: How much a large order moves the price.
In traditional finance, liquidity providers (LPs) include:
Market makers
Banks and financial institutions
High-frequency trading firms
Exchanges
Liquidity ensures:
Stable pricing
Smooth trade execution
Lower transaction costs
Chapter 2: The Evolution Toward Smart Liquidity
What Changed?
Algorithmic Trading: Algorithms can detect, provide, or withdraw liquidity in milliseconds.
Decentralized Finance (DeFi): Smart contracts offer on-chain liquidity pools without intermediaries.
AI & Machine Learning: Predictive models can identify where liquidity is needed or likely to shift.
Smart Order Routing (SOR): Optimizes trade execution by splitting orders across multiple venues.
These technologies gave rise to “smart liquidity,” where liquidity is not static but adaptive, context-aware, and real-time optimized.
Chapter 3: Components of Smart Liquidity
1. Liquidity Intelligence
Advanced analytics track:
Market depth across exchanges
Order flow trends
Latency and slippage statistics
Arbitrage opportunities
This helps institutions dynamically manage their liquidity strategies.
2. Smart Order Routing (SOR)
SOR systems:
Automatically split large orders across venues
Route based on fees, liquidity, latency, and execution quality
Reduce market impact and slippage
SOR is key in both equity and crypto markets.
3. Algorithmic Liquidity Providers
Market-making bots adjust quotes in real-time based on:
Volatility
News sentiment
Volume spikes
Risk exposure
They enhance liquidity without manual intervention.
4. Automated Market Makers (AMMs)
Used in DeFi:
No traditional order book
Prices determined algorithmically via a liquidity pool
Traders interact with pools, not people
Popular AMMs: Uniswap, Curve, Balancer.
Chapter 4: Use Cases of Smart Liquidity
1. HFT Firms and Institutions
Use predictive liquidity models
Deploy SOR to reduce costs and slippage
Balance exposure across markets
2. Retail Traders
Benefit from tighter spreads and faster execution
Use platforms with AI-driven order matching
3. Decentralized Finance (DeFi)
Anyone can provide liquidity and earn fees
Smart liquidity enables 24/7 trading with no intermediaries
New protocols optimize capital allocation via auto-rebalancing
4. Stablecoin & Forex Markets
Smart liquidity ensures 1:1 peg stability
Algorithms prevent arbitrage imbalances
Chapter 5: Key Metrics to Measure Smart Liquidity
Metric Description
Slippage Difference between expected and actual execution price
Spread Efficiency How close bid-ask spreads are to theoretical minimum
Fill Rate How much of an order is filled without delay or rerouting
Market Impact Price movement caused by a trade
Liquidity Utilization How efficiently capital is allocated across pairs/assets
Latency Time taken from order input to execution
These metrics help evaluate the quality of liquidity provided.
Chapter 6: Risks and Challenges of Smart Liquidity
Despite its benefits, smart liquidity isn’t perfect.
1. Flash Crashes
Caused by sudden withdrawal of liquidity bots
Example: 2010 Flash Crash in U.S. equities
2. Manipulation Risks
Predatory algorithms can spoof or bait other traders
"Liquidity mirages" trick algorithms
3. Smart Contract Failures (DeFi)
Vulnerabilities in AMMs can drain entire liquidity pools
Hacks like those on Curve and Poly Network show smart liquidity can be fragile
4. Impermanent Loss (DeFi)
LPs may lose value if asset prices diverge significantly
Complex math and simulations needed to manage it
5. Regulatory Uncertainty
Especially in crypto, regulators still debating on decentralized liquidity protocols
Conclusion
Smart liquidity represents the next evolution of market infrastructure. It's not just about having capital in the market—it's about how that capital moves, adapts, and executes.
From hedge funds deploying intelligent routing systems to DeFi users earning yields through AMMs, smart liquidity touches every corner of modern finance. As technology continues to mature, expect liquidity to become even more predictive, responsive, and intelligent—unlocking a new level of speed, precision, and access for traders around the world.
Harmonic Patterns
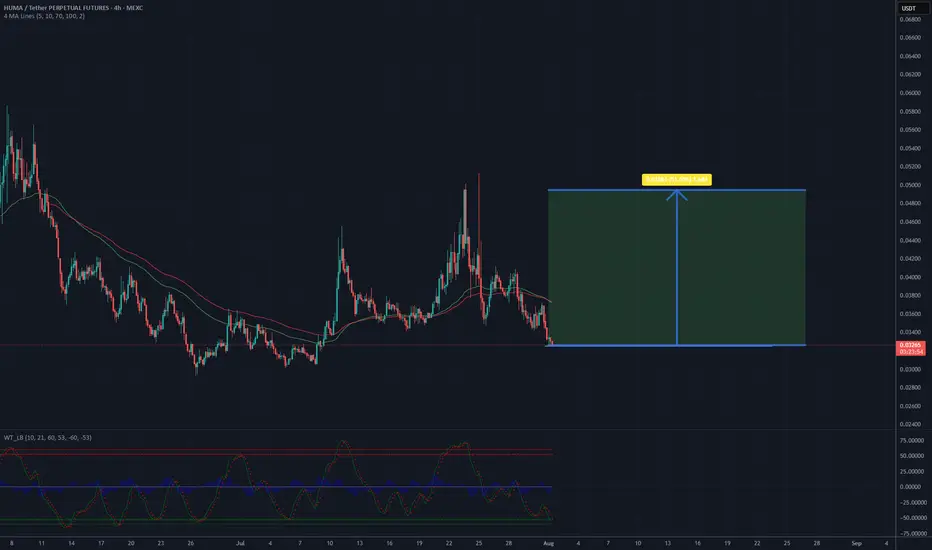
Is it a time fore HUMA? 50% profit - 0.05 USD TargetThe analysis of the HUMAUSDT chart on Binance highlights several key points. The current price is around 0.032764 USD, close to a local low. A clear downtrend is visible since the July peak, but recent days suggest a potential rebound, which could mark the start of an upward movement.
A suggested rise to 0.05 USD (approximately 52% from the current level) is feasible if the price breaks through the resistance around 0.037 USD and stays above the moving average (e.g., 50-day, as shown on the chart). The increase could be supported by rising volume and positive oscillator signals (e.g., RSI above 30, indicating an exit from oversold conditions). A key support level is at 0.03 USD – a drop below this could invalidate the bullish scenario.
I recommend monitoring the breakout above resistance and confirming the trend. For more detailed data, I can perform a DeepSearch to check current market sentiment.
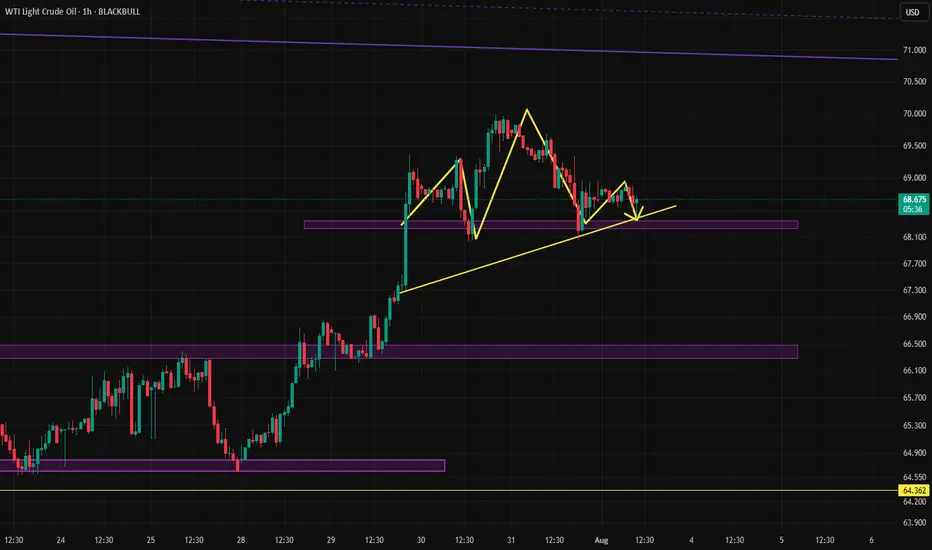
Activation of the head and shoulders pattern?Oil has formed a clean head and shoulders pattern, which, if activated, could lead the price to drop to 67.125. However, if the pattern fails and turns out to be a fakeout, we can expect the price to rise toward the \$71 area.
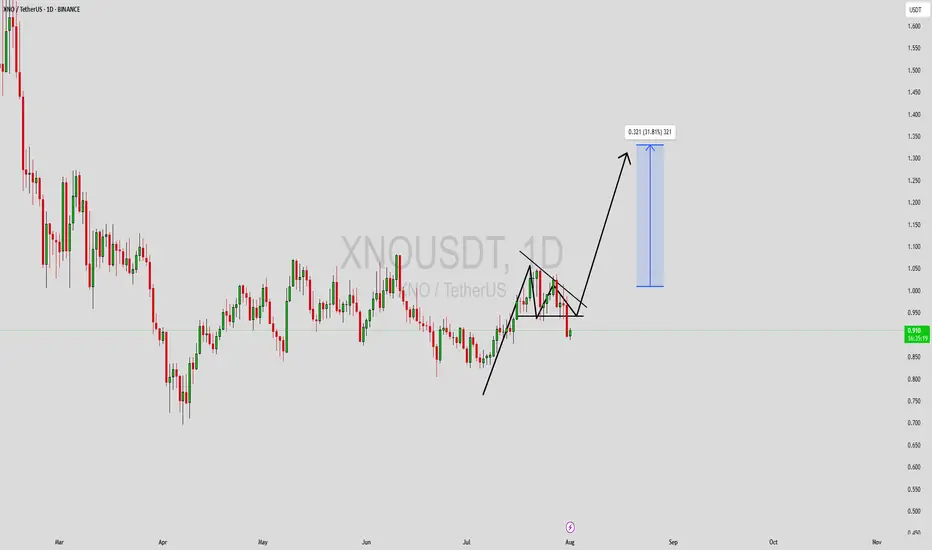
XNOUSDT Forming Bullish PennantXNOUSDT is currently displaying a bullish pennant pattern on the charts, which typically signals a continuation of the prior upward trend after a brief consolidation. This formation is marked by converging trendlines and reduced volatility, often setting the stage for a sharp breakout to the upside. With bullish momentum already in place, traders are closely monitoring this setup for confirmation of the next leg up.
The trading volume remains supportive, maintaining a steady flow that could power a breakout beyond the pennant resistance line. A breakout with a strong volume spike would indicate renewed buying pressure, which could push prices up by 20% to 30% or more. This makes XNO an attractive short-term opportunity for technical traders looking to capitalize on momentum-driven setups.
Investor interest around XNO has been gaining traction, especially as smaller altcoins with solid patterns begin to outperform during market recoveries. The bullish pennant adds to the credibility of this setup, especially in combination with favorable sentiment and increased watchlist mentions across trading communities.
Given the structure and volume dynamics in play, XNOUSDT is positioned for a potential bullish surge if key resistance levels are breached. This pattern, combined with current market conditions, could offer a favorable risk-reward ratio for traders watching for breakout confirmation.
✅ Show your support by hitting the like button and
✅ Leaving a comment below! (What is You opinion about this Coin)
Your feedback and engagement keep me inspired to share more insightful market analysis with you!
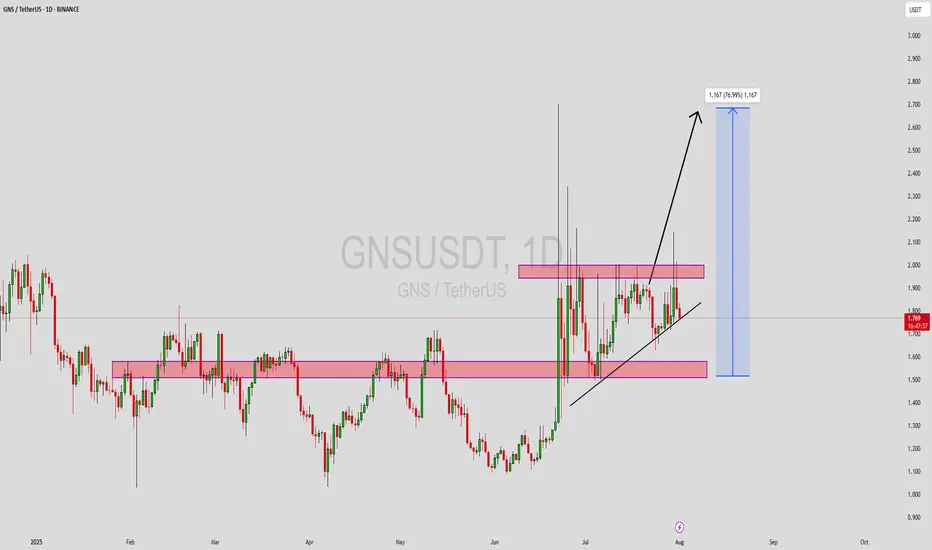
GNSUSDT Forming Bullish ContinuationGNSUSDT is exhibiting a bullish continuation pattern, suggesting that the existing uptrend is poised to extend further. This technical formation often signals market strength and the likelihood of higher highs after a brief consolidation phase. With current price action forming higher lows and tightening within a structure that favors breakout potential, traders are closely watching for a decisive move upward.
The trading volume remains consistently strong, a key confirmation that the breakout, once it occurs, could be supported by sustained market interest. GNS has also demonstrated resilience against broader market fluctuations, which speaks to underlying investor confidence. As long as price remains above the identified support levels and continues to respect trendline structures, a move toward the 60% to 70% gain target appears realistic in the coming weeks.
Investor sentiment around GNS is increasingly positive, with growing social media chatter and technical analysts pointing out the potential for mid-cap altcoins to outperform. The bullish continuation pattern only adds weight to this optimism, particularly if upcoming candles close above the breakout zone on strong volume. This scenario often acts as a catalyst for rapid price movement.
With its solid fundamentals, strong volume profile, and a favorable chart structure, GNSUSDT is well-positioned for bullish continuation. Traders looking for trending assets with potential for solid upside returns should keep this crypto pair on their radar.
✅ Show your support by hitting the like button and
✅ Leaving a comment below! (What is You opinion about this Coin)
Your feedback and engagement keep me inspired to share more insightful market analysis with you!
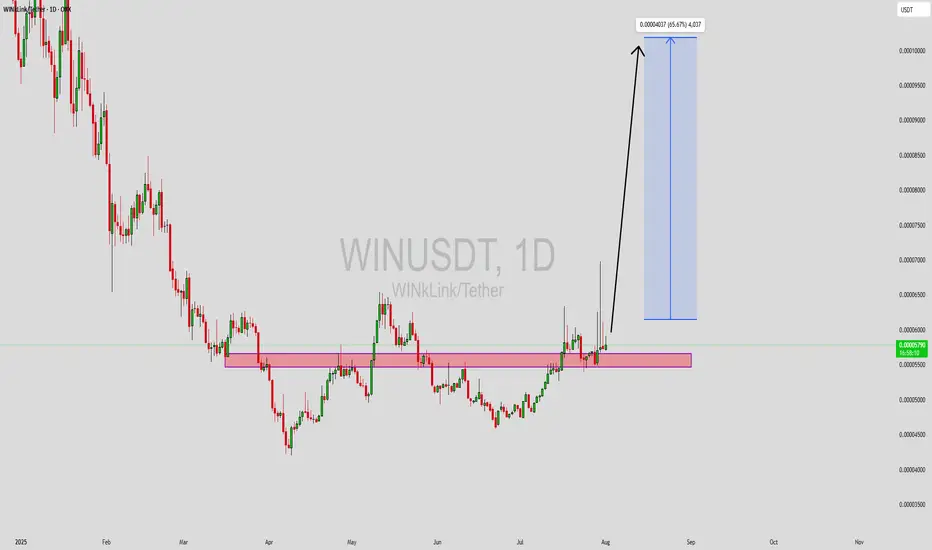
WINUSDT Forming Bullish ReversalWINUSDT is currently showcasing a classic bullish reversal pattern, indicating a potential shift from its recent downtrend toward an upward trajectory. This pattern is typically observed at market bottoms and often serves as a signal for a strong rebound. With solid volume support accompanying the recent candles, market participation is increasing—suggesting that smart money may be accumulating positions ahead of a major breakout.
Technically, WIN has tested and respected key support zones multiple times, strengthening the validity of this reversal formation. The price structure suggests growing momentum, and if it breaks above its immediate resistance level with a confirmed candle close, it could trigger a new bullish wave. Based on the pattern's breakout potential and measured move targets, a 50% to 60% price gain is reasonably anticipated in the short to mid-term.
Moreover, WIN is gaining attention across trading forums and crypto communities due to its low market cap and historical tendency to deliver sharp rallies once momentum shifts. This adds to its speculative appeal and could attract more volume and volatility in the days ahead. Traders seeking early entries into potentially explosive moves should keep a close eye on this coin.
Overall, WINUSDT presents a compelling technical case supported by strong demand zones and a classic bullish setup. If current levels hold and breakout confirmation arrives, the coin could offer lucrative returns for disciplined traders.
✅ Show your support by hitting the like button and
✅ Leaving a comment below! (What is You opinion about this Coin)
Your feedback and engagement keep me inspired to share more insightful market analysis with you!
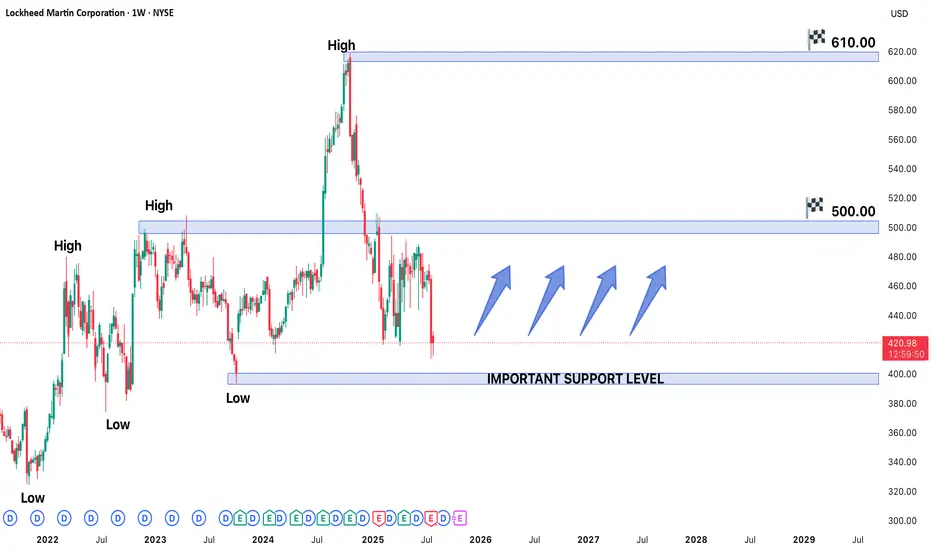
Lockheed Martin (LMT) Stock in Strong Bullish TrendLockheed Martin (LMT) Stock in Strong Bullish Trend - Key Levels to Watch
Lockheed Martin's (LMT) stock is currently exhibiting a well-defined bullish trend, trading near a recent higher low that may serve as a crucial support level for the next upward move. The defense giant continues to benefit from robust global military spending and a strong contract pipeline, positioning the stock for potential further gains.
Technical Structure & Key Levels
- Higher Low Support: The current price zone represents a critical support area where buyers have previously stepped in, maintaining the upward trajectory
- Upside Targets:
- Near-term: $500 (previous resistance zone)
- Long-term: $610 (potential breakout extension)
- Major Support: $375 would act as strong demand zone if any deeper pullback occurs
Bullish Catalysts Supporting the Trend
1. Defense Sector Strength:
- Record US defense budget allocations for 2024-2025
- Increased NATO military spending amid global tensions
2. Contract Backlog:
- F-35 program continues to drive revenue
- Hypersonic weapons and space systems development
3. Technical Momentum:
- Price trading above key moving averages (50/200 DMA)
- Higher highs and higher lows confirm uptrend structure
Trading Strategy Considerations
- Optimal Entry:
- On bounces from current support level
- On breakout above $460 confirmation
- Risk Management:
- Stop-loss below $375 for longer-term positions
- Partial profit-taking near $490-500 resistance
- Confirmation Signals:
- Volume increase on upside moves
- Sustained closes above $460
Potential Risks to Monitor
- Geopolitical shifts affecting defense budgets
- Program delays (particularly in F-35 production)
- Broader market corrections impacting defense sector
Long-Term Outlook:
The combination of fundamental strength and technical positioning suggests LMT could progress toward 500 near-term, with $610 as a viable long-term target if the bullish structure holds. Traders should watch price action around current levels for continuation signals while remaining mindful of the $375 support as a critical level for the bullish thesis.
Bullish Bat (1.272 Target)Bullish Bat Harmonic Pattern Discovered on the Larger Timeframes for ENA-USDT. 1.272 Fibonacci Target. 3:1 Trade Setup

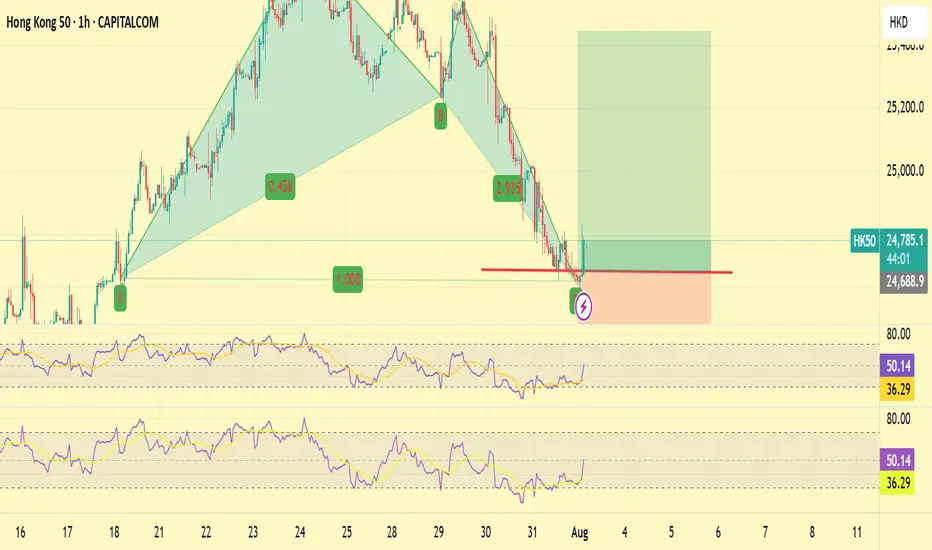
HK50 LONG This trade is with the daily trend and the showing the momentum still being very up
There are multiple bat patterns on H1 and M15
This trade is oversold on all timeframes up to H4 and showing divergence
Stop loss of 200 pips
ETH 4H – 58% Trend Ride From MACD Liquidity StrategyThis Ethereum 4H setup shows the power of a clean trend-following system. The MACD Liquidity Tracker Strategy (Normal Mode) entered long on July 1st after price reclaimed both the 60 and 220 EMAs — a major shift in directional bias confirmed by MACD momentum flipping bullish.
From there, ETH trended smoothly for weeks, gaining +58.35% before the strategy exited automatically as momentum waned and MACD flipped bearish. No overtrading, no manual input — just clear structure, confluence, and filter-based entries.
Now, we’re seeing pink candles return and price struggling to hold the 60 EMA. A continued breakdown here could open the door toward $3,400–$3,500 support. Bulls must reclaim $3,750+ quickly to confirm continuation.
📊 Strategy Breakdown:
– MACD: 25 / 60 / 220
– EMA Filter: 60 & 220
– Mode: Normal
– Timeframe: 4H
Educational content. Drop thoughts or questions below — let’s break it down together.

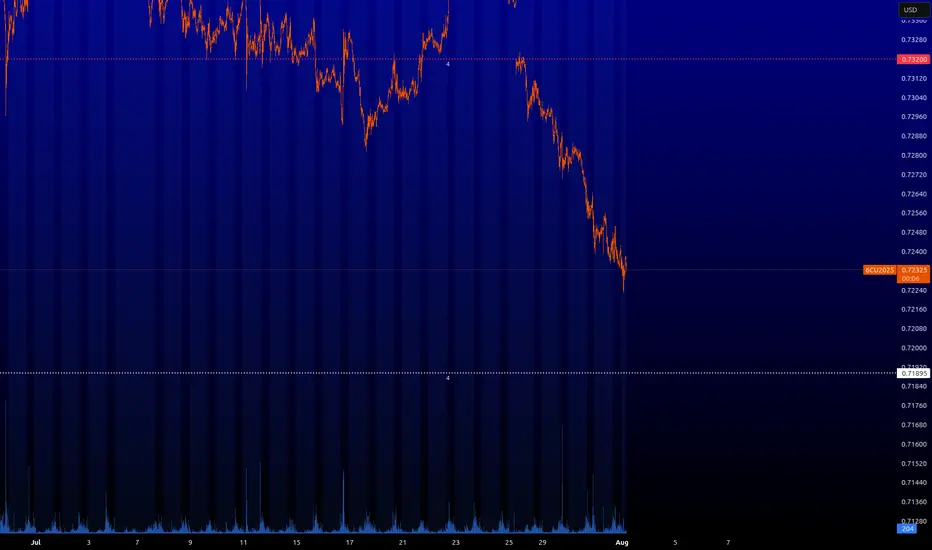
6C : Key levelsThat's the picture on this tool. This instrument will walk on other levels and will see them, but when it will be possible to trade confidently from them, I will tell you. For now you can observe and use them in YOUR trading system.
$TGTNYSE:TGT slipping lower could be a red flag 🚨
Middle-income consumers might be feeling the squeeze less spending, tighter wallets.
If Target keeps dropping while dollar stores & luxury stay strong, the middle class might be getting crushed.

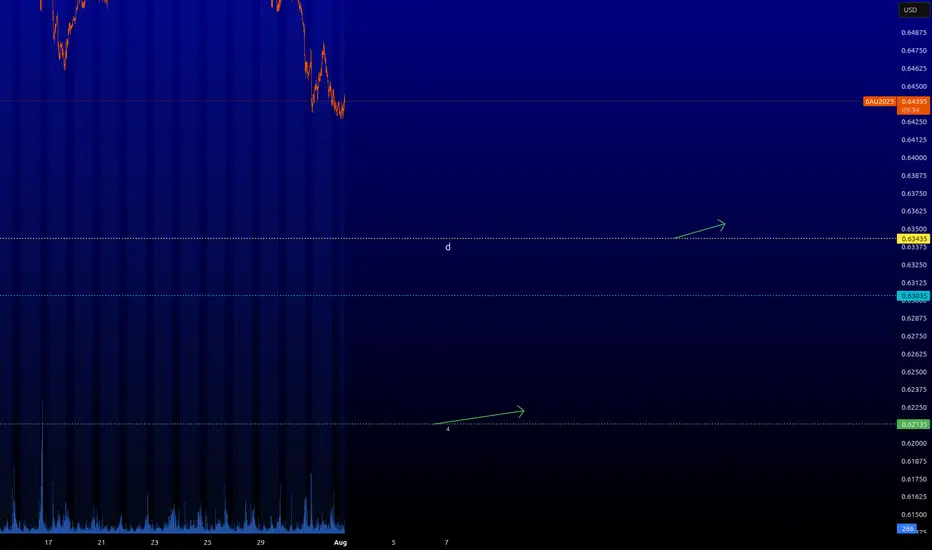
6A : Key LevelsThat's the picture on this tool. It is possible to take short-term longs from two levels with arrows. I do not recommend trading them on Forex. The spread can eat up all the profit.
⚠️ VOLATILITY WARNING ⚠️
Trading around major news can be extremely unpredictable. Trade responsibly!
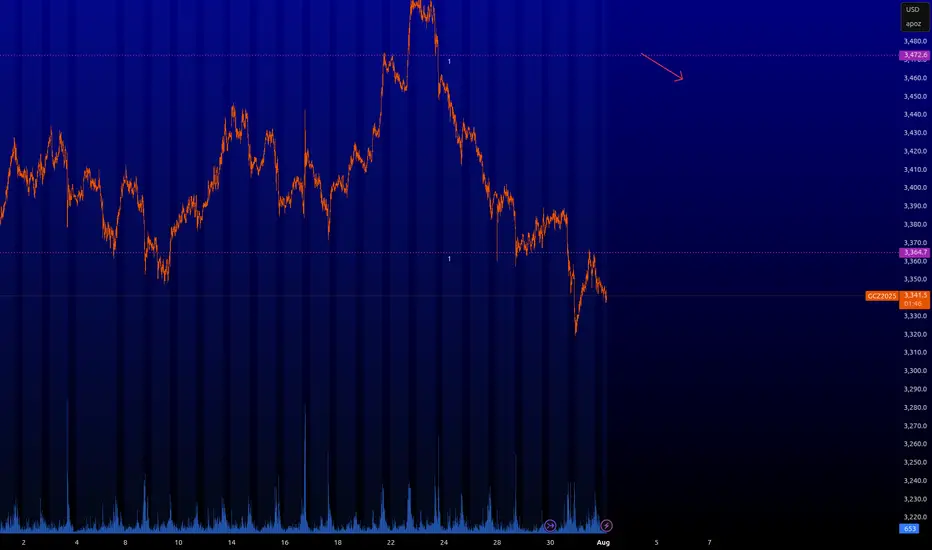
GC : Key levelsHere are the key levels that the market will be interested in. You can scalp from 3.472.
⚠️ VOLATILITY WARNING ⚠️
Trading around major news can be extremely unpredictable. Trade responsibly!
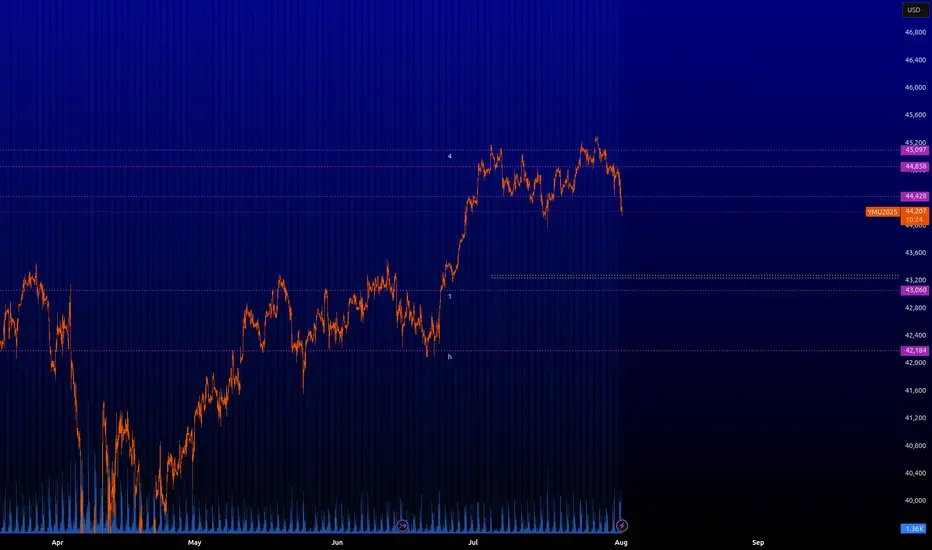
YM : Key levelsHere are the key levels that the market will be interested in. From the green zone it is ideal to look for longs. As it will be possible to enter somewhere by limitation and take some profit, I will inform you.
⚠️ VOLATILITY WARNING ⚠️
Trading around major news can be extremely unpredictable. Trade responsibly!
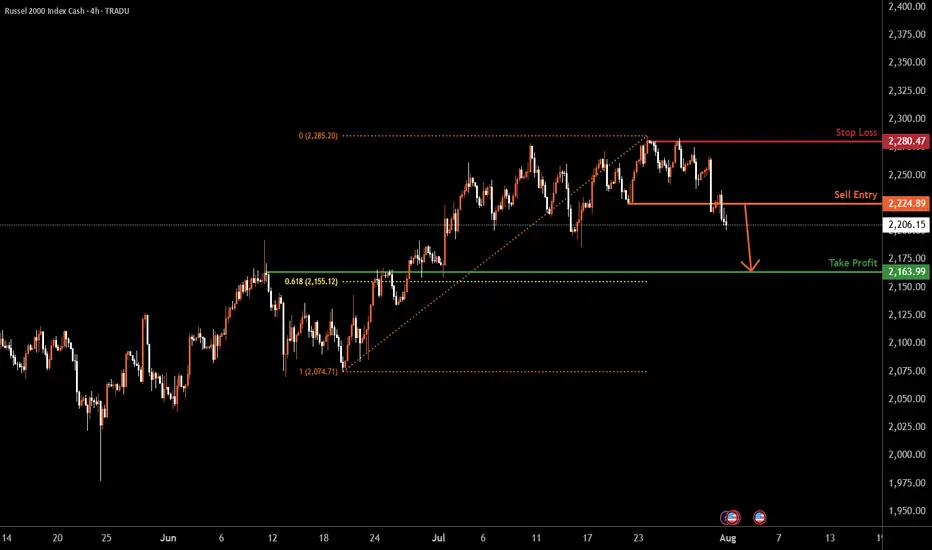
US2000 H4 | Bearish dropBased on the H4 chart analysis, we could see the price drop lower from the sell entry to the downside.
Sell entry is at 2,224.89, which is a pullback resistance.
Stop loss is at 2,280.47, a swing high resistance.
Take profit is at 2,163.99, which is an overlap support that is slightly above the 61.8% Fibonacci retracement.
High Risk Investment Warning
Trading Forex/CFDs on margin carries a high level of risk and may not be suitable for all investors. Leverage can work against you.
Stratos Markets Limited (tradu.com ):
CFDs are complex instruments and come with a high risk of losing money rapidly due to leverage. 65% of retail investor accounts lose money when trading CFDs with this provider. You should consider whether you understand how CFDs work and whether you can afford to take the high risk of losing your money.
Stratos Europe Ltd (tradu.com ):
CFDs are complex instruments and come with a high risk of losing money rapidly due to leverage. 66% of retail investor accounts lose money when trading CFDs with this provider. You should consider whether you understand how CFDs work and whether you can afford to take the high risk of losing your money.
Stratos Global LLC (tradu.com ):
Losses can exceed deposits.
Please be advised that the information presented on TradingView is provided to Tradu (‘Company’, ‘we’) by a third-party provider (‘TFA Global Pte Ltd’). Please be reminded that you are solely responsible for the trading decisions on your account. There is a very high degree of risk involved in trading. Any information and/or content is intended entirely for research, educational and informational purposes only and does not constitute investment or consultation advice or investment strategy. The information is not tailored to the investment needs of any specific person and therefore does not involve a consideration of any of the investment objectives, financial situation or needs of any viewer that may receive it. Kindly also note that past performance is not a reliable indicator of future results. Actual results may differ materially from those anticipated in forward-looking or past performance statements. We assume no liability as to the accuracy or completeness of any of the information and/or content provided herein and the Company cannot be held responsible for any omission, mistake nor for any loss or damage including without limitation to any loss of profit which may arise from reliance on any information supplied by TFA Global Pte Ltd.
The speaker(s) is neither an employee, agent nor representative of Tradu and is therefore acting independently. The opinions given are their own, constitute general market commentary, and do not constitute the opinion or advice of Tradu or any form of personal or investment advice. Tradu neither endorses nor guarantees offerings of third-party speakers, nor is Tradu responsible for the content, veracity or opinions of third-party speakers, presenters or participants.
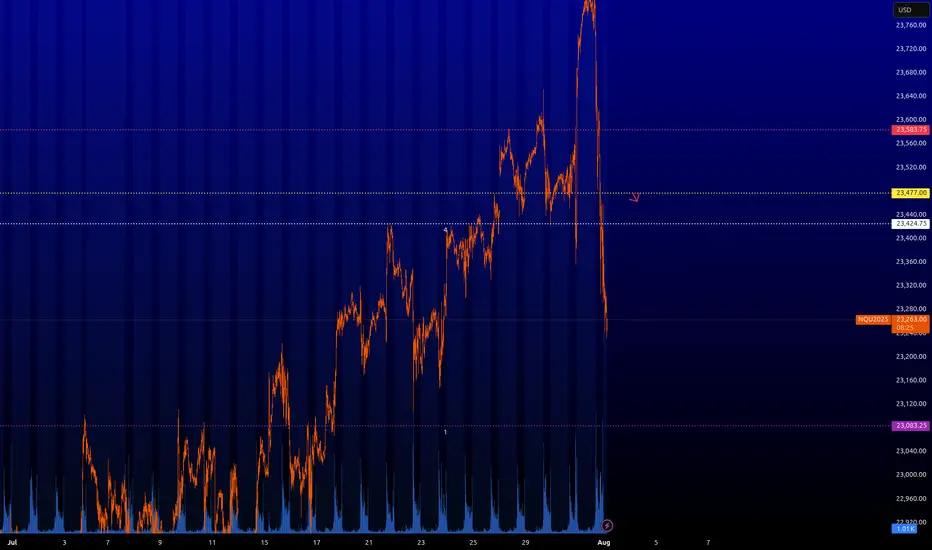
NQ : Key levelsHere are the key levels that the market will be interested in. From the yellow level ~23.477 you can already look for shorting trades. However, I would be careful with shorts on US indices. The other levels are still risky for limit order trading.
⚠️ VOLATILITY WARNING ⚠️
Trading around major news can be extremely unpredictable. Trade responsibly!
DOTUSD H4 | Bearish dropDOT/USD has rejected the sell entry and could drop lower to the take profit, which acts as a multi-swing low support.
Sell entry is at 3.702, which is a pullback resistance.
Stop loss is at 4.128, which is a potential pullback resistance.
Take profit is at 3.143, which is a multi-swing low support that is slightly above the 161.8% Fibonacci extension.
High Risk Investment Warning
Trading Forex/CFDs on margin carries a high level of risk and may not be suitable for all investors. Leverage can work against you.
Stratos Markets Limited (tradu.com ):
CFDs are complex instruments and come with a high risk of losing money rapidly due to leverage. 65% of retail investor accounts lose money when trading CFDs with this provider. You should consider whether you understand how CFDs work and whether you can afford to take the high risk of losing your money.
Stratos Europe Ltd (tradu.com ):
CFDs are complex instruments and come with a high risk of losing money rapidly due to leverage. 66% of retail investor accounts lose money when trading CFDs with this provider. You should consider whether you understand how CFDs work and whether you can afford to take the high risk of losing your money.
Stratos Global LLC (tradu.com ):
Losses can exceed deposits.
Please be advised that the information presented on TradingView is provided to Tradu (‘Company’, ‘we’) by a third-party provider (‘TFA Global Pte Ltd’). Please be reminded that you are solely responsible for the trading decisions on your account. There is a very high degree of risk involved in trading. Any information and/or content is intended entirely for research, educational and informational purposes only and does not constitute investment or consultation advice or investment strategy. The information is not tailored to the investment needs of any specific person and therefore does not involve a consideration of any of the investment objectives, financial situation or needs of any viewer that may receive it. Kindly also note that past performance is not a reliable indicator of future results. Actual results may differ materially from those anticipated in forward-looking or past performance statements. We assume no liability as to the accuracy or completeness of any of the information and/or content provided herein and the Company cannot be held responsible for any omission, mistake nor for any loss or damage including without limitation to any loss of profit which may arise from reliance on any information supplied by TFA Global Pte Ltd.
The speaker(s) is neither an employee, agent nor representative of Tradu and is therefore acting independently. The opinions given are their own, constitute general market commentary, and do not constitute the opinion or advice of Tradu or any form of personal or investment advice. Tradu neither endorses nor guarantees offerings of third-party speakers, nor is Tradu responsible for the content, veracity or opinions of third-party speakers, presenters or participants.

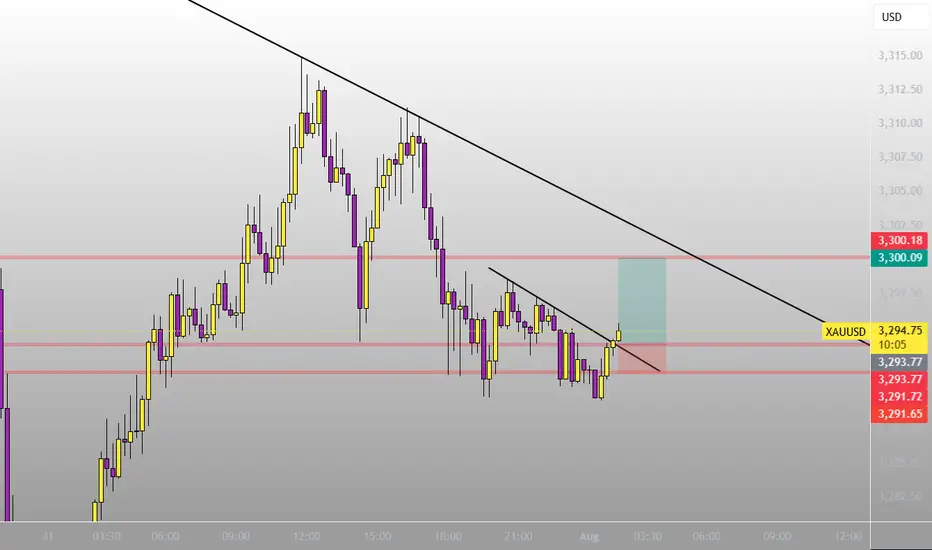
XAUUSD
XAUUSD Updated in 5M :
The gold signal is marked on the chart based on the latest price changes and the supply and demand in the market. These points include the entry point, stop loss, and take profit
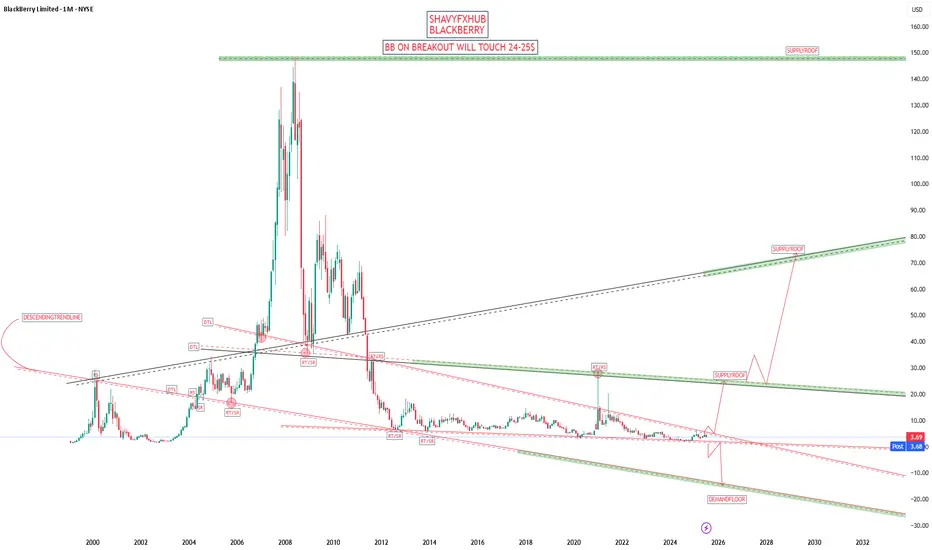
BLACKBERRY BREAKOUT OF DESCENDING TRENDLINE COULD SEE 22$-24$
BlackBerry today is a Canadian technology company specializing in cybersecurity software and Internet of Things (IoT) services for enterprises and governments worldwide. Formerly renowned as a mobile device manufacturer, BlackBerry Limited (formerly Research In Motion, RIM) exited the smartphone business in 2016 and now focuses on secure communications, endpoint management, and embedded systems, especially for industries like automotive, healthcare, and government.
Company Profile & Business
Headquarters: Waterloo, Ontario, Canada
Core products: Cybersecurity solutions, BlackBerry Unified Endpoint Management (UEM), QNX operating systems, secure messaging (BlackBerry Messenger Enterprise, BBMe), and automotive software platforms.
Global presence: Products and services are sold worldwide across the Americas, Europe, Middle East, Africa, and Asia-Pacific.
Recent Financials & Stock
Stock ticker: NYSE/TSX: BB
Recent price: As of July 30, 2025, BlackBerry closed at $3.74 per share, reflecting a decline from earlier in the month. Price targets for the company now range from $2.71 to $4.75, with analysts citing positive revenue growth and the company's first positive cash flow in three years after its recent quarterly results.
Business momentum: The company recently posted about 10% higher revenue compared to forecasts for the third quarter fiscal year 2025, with a shift to positive earnings and cash flow—highlighting improvements in its cybersecurity and IoT software businesses.
Notable News & Developments
End of smartphones: BlackBerry-branded mobile devices are officially discontinued. The company fully exited the hardware business by 2018 and stopped supporting BlackBerry 10 in 2022.
Nostalgia revival: In 2025, a separate company (Zinwa Technologies) is reviving classic BlackBerry devices (like the BlackBerry Classic and Passport) by retrofitting them with modern Android internals. These are not officially affiliated with BlackBerry Limited, but appeal to enthusiasts for the classic design and QWERTY keyboard, albeit with privacy caveats due to non-BlackBerry software.
Enterprise focus: BlackBerry remains a leader in secure software for businesses, including automotive OS (QNX), endpoint security, and secure messaging. Major clients include automotive OEMs, financial corporations, and government agencies.
Quick Facts Table
Aspect Details
Industry Cybersecurity, IoT software, enterprise services
Founded 1984 (as Research In Motion, Canada)
Consumer Phones Discontinued; brand revived unofficially by others
Current Stock Price $3.74 (July 30, 2025)
Latest Product Focus Automotive software, secure endpoint management
BlackBerry is no longer a phone maker, but remains a significant player in secure enterprise and automotive software, with stock prices and business outlook reflecting its transition into these fields.
#BB
XOM Short (-33%)XOM is likely to Sharp decline from $112, aligning with its target within the FVG zone and the leg of the Crab pattern.

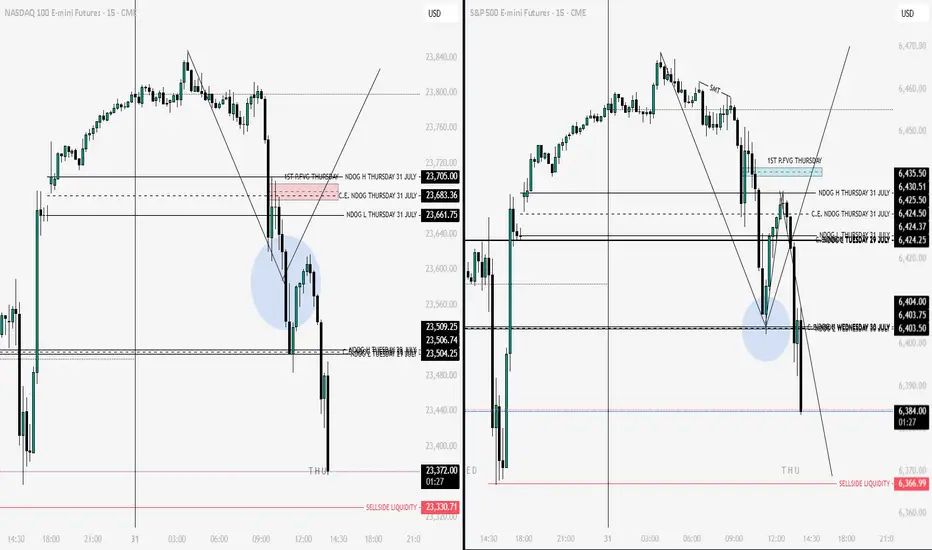
Nq & Es Key Levels 31-07 After PredictionsThe price resisted the point indicated before but the price did not continue upwards. Not good Analysis Today...