Harmonictraders
NiftyHello and welcome to this analysis
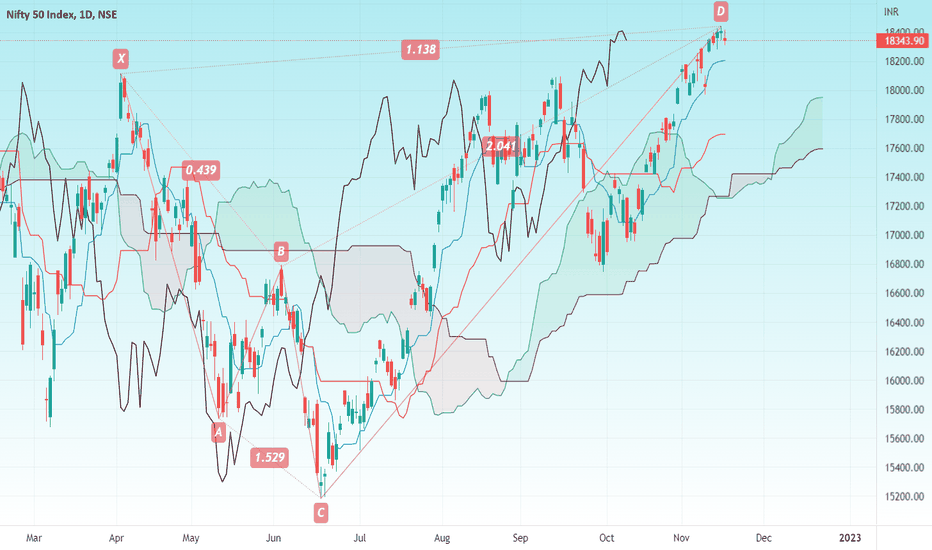
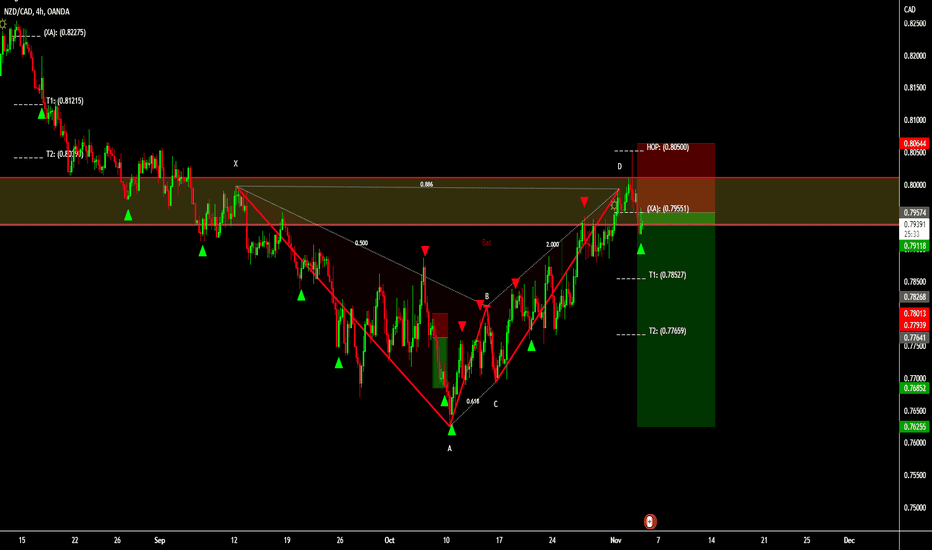
Nifty today activated not one but two bearish reversal signals.
First it activated a Bearish Harmonic Alt Shark (double confirmation if price sustains below 18350) for suggested downside levels of 17750/17250. This pattern would be considered negated above 18575.
Second it coincided with an Ichimoku Price and Time axis equilibrium date - (double confirmation if price sustains below 18360. The reversal as per Ichimoku will become invalid if a daily candle close occurs above 18450. Downside targets for Ichimoku are also similar to Harmonic ones.
Use the dips / correction to add stocks, corrections are healthy and a good opportunity to invest in growth stocks.
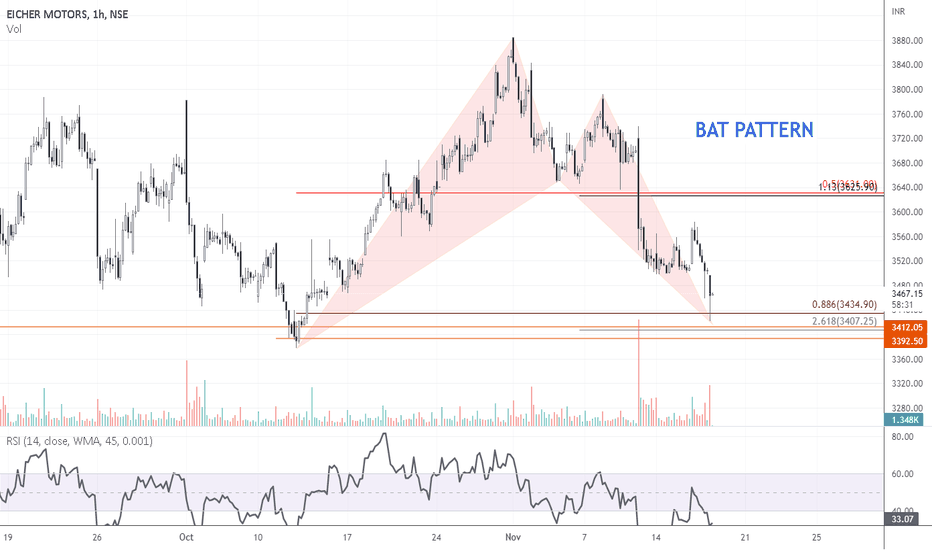
EICHER MOTORS - at short term supportThere's a formation of Bullish Bat Pattern on the hourly chart of the Eicher Motors,
Bat pattern is a five-legged harmonic pattern that provides us with potential reversal zones, from where stock usually witnesses sharp recovery or fall as the case may be.
Here 3407-3434 is the PRZ that the pattern provided as we did see the sharp recovery back from there.
The pattern PRZ is also coinciding with the daily chart support levels around 3400.
Now sustaining prz , we may see stock testing 3500- 3570 in the coming trading sessions.
Trade type: Reversal Long Trade
Pattern: Bullish Bat Pattern
Support: 3400-3434
Target: 3500-3570
CMP: 3464
How to Buy: Time your trade from lower timeframes, to manage your risk better.
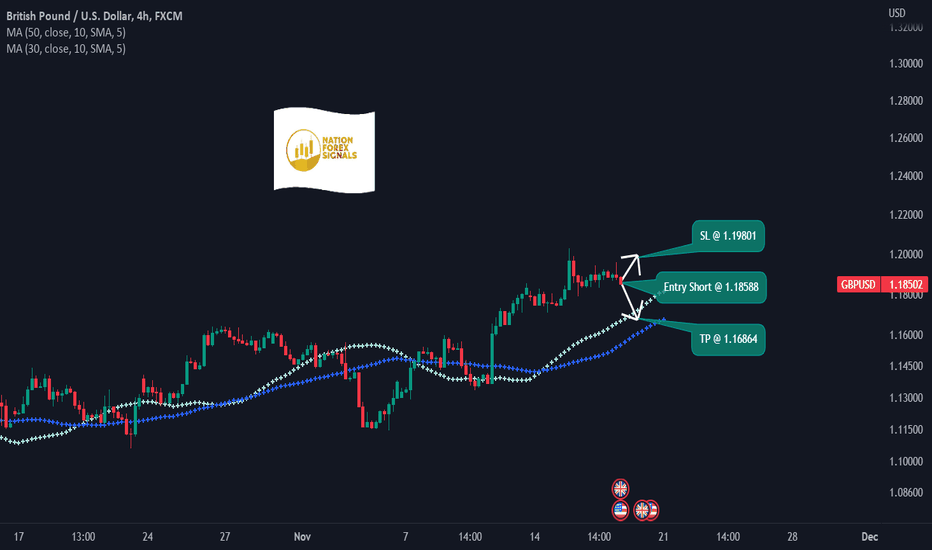
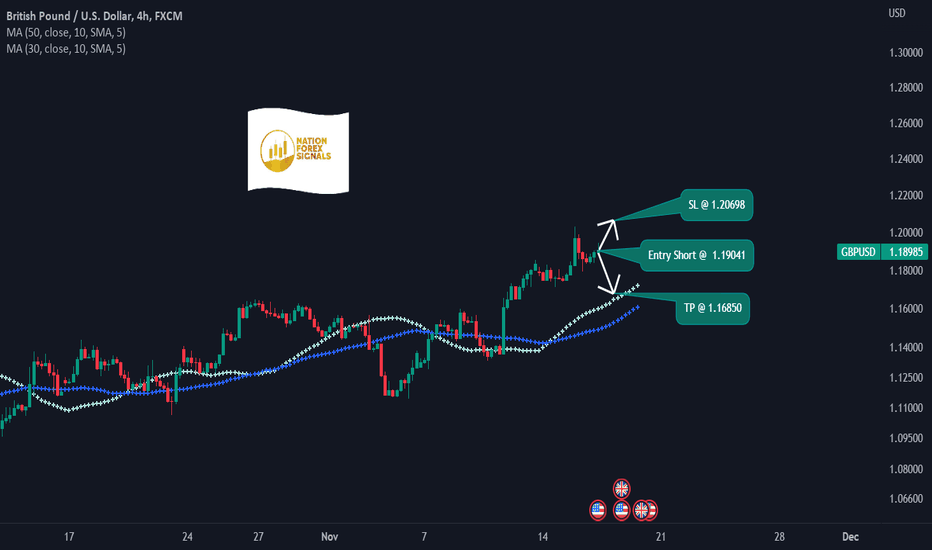
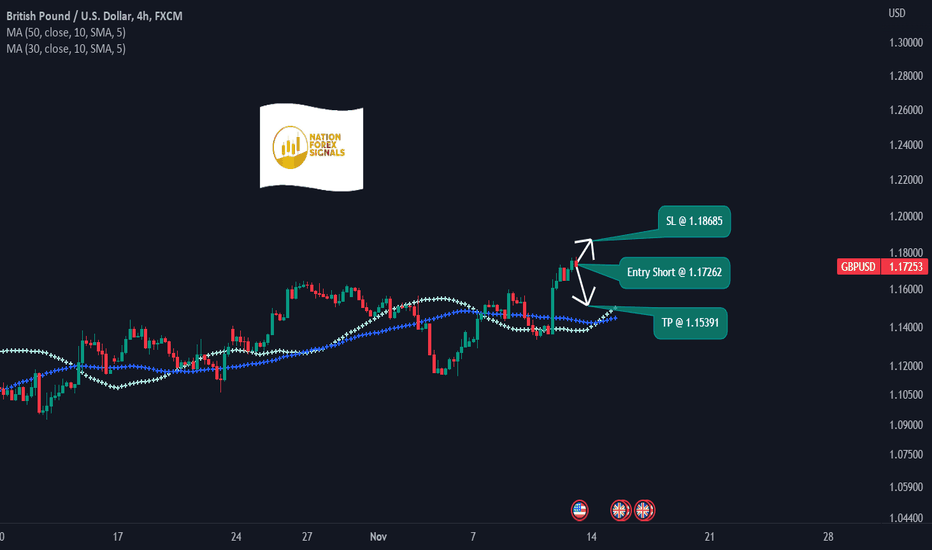
GBPUSD ShortTime Frame: 4H
Symbol: GBPUSD
Entry: 1.19041
TP: 1.16850
SL: 1.20698
Bias: Short
Recent price study exposes a positive expectation for pairs that run counter to United States Dollar. As we see the strength of dollar is in a declining mode and considering the scope of dollar price changes , the other currencies are oscillating accordingly.
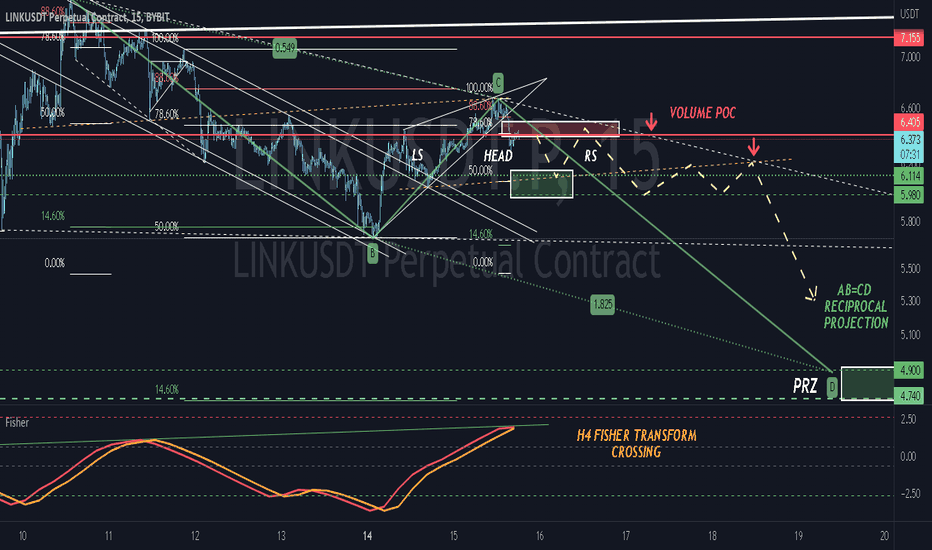
LINKUSDT 2nd Bear LegAfter a recovery rally that reaches the upper trendline of the descending triangle, the price action appears to be printing a Head and Shoulders formation, the right shoulder can be formed after a possible reaction from the green box area (local support), then the price can turn to react to volume POC Level @ USDT6.4 which is the same level as the low of the September 1M inside bar Candlestick pattern. The decreasing breakout of the ascending micro wedge has placed the Fisher Transform oscillator in a bearish crossover, which suggests a possible 2nd leg swing below the entry POC. The previous swing made an ABC retracement of 0.549, which AB=CD (0,548 ==> 1,825) reciprocal points to a harmonic target @USDT4.9, being TP2 previously speculated with a 14.6% Fibonacci retracement at the key level.
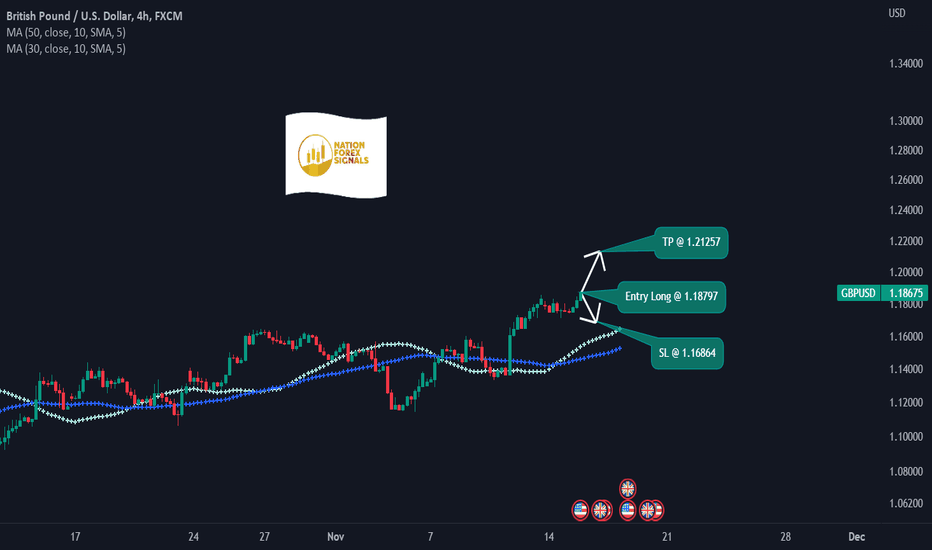
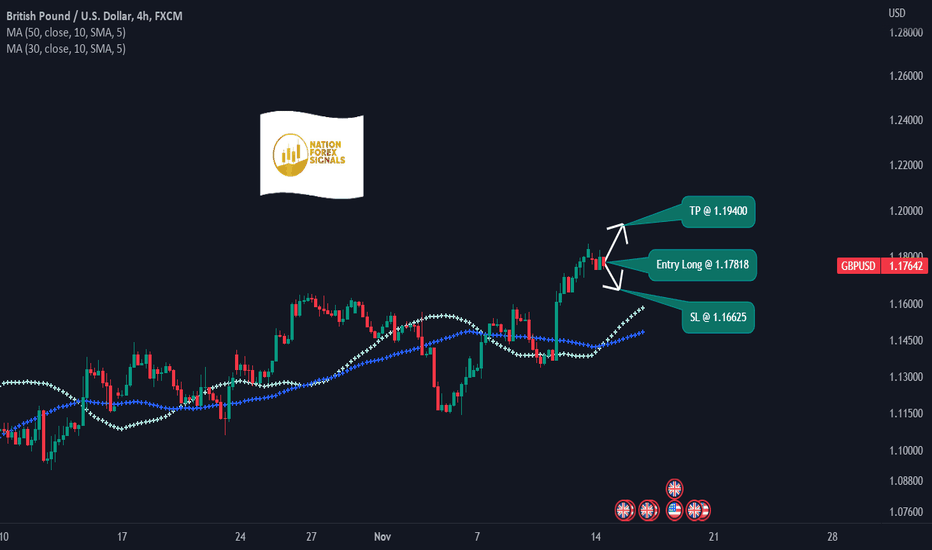
GBPUSD LongTime Frame: 4H
Symbol: GBPUSD
Entry: 1.18797
TP: 1.21257
SL: 1.16864
Bias: Long
Currently the forex pairs are trying to take a directional bias . Though the strength of the pairs do not seem to be equipped with enough strength to slide away to a particular channel in up or down direction, our projection is based upon current study of dynamic support and resistance .
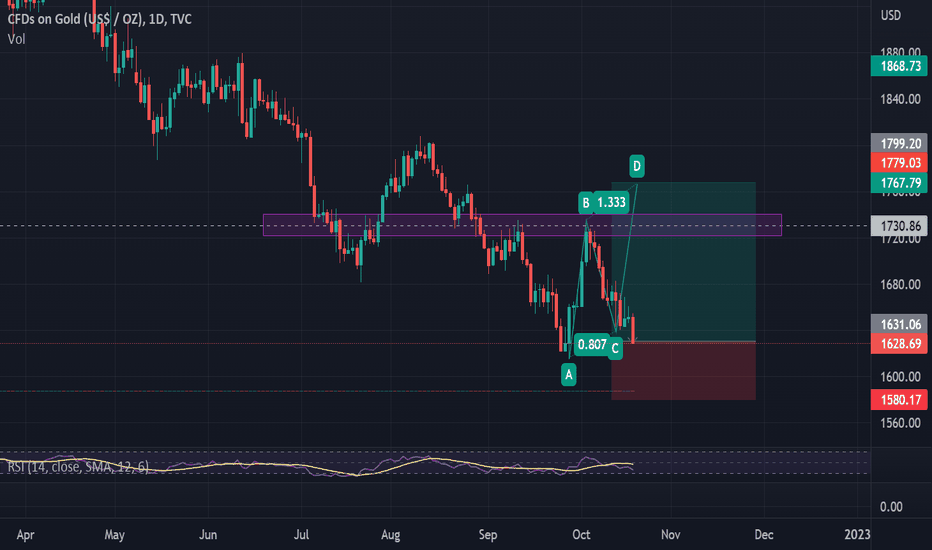
XAUUSD Bullish retracement for D1Hi traders,
Although we are holding XAUUSD/ Gold short positions from our previous analysis, we see an opportunity to long the pullback formed by a completed ABCD bullish trend hike considering that we are currently oversold on the lower timeframes. We have been selling to 1628 on the lower timeframes and see an opportunity to take advantage of this pullback. Please share your thoughts.
Discalimer
NASDAQ Guru offers general trading signals that does not take into consideration your own trading experiences, personal objectives and goals, financial means, or risk tolerance.
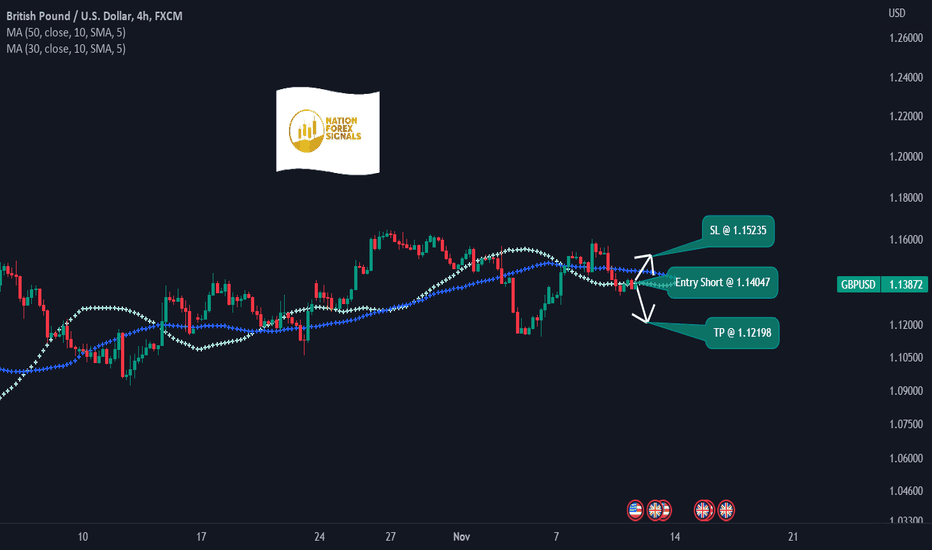
GBPUSD ShortTime Frame: 4H
Symbol: GBPUSD
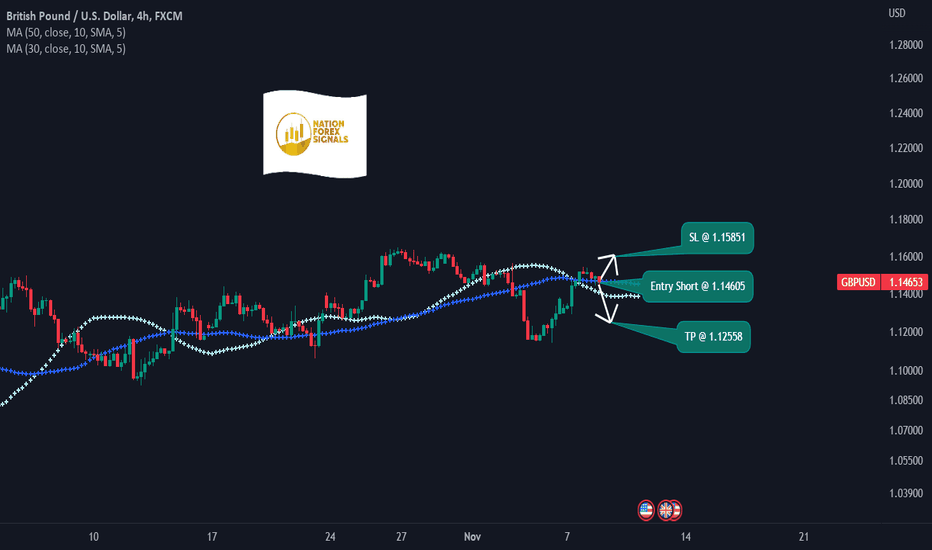
Entry: 1.14047
TP: 1.12198
SL: 1.15235
Bias: Short
Current flow of price dynamics is suggestive of a non-directional range bound trades. The optimism for a trending situation or the euphoria of momentum and volatility both are are absent. We are projecting our trade set ups based upon recent movement propensity.
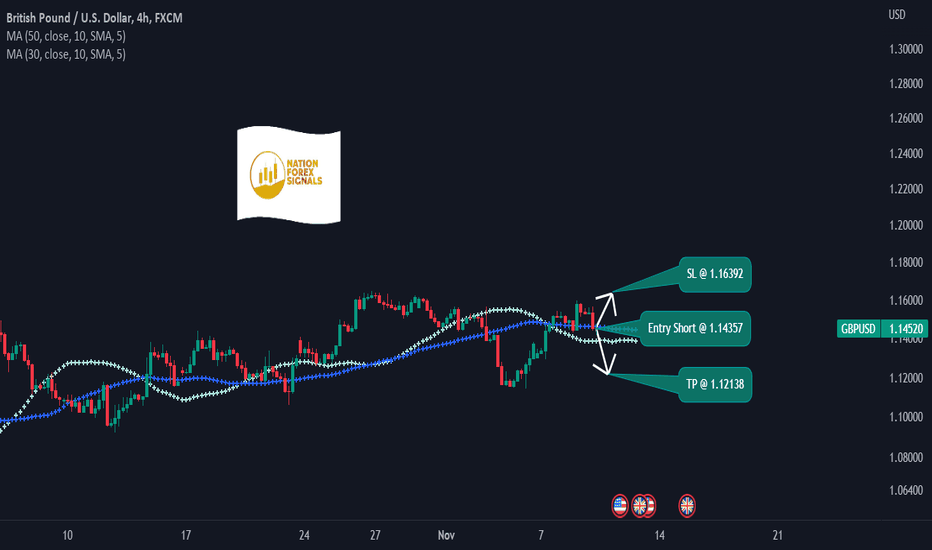
GBPUSD ShortTime Frame: 4H
Symbol: GBPUSD
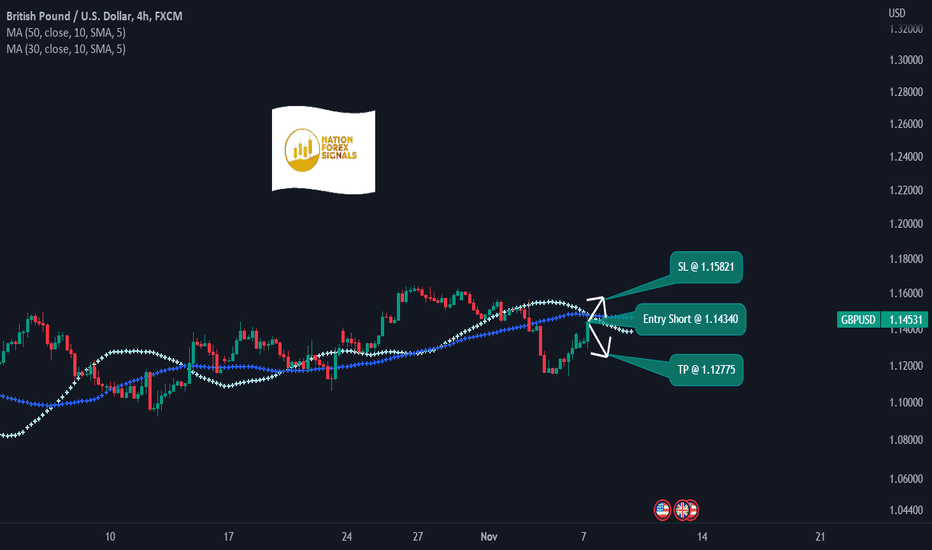
Entry: 1.14357
TP: 1.12138
SL: 1.16392
Bias: Short
The forex pairs are in a tight range and the oscillations are rather switching between support to resistance and resistance to support . Our technical analysis based on dynamic support and resistance display optimism for the set up we have projected here.
Bandhan BankHello and welcome to this analysis
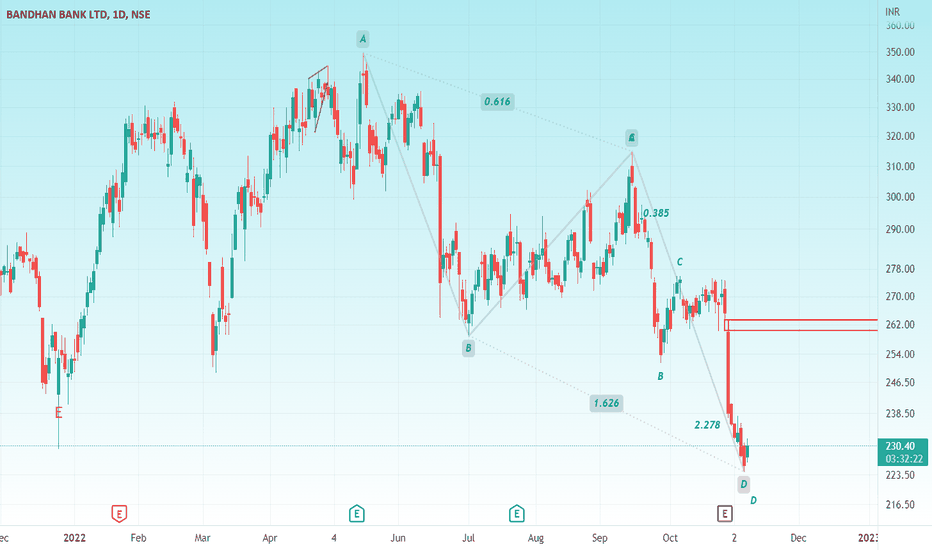
Upon completing a Bearish 5-0 Harmonic pattern it has formed a Bullish Harmonic AB=CD (62/162) at 225 and at the same time activated another Bullish Harmonic AB=CD (38/224) 225-215 PRZ.
Bullish reversal is being seen today. As long as its above 215 it can do 250/275. Accumulate in the zone of 225-235
Good risk reward set up at current level
Happy Investing
