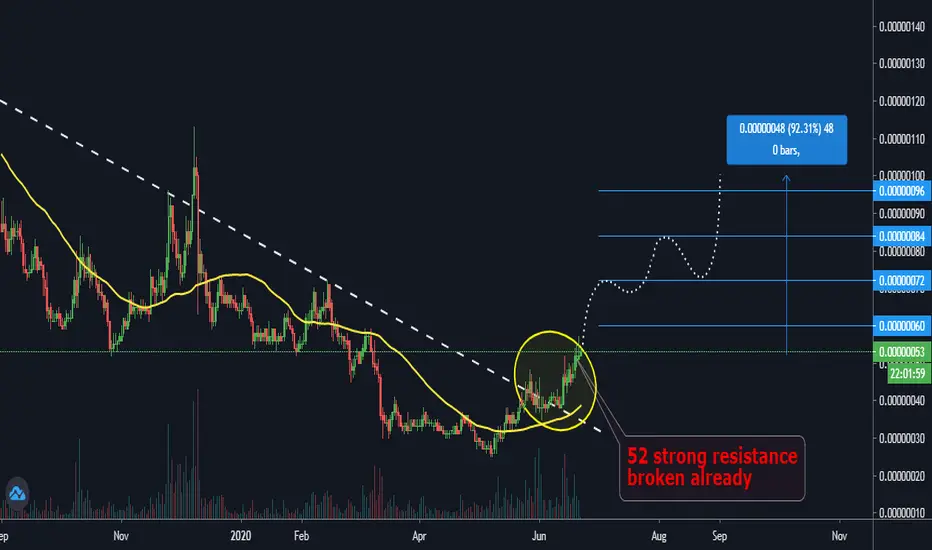
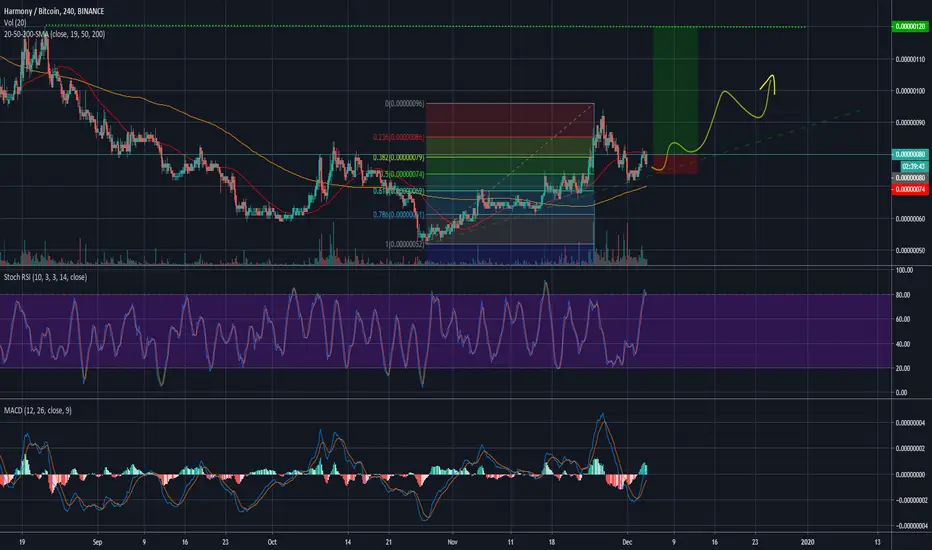
Harmony has completed a big bullish setupHey friends, hope you are well, and welcome to the new update on Harmoney coin.
Up channel and different indicators:
The priceline of ONE coin is moving in an up-channel and crossing up the 25 and 50 simple moving averages. The stochastic and MACD are strong bullish.
Big bullish Shark move:
On long-term monthly chart ONE with Bitcoin pair, the price action of ONE token has formed a big bullish Shark and entered in potential reversal zone.
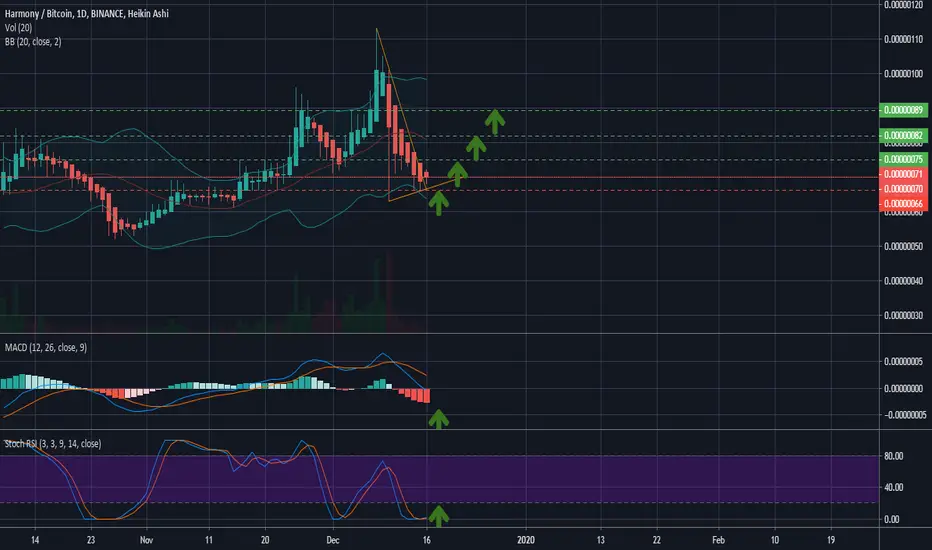
Ichimoku cloud and different indicators:
The price action Harmony with Bitcoin pair is moving below the Ichimoku cloud. Now the cloud has turned bullish and MACD and Stochastic are also turning bullish. The Stochastic is also in the oversold zone.
Conclusion:
As the price action of Harmony coin with Bitcoin pair is turning bullish and it can breakout the Ichimoku cloud resistance in the long-term weekly chart, therefore it can also break out the up-channel that the price action of ONE has formed with US Dollar pair on the weekly chart.
Harmonybitcoin

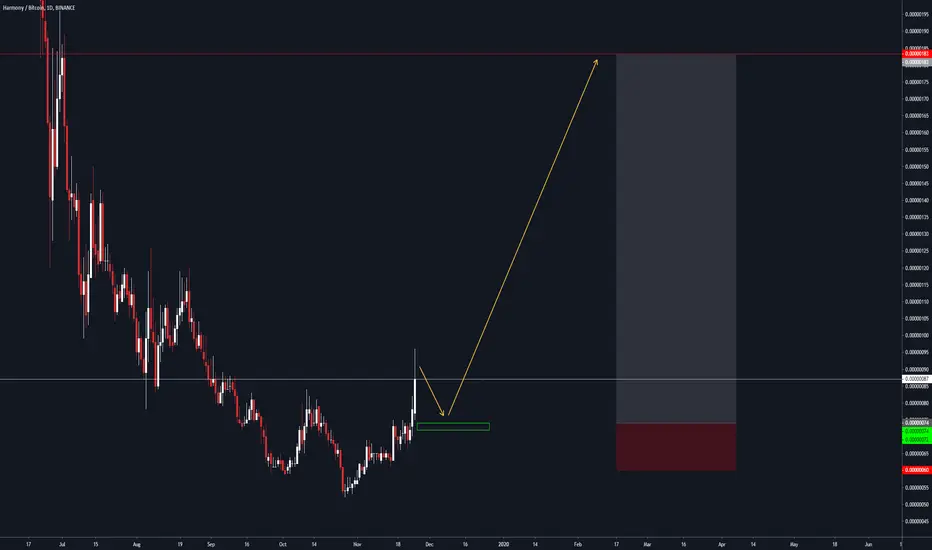
Harmony has completed a big Shark to produce up to 10200% rallyHi friends, hope you are well, and welcome to the new update on Harmony coin.
On a long-term monthly time period chart, the price action of the ONE coin has completed the final leg of the bullish Shark pattern and entered the potential reversal zone. The price action cannot enter the negative zone therefore it is not possible that the priceline of ONE may move more down up to 1.13 Fibonacci retracement level. The priceline of Harmony coin also has found firm support at 0.00000000895 btc , therefore it can be considered as a maximum extent of potential reversal zone area.
This trade has a huge profit possibility of 10200%, and a very high loss possibility up to 99%.
Note: Above idea is for educational purpose only. It is advised to diversify and strictly follow the stop loss, and don't get stuck with trade.
For exact buy and sell targets for this trade, and other harmonic trading signals you can join:
www.patreon.com

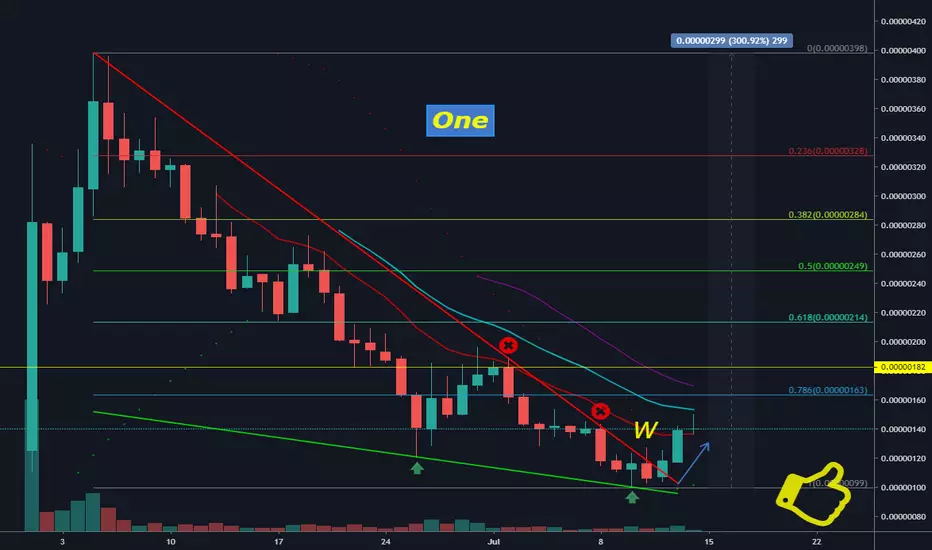
HARMONEY (ONE) ANALYSIS: BREAKDOWN OF THE WEDGE!HARMONY (ONE) ANALYSIS:
HARMONY has been falling inside of a strong falling wedge but recently confirmed a third touch to the bottom trend line. The bounce off this line does not seem to be fake out as it is backed by a strong volume of buyers which stepped in. RSI became neutral and ATR is trending at low rates. I expect a favorable breakout of the wedge on the next attempt here coming up. The target profit 1 is 62 sats, followed by T2 at 69, and T3 at 78 sats. The large order blocks of resistance come right near T3 and above as harmony enters 80+ sats. Looks to exit trade fully by T3, take profit along the way!
Possible Entries: 54-57 sats


ONE LONG$ONE
I anticipate this will keep moving up from here in tandem with the other IEO's. Could see a pullback into 86 first, targeting 104 sats.
HARMONIZING THE ALTSThis hidden gem has recently gotten out of it's hole and started showing some life in it.
Price founds support at the 50% fibonacci retracement level, and is successfully holding it for now.
It must hold this level in order for us to see the upper movement becoming reality.
We have a golden cross which is a bull indicator.
STOP LOSS & TAKE PROFIT LEVELS SHOWN ON THE CHART.
THIS IS NOT A FINANCIAL ADVICE, PLEASE TRADE CAREFULLY.
[ONEBTC] the 150% trade that you shouldn't miss! If you don't have a capital/risk management, don't enter this trade!
Everything is detailed on the chart. Buy only in our buying zone!
If our buying zone has been broken with 2x Daily candles, I'll consider closing the trade even if it didn't trigger our stop-loss, so keep tuned.
Harmony ONE double bottom bounce ?Harmony ONE price action (PA) double bottom bounce at 65 sats. Potential target 93 sats 1.1618 fibs level. Harmony closed above EMA 21,50,100,200 periods Uptrend.
Volume: confirm bullish price action.
Patterns: Double Bottom at 59 and 65 sats.
Indicators: MACD bullish crossover above zero line. RSI above 50 points. Bullish sign.
S/R Majort Support 59 sats, Support 65 sats, Resistance psychology at 100 sats. Resistance 93 sats.
Disclaimer: THIS IS NOT FINANCIAL ADVICE. All the information shared here is for learning and entertainment purposes only.

Harmony/Bitcoin (Sept 07) #ONE $ONE #BTC $BTCA tiny volume is coming to ONE but so low and it's not easy to pump ONE too high. But we can take risk with it!
Buy : Close to 80sts as possible
Sell : 90-100
Mid-Hold : 125-140-195
Long-Hold : 260-270
Stop : Under 78
Buy-back plan : 55

ONEBTC has completed BAT pattern a good long opportunityThe pricline of Harmony (ONE) /BITCOIN cryptocurrency has completed BAT pattern .
I have defined the targets as perfibonacci sequence and those targets are:
Buy between: 0.00000109 to 0.00000106
Sell between: 0.00000122 to 0.00000114
Regards,
Atif Akbar (moon333)

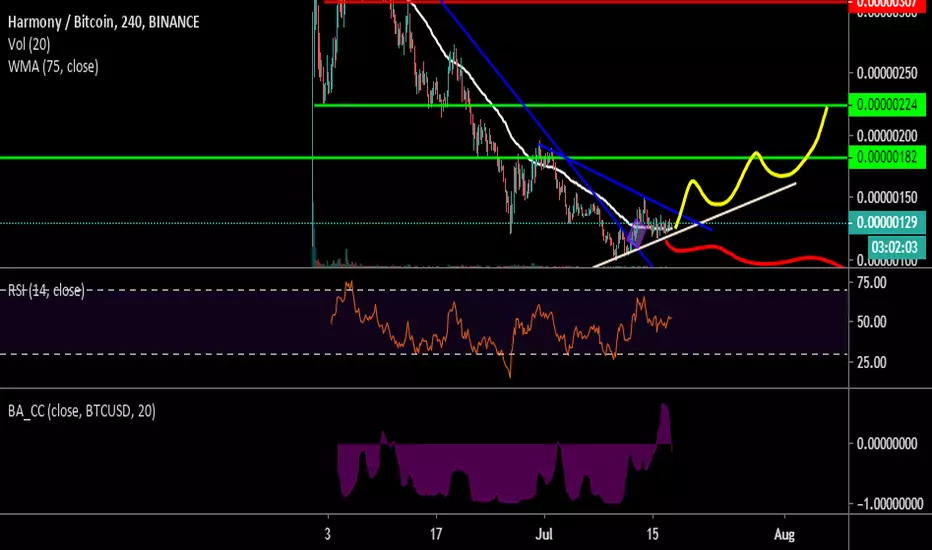
Harmony one possible reversalOne Harmony
watching ONE closely we after we break the first descending resisatance line we need now to break the second for a confirmation
entry price would be when we touch the support (white line ) fingers crossed
Harmony/Bitcoin (July 01) #ONE $ONE #BTC $BTCAccumulate : 170-180
Sellzone : 220-260
Holdzone : 270-305-350-395
Stoploss : Below 160

Harmony/Bitcoin (June 23) #ONE $ONE #BTC $BTC#BUY #WAIT
Current Price : 194
Accumulate : 185-192
Sellzone : 210-215
Holdzone : 260-270-305-350-395
Stoploss : Under 185
Buyback : 170

Harmony/Bitcoin (June 15) #ONE $ONE #BTC $BTC#BUY #WAIT
Current Price : 245
Buyzone : Close to 225-230 as possible
Sellzone : 260-280-305
Holdzone : 350-400
Stoploss : Under 225
