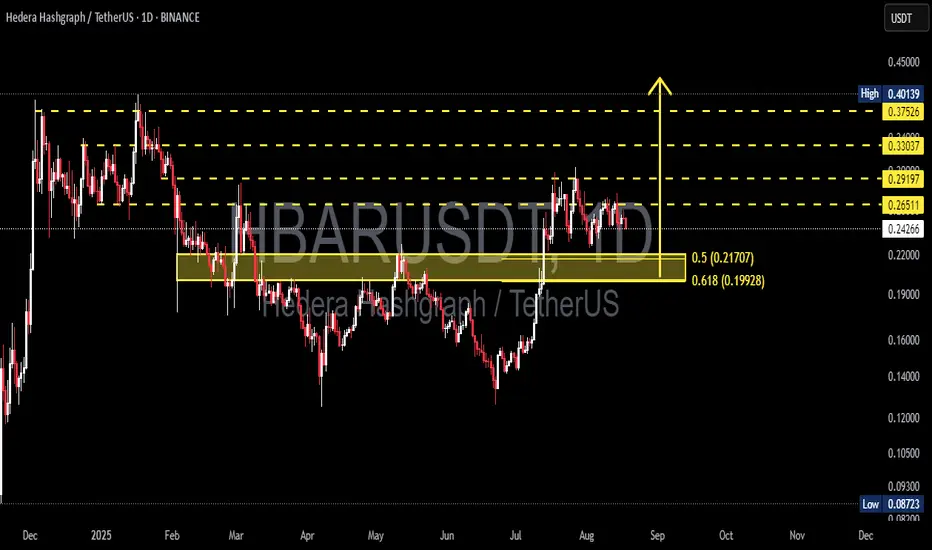
HBARUSDT — Retest of Demand Zone After Breakout?HBAR/USDT is currently in a crucial retest phase after a strong breakout from its key accumulation zone around 0.199–0.217 (yellow box, Fib 0.5–0.618 area). The recent rally toward 0.29–0.30 highlighted strong buying momentum, but price is now consolidating near 0.243, suggesting a healthy pullback before the next potential move.
This structure often signals a bullish retest after breakout — but if key support levels are lost, it could trigger a deeper correction.
---
🔍 Structure & Pattern
Previous phase: HBAR traded sideways for months within a large range.
Recent move: Clean breakout above the accumulation zone.
Current phase: Retesting the demand zone.
Pattern in play: Bullish Retest / Flag Consolidation on the daily timeframe.
Bullish continuation trigger: Daily close above 0.29197 with volume confirmation.
Bearish invalidation: Daily close below 0.19928 (Fib 0.618).
---
📌 Key Technical Levels (1D)
Support (Demand Zone):
0.21707 (Fib 0.5) → first line of defense.
0.19928 (Fib 0.618) → strongest support; bullish invalidation if broken.
Resistance Levels:
0.26511 → minor resistance.
0.29197 → major resistance / breakout trigger.
0.33037 → TP1.
0.37526 → TP2.
0.40139 → local high & ultimate mid-term target.
Downside targets (if breakdown):
0.160–0.140 → prior consolidation zone.
0.093–0.087 → historical low.
---
🚀 Bullish Scenarios
1. Conservative (Breakout Buyer):
Entry: Daily close above 0.29197
Stop: Below 0.26511
Targets: 0.33037 / 0.37526
Potential reward: +35% to +54% from current levels
2. Aggressive (Buy the Dip):
Entry: 0.217–0.199 demand zone
Stop: Below 0.199 (bullish invalidation)
Targets: 0.265 / 0.292 / 0.330
Attractive R:R potential (>1:3) if demand holds
---
⚠️ Bearish Scenarios
1. Breakdown of 0.199:
Daily close below 0.199 → structure invalidated.
Downside targets: 0.16 → 0.14, and possibly 0.087 (historical low).
2. Rejection at Resistance:
Failure to break 0.292 + formation of a lower-high = possible range or distribution phase.
Price could revisit 0.217 demand zone again.
---
📈 Strategy & Risk Management
Aggressive traders: Buy dips at 0.217–0.199 with tight stops.
Conservative traders: Wait for confirmation above 0.292 before entering.
Risk management: Limit exposure to 1–2% per trade.
Extra confirmation: Watch for volume spikes or bullish candlestick reversals (hammer, engulfing) in demand zones.
---
✅ Conclusion
HBAR is in a critical demand retest. As long as 0.217–0.199 holds, the bias remains bullish, with mid-term targets at 0.33–0.37. A daily close below 0.199, however, would shift momentum bearish and open the door to a much deeper correction.
HBAR offers a high R:R opportunity for both aggressive dip buyers and conservative breakout traders — making it one of the setups to watch closely in the coming weeks.
#HBAR #HBARUSDT #Hedera #Crypto #TechnicalAnalysis #PriceAction #SwingTrade #Fibonacci
Hbarusdtsignal
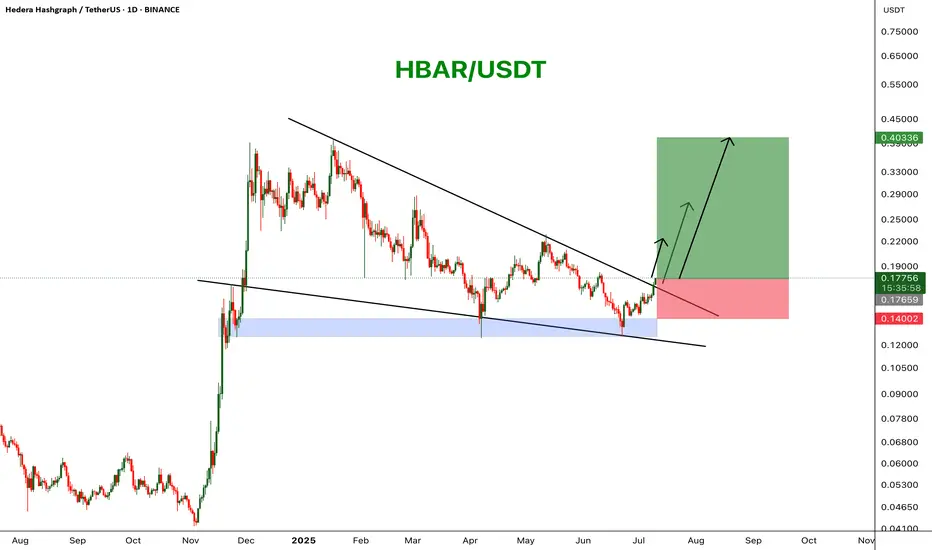
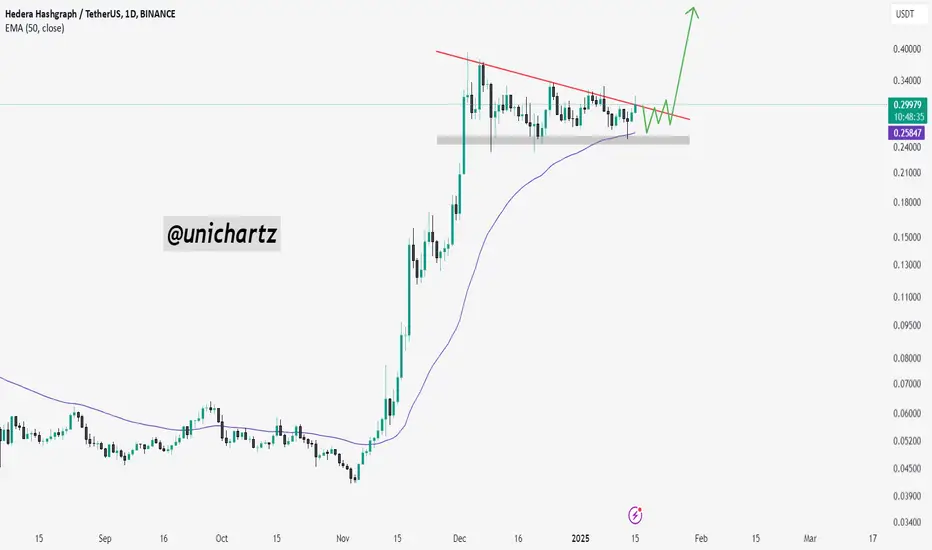
HBARUSDT Wedge BreakoutHBAR has broken out of a falling wedge pattern on the daily chart, signaling a potential bullish reversal. Price is trading above a key support zone and is pushing through descending resistance with strong momentum. A move toward higher targets seems likely if the breakout holds.
Resistance 1: $0.22
Resistance 2: $0.27
Resistance 3: $0.40
Stop Loss: $0.14
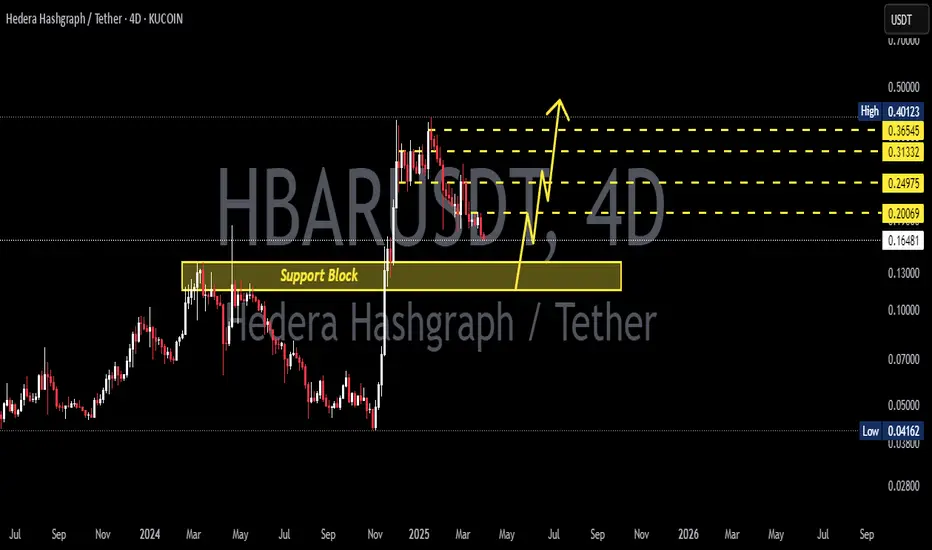
HBARUSDT 4D AnalysisHBAR ~ 4D Analysis
#HBAR This is the closest support for now. Buy if you still have faith in this coin with a short term target of at least 15%+ from here.
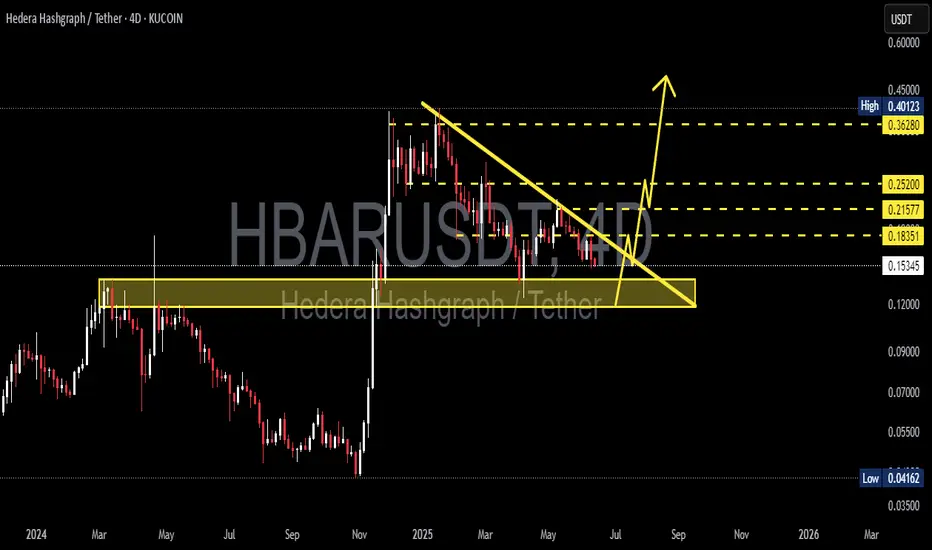
HBARUSDT 4DHBAR ~ 4D Analysis
#HBAR The next goal is very clear, this will re -test this support. buy gradually from here with a short -term target of at least 15%+
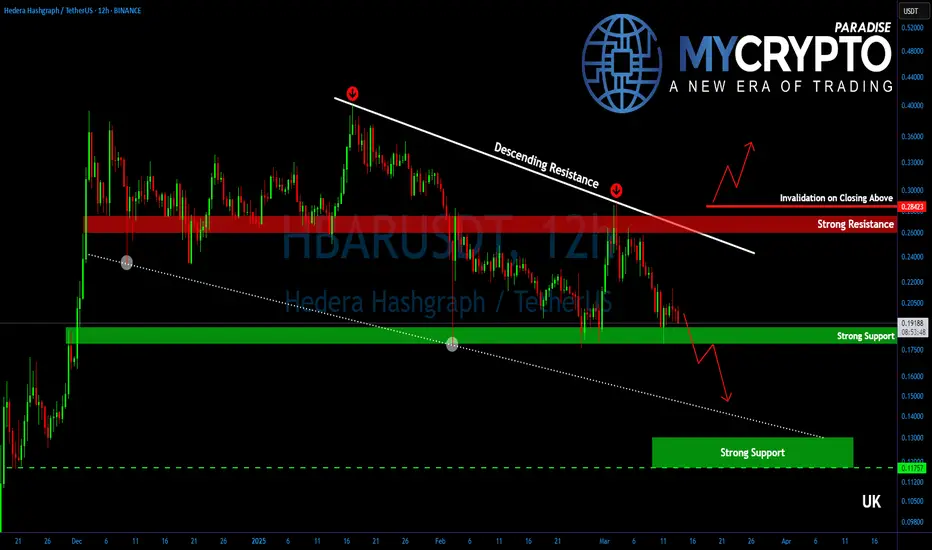
HBAR Hanging by a Thread! A Breakdown Could Be Brutal!Yello, Paradisers! Is #HBAR about to crumble under selling pressure? The charts are flashing red flags, and bulls are barely holding on! Let’s break it down.
💎#HBARUSDT is clinging to a crucial support zone between $0.1900 – $0.1785—a level that has held strong since December 2024. However, with repeated tests, this support is starting to weaken, signaling potential trouble ahead. Sellers are building pressure, and if bulls fail to defend the $0.1750 level, HBAR could face a sharp drop toward $0.1500, where a short-term short-squeeze might offer some temporary relief.
💎However, if selling momentum persists, the decline could extend further, dragging HBAR down to the $0.1300 – $0.1175 zone, where higher time-frame supports are present. This area is more likely to trigger strong short-covering and attract fresh buying interest, potentially setting the stage for a recovery.
💎On the upside, bulls are trapped under heavy resistance at $0.24, with a critical barrier at $0.26 – $0.275. Until this level is broken with conviction, HBAR remains vulnerable to further downside.
Paradisers, as always, patience and precision are key in this market. This isn’t a time for reckless trades—let the levels guide you, trade strategically, and stay disciplined.
MyCryptoParadise
iFeel the success🌴
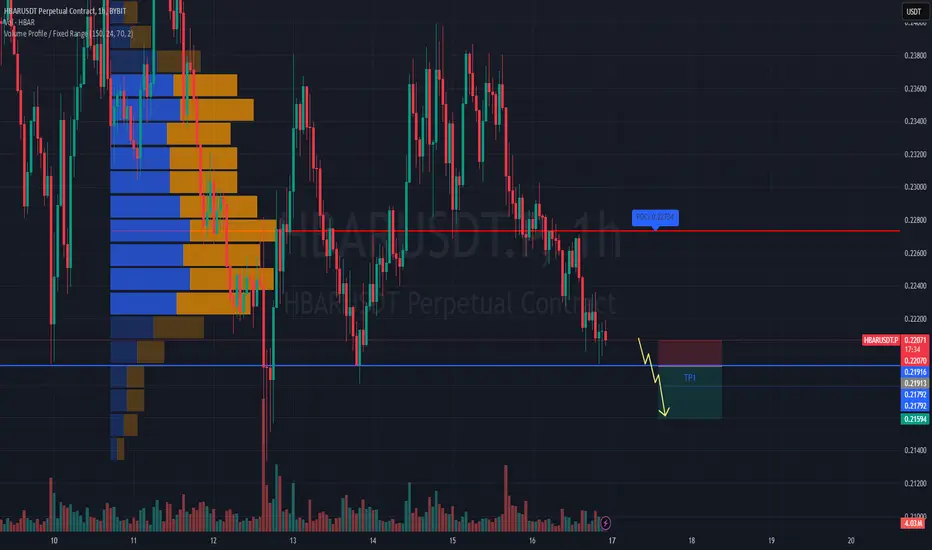
#HBARUSDT remains under seller pressure—expecting further declin📉 SHORT BYBIT:HBARUSDT.P from $0.21913
🛡 Stop Loss: $0.22070
⏱ 1H Timeframe
✅ Overview:
➡️ BYBIT:HBARUSDT.P continues trading in a downtrend, staying below the key level of $0.21913, which could act as a short entry point.
➡️ POC (Point of Control) is positioned above the current price, indicating strong liquidity and selling pressure.
➡️ The price failed to hold above $0.22070, reinforcing the bearish scenario.
➡️ If local lows are broken, further downside movement is expected.
⚡ Plan:
➡️ Enter short below $0.21913, confirming the bearish momentum.
➡️ Risk management via Stop-Loss at $0.22070, placed above the nearest resistance.
🎯 TP Targets:
💎 TP1: $0.21792
🔥 TP2: $0.21594
🚀 BYBIT:HBARUSDT.P remains under seller pressure—expecting further decline!
📢 BYBIT:HBARUSDT.P is showing weakness in the market. If the price breaks below $0.21913, increased selling momentum may lead to $0.21792 – $0.21594. However, if the price rebounds above $0.22070, a short-term recovery could occur.
HBAR/USDT Approaches Apex: Bullish Breakout Ahead?HBAR/USDT is currently trading within a bull flag pattern and approaching the apex. A potential bullish breakout may be on the horizon.
The price has faced multiple rejections from the descending trendline but has consistently found strong support at the lower support zone. Keep an eye on the price action for a possible upward move.
DYOR, NFA
HBAR / USDT : Retest in progress, pump imminent HBAR/USDT: Retest in Progress, Pump Imminent 🚀
HBAR/USDT has successfully broken out of its key resistance zone and is now retesting the breakout level 🔄. This retest phase is crucial and could confirm the start of a strong bullish trend 📈. With momentum building up, a significant pump might be on the horizon.
Key insights:
1. Breakout confirmed: HBAR/USDT has cleared a critical resistance level, indicating strong buyer interest 💥. The ongoing retest could establish this level as a new support zone, paving the way for a bullish rally 🚀.
2. Volume support: Watch for increased trading volume during the retest and the next upward move to confirm sustained bullish strength 🔥.
3. Bullish momentum: Indicators like RSI and MACD are showing positive trends, signaling potential upward continuation ⚡.
Steps to validate the pump:
Monitor the retest: Ensure that the price holds above the breakout level on the 4H or daily timeframe ✅.
Look for bullish candlestick patterns, such as engulfing candles, as confirmation of a successful retest 📍.
Volume confirmation: A surge in volume after the retest can indicate strong buying pressure 📊.
Be cautious of a failed retest or a fakeout, as these could lead to short-term pullbacks ⚠️.
Risk management strategies:
Place a stop-loss below the retest zone to protect against unexpected reversals 🔒.
Adjust position sizes to match your risk tolerance and trading plan 🎯.
Set realistic profit targets and monitor for signs of weakening momentum as the price rises 🔍.
HBAR/USDT is gearing up for a potentially explosive move, but patience and discipline are key. Stay vigilant and wait for confirmation before taking action 📊.
Disclaimer: This analysis is for educational purposes only and not financial advice. Always DYOR before making investment decisions.

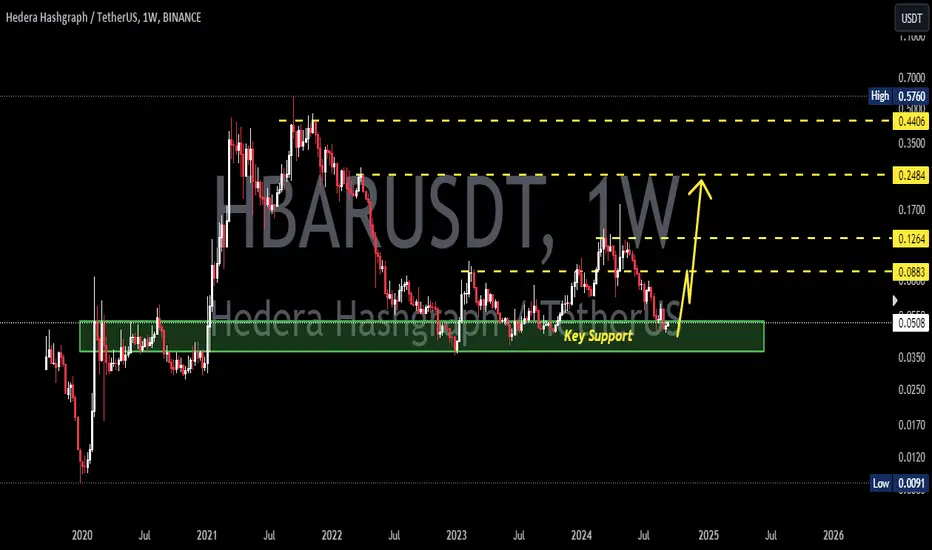
HBARUSDTHBAR ~ 1W
#HBAR Price again retested this key support. If you have Conviction on this Token, This is the right time to start accumulation.

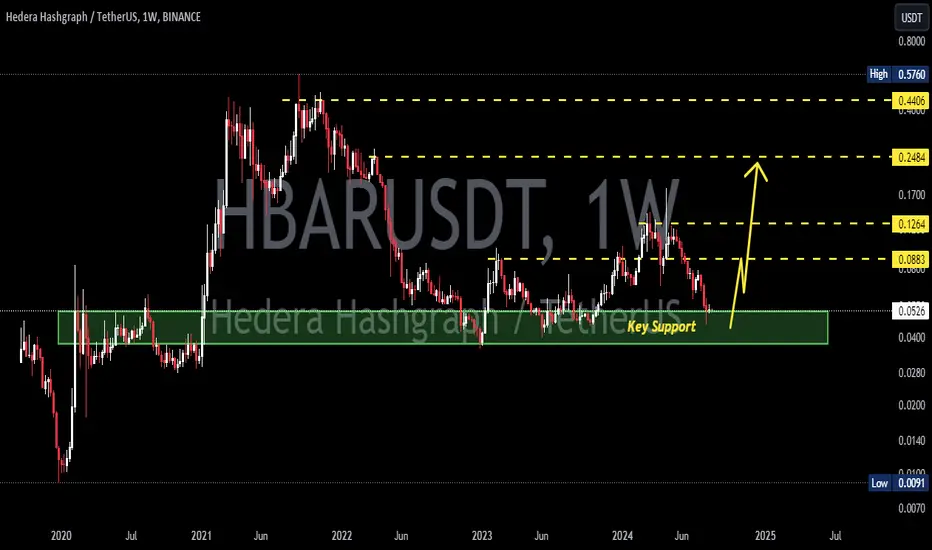
HBARUSDTHBAR ~ 1W
#HBAR Price again retested this key support. If you have Conviction on this Token, This is the right time to start accumulation.
HBARUSDT 1WHBAR ~ 1W
#HBAR Price again retested this key support. If you have Conviction on this Token, This is the right time to start accumulation.
HBARUSDTBINANCE:HBARUSDT SHORT IDEA
⚠️Note:
In this type of signals, only the entry point and trade direction are specified, and stop loss and target are not determined.
If you are interested in entering these signals, please provide a stop loss and a logical market-based target.
⛔"Daily crypto market analyses I provide are personal opinions & not financial advice. Trading carries risks, so do your own research & seek advisor's help.#DYOR"
Don't forget to like and comment
HBARUSDTBINANCE:HBARUSDT SHORT
⚠️Note:
In this type of signals, only the entry point and trade direction are specified, and stop loss and target are not determined.
If you are interested in entering these signals, please provide a stop loss and a logical market-based target.
⛔"Daily crypto market analyses I provide are personal opinions & not financial advice. Trading carries risks, so do your own research & seek advisor's help.#DYOR"
Don't forget to like and comment

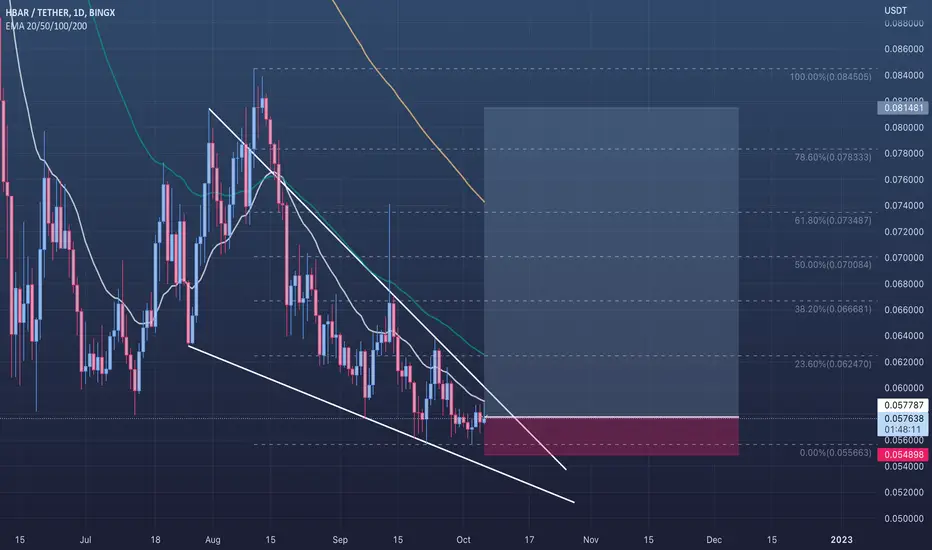
🟢 HBARUSDT - 1D (06.10.2022)🟢 HBARUSDT
TF: 1D
Side: Long
SL: $0.054898
TP 1: $0.062470
TP 2: $0.066681
TP 3: $0.070084
TP 4: $0.073487
HBAR looks bottomed here and the only way is up. Buy and hold to end of the year.