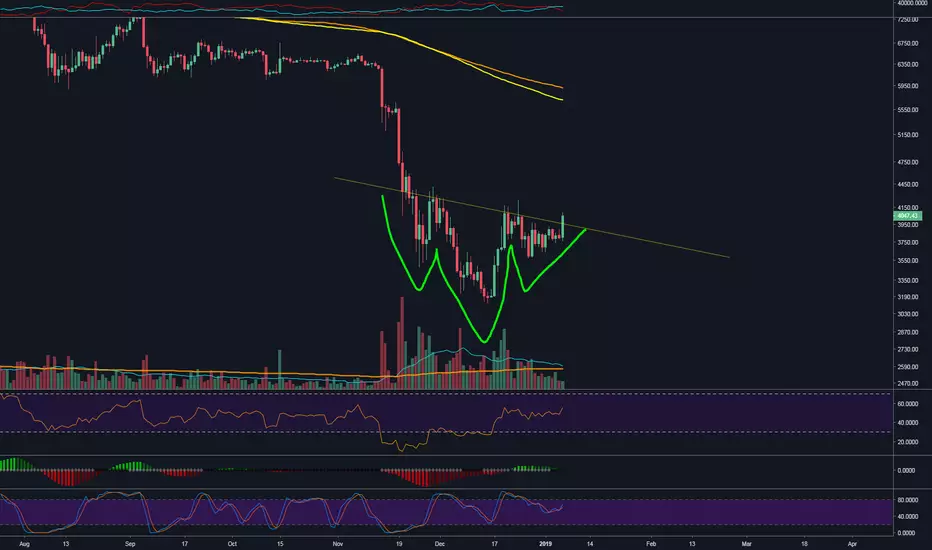
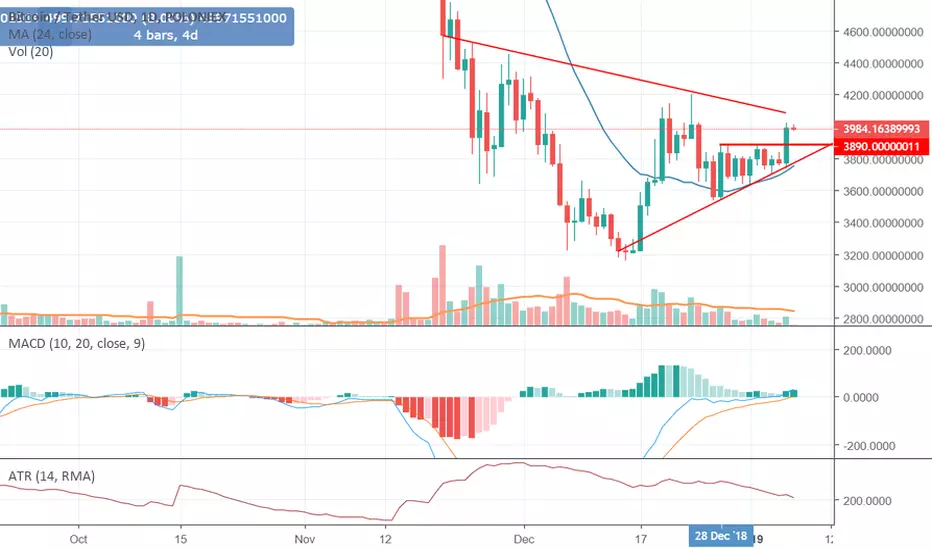
BTC: Possible inverted H&S in the makingBTC likes those head and shoulder patterns. Because traders like this pattern, especially the inverted head and shoulder type.
However, we should remember how often this pattern has failed in the past months. So many times, there was an inverted H&S structure in the making, and many times, it failed. It looked as if it would burst through the neckline, just to fail in the last minute, and dump.
We are finally approaching the interesting levels that I have been mentioning since weeks and weeks now.
1. The lower logarithmic downtrend resistance connecting the ATH and the 6500 level where the last big dump started.
2. The higher logarithmic downtrend resistance connecting the multiple smaller tops since early 2018, with the 6500 area. This is the stronger of the two.
3. At the area of the upper downtrend resistance (around 4900USD right now, in 1-2 weeks at 4700-4800USD), we also have the upper weekly BBand and the daily MA200.
4. The number of daily transactions is still far away from ATH: www.blockchain.com
Therefore, if the inverted H&S fails, it will bounce off the lower resistance, the low will therefore also be lower, around 1800 USD.
If the inverted H&S succeeds, we might see a nice rally to the upper resistance, as high as 4800 USD. But this resistance is ultra strong, and BTC is very overbought on weekly, volume still low, no capitulation has yet occured.
Still too many weak hands in BTC, and too many people claiming 3200 has been the bottom. No despair yet! Also, the number of transactions, which I consider one of the strongest metrics for BTC, is still far away from ATH.
All this leads me to believe, that in the best case, BTC reaches 4800, then dumps down to 2400 USD. I see these two scenarios unfold in the coming weeks.
I see almost no chance (of course the chance is not 0%, but still quite low) for BTC going through both resistances, as sorry as I am.
After that final shakeout, we should see a very strong weekly volume bar. Then the low could be confirmed and finally real reversal can start to happen.
The momet of truth comes nearer and nearer :) Good luck!
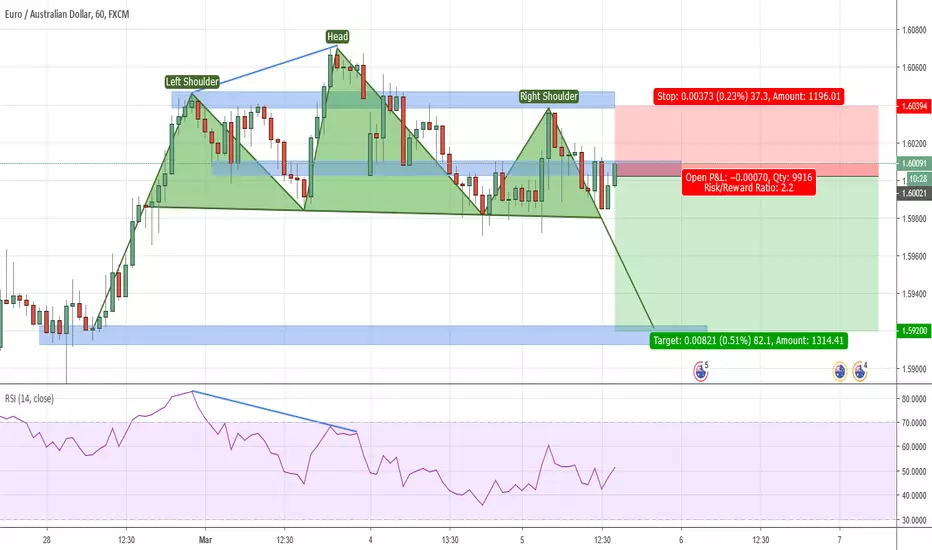
HEAD

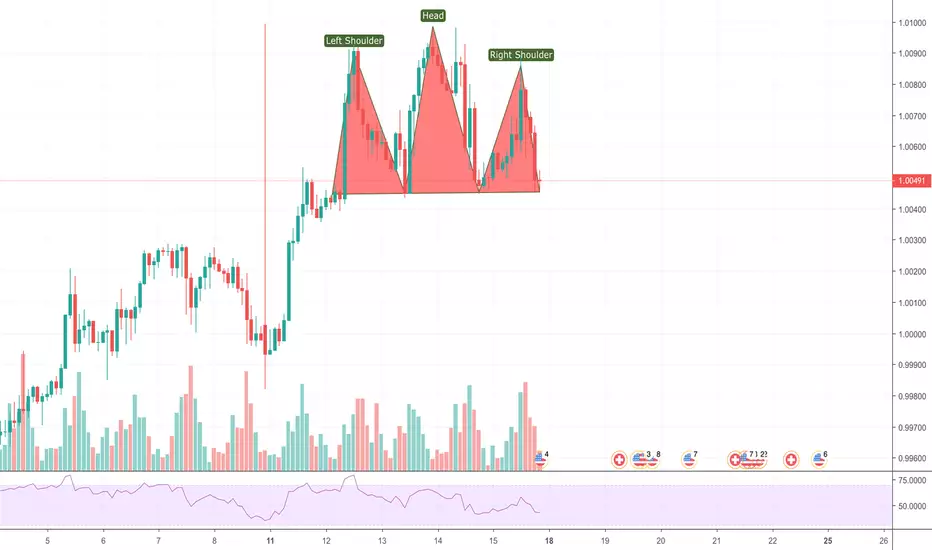
EURAUD1. head and shoulder patttern
2. price is near of daily resistance zone
3. RSI shows Bearish Divergence.
4. risk to reward is 1:2
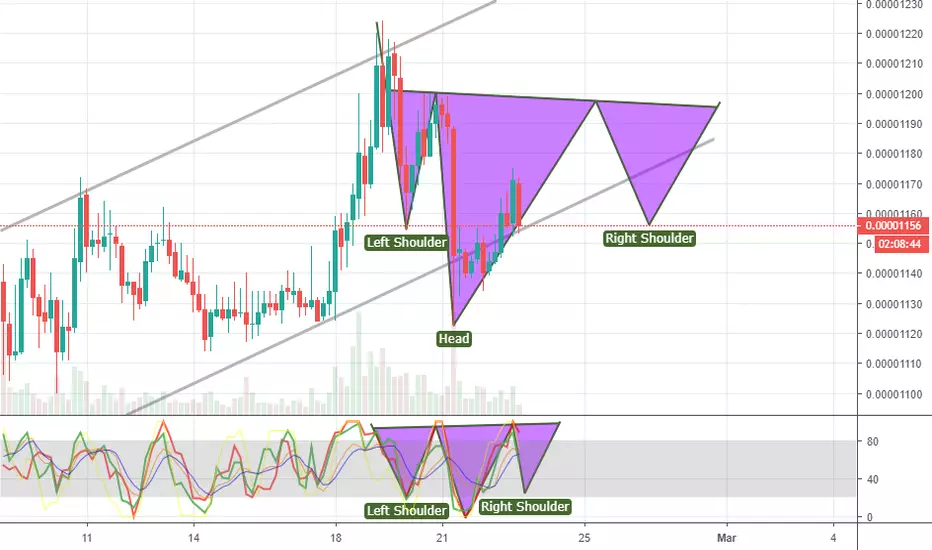
ADABTC Make Inverse Head And Shoulder Pattern In 4 Hour Chart ADABTC Make Inverse Head And Shoulder Pattern In 4 Hour Chart In Binance Exchange Ada Look Bullish
USDCHF Head And Shoulders formed?Not great in spotting H&S yet. We did have some bullish sentiment in the market and now formed this, that seems to fit in the plan of a H&S.
The shoulders are not higher than the head (the difference is not that great) but the neckline fits in quite well.
When the markets open tomorrow I expect to get an answer on the Idea Title.
Thanks for reading and please give me some feedback on this one.
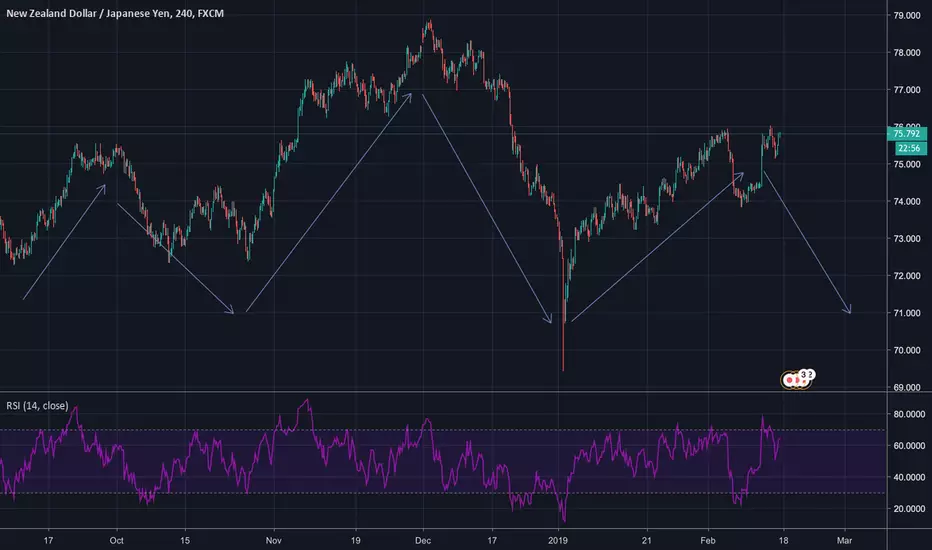
NZDJPY - Sell on H4NZDJPY finishing the last Shoulder. RSI on Overbought, which means the trend will be respected.
This is a long term trend. My guess would be to go short for between 2 weeks and 1 month.
Potential Head and Shoulder on NZDCADConfirmed break below neckline sets up a nice move down to target area indicated

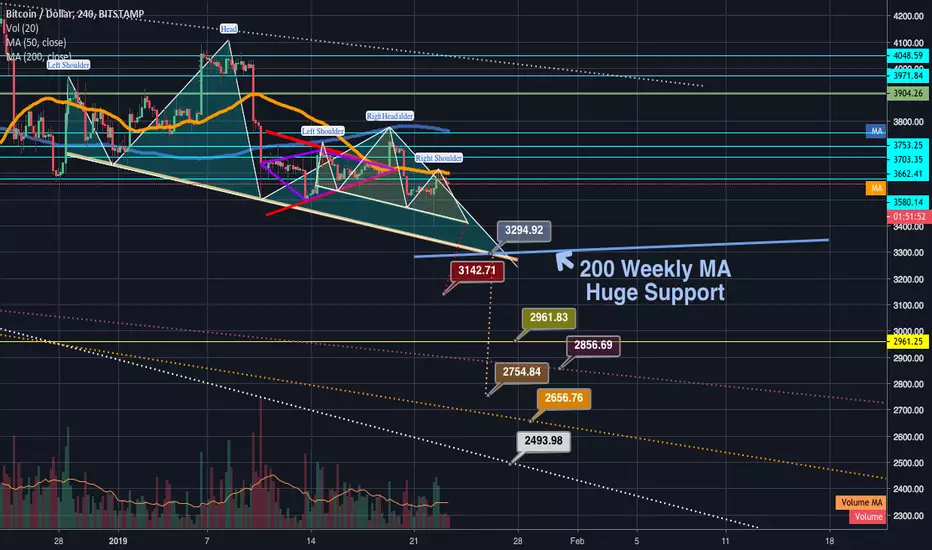
Potential 4hr chart falling wedge confluence w/ h&s drop targetThe current price action is starting to form a potential falling wedge on the 4hr chart...interestingly enough the apex of that potential falling wedge is at the exact same point as the drop target from the 4 hour chart head and shoulders pattern we recently broke down from. I find that confluence very interesting and something that gives more credence to this four hour wedge being legitimate. However with such a big support line as the weekly 200ma just below I'm not gonna be trying to do any limit sells or even shorts here because that support could easily bust us up out of this pattern logn before it reaches the wedge apex/h&s drop target. For this reason this idea will be left neutral.
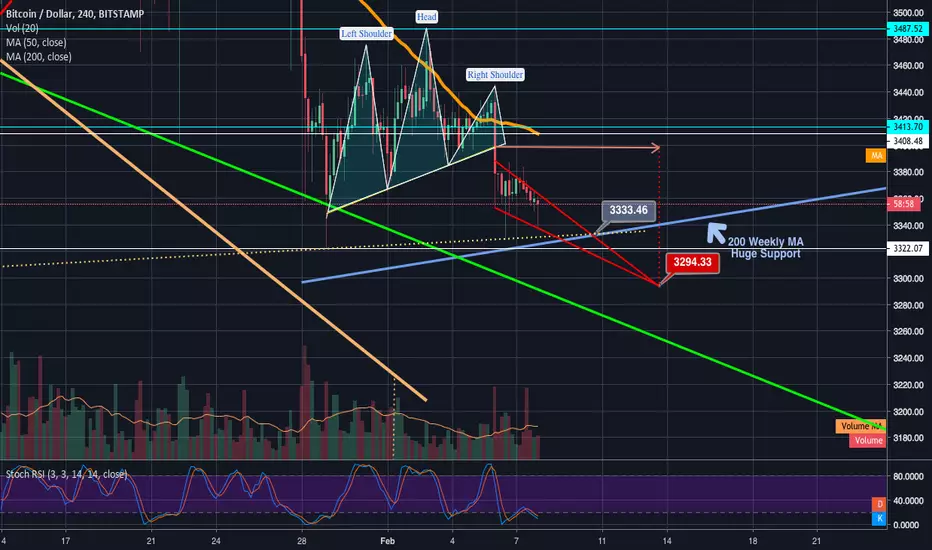
Possible head and shoulder breakdown here...Target 3290Leaving this idea neutral but leaning more short....the head and shoudler pattern on the 4hour chart appears to be triggering a breakdown. We may need a follow up 4 hour candle to confirm this so a fakeout is still possible...but if confirmed we have a drop target of $3290. Of course there is the massive weekly 200ma support just above it that could rpevent thee breakdown to reach its full target were a breakdown to be validated...so watch for a bounce there should it be validated. Odds are good it will be triggered however as we are already seeing lots of volume on this candle. Probability favors a breakdown more so than a fakeout at this point.

GOLD SellHead and shoulders forming, already traded the smaller head and shoulders within the bigger one now forming.

WTICOUSD Buy - Daily Dear Trader,
as you can see on the Daily Chart there is a head and shoulders and the Target as mentioned on the chart.

XRP Triggers 1hr IH&S pattern breaks up out of Falling WedgeAs expected XRP has busted upward form its inverted head and shoulder pattern on the 1 hour chart. The breakout target of that should have been right at the top trendline of the 4hr chart falling wedge but the price action has exploded well above that and seems like it will very likely trigger the falling wedge breakout as well. So now the price target we are looking for next is 39 cents. We are quite overextended on the stochrsi though so we may consolidate sideways in a bull flag first before continuing upward to the 39 cent target. The current 4hr volume candle is absolutely massive which is a great sign for the bulls. Expect exciting fundamental developments from xrp in the coming days/weeks.

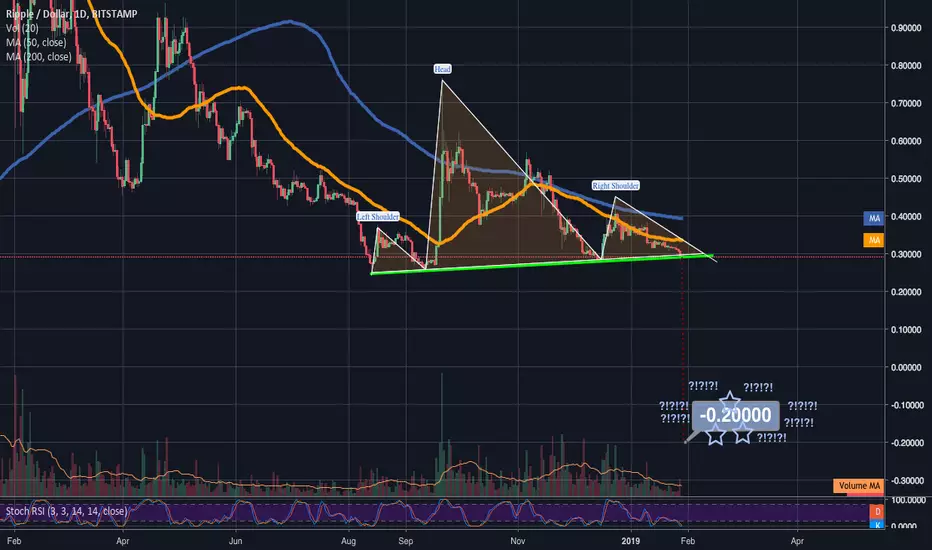
A Wedge In Shoulders Clothing.H&s that braks down to negative 20 cents or a falling wedge thatha sa breakout that isn't a negative number...I'm siding with the falling wedge on this one.
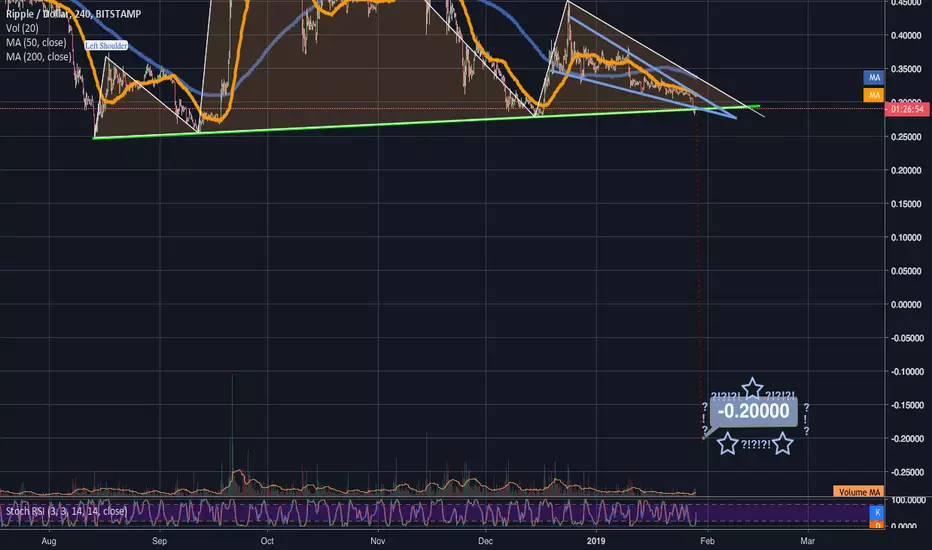
Smells like a fakeout…Looks like a fakeout…Is that the fakeout?Here on the XRPUSD 1day chart we have a pattern of a massive head and shoulders on xrp formed conveniently during a downward trend with a breakdown target of negative 20 cents. The Stoch RSI also bottomed out and is ready to travel upward again so there's not enough bearish momentum available to warrant such a breakdown. The downtrend makes it very unlikely a good head and shoulders because the h&s chart patterns that get validated are usually ones that act as reversal patterns at the top of trends not continuation patterns.Sure there are rare exceptions of when a continuation h&s happens but in reality those are just failed patterns that didnt trigger in my eyes. Still with it looking so obviously like a fakeout it makes one wonder if the whales are trying to fake us out with a fake fakeout...thats the only way I see something like this triggering. On the bitfinex chart this pattern is invalid but It appears to be valid for now on bitstamp,coinbase,and kraken. Its for this fake fakeout fakeout reason that I leave this idea neutral....but with a breakdown target of negative 20 cents, it seems like a ridiculous notion to believe it ever could be anything other than a fakeout.
Huge H&S got rejected by resistanceResistance in BTC proving bulls are standing their ground. Expect a push up to 4k levels

Bottom very near. One more final breakdown?A temporary short idea here but the target of this drop could be one of 7 potential targets shown here. To play it safe I am going to be setting a limit buy up right buy the 1 week 200ma(shown here in sky blue) it is conveniently lined up right with the neckline of the larger head and shoulders pattern so I anticipate the price action could attempt a head and shoulder breakdown fakeout and then have the 200 week moving average bounce the price action back up thereby essentially double bottoming off the 200 weekly MA coupled with the last bounce it did off of it at our most recent low and we could see a big bounce from there. However if the 200 weekly ma doesn't hold..I see 6 more potential big support zones here that I have linked and labelled with corresponding color price target boxes accordingly. I plan to limit buy the 200ma and buy the dip on each additional target it drops to..so even though this idea is short on the long term I'm very bullish.
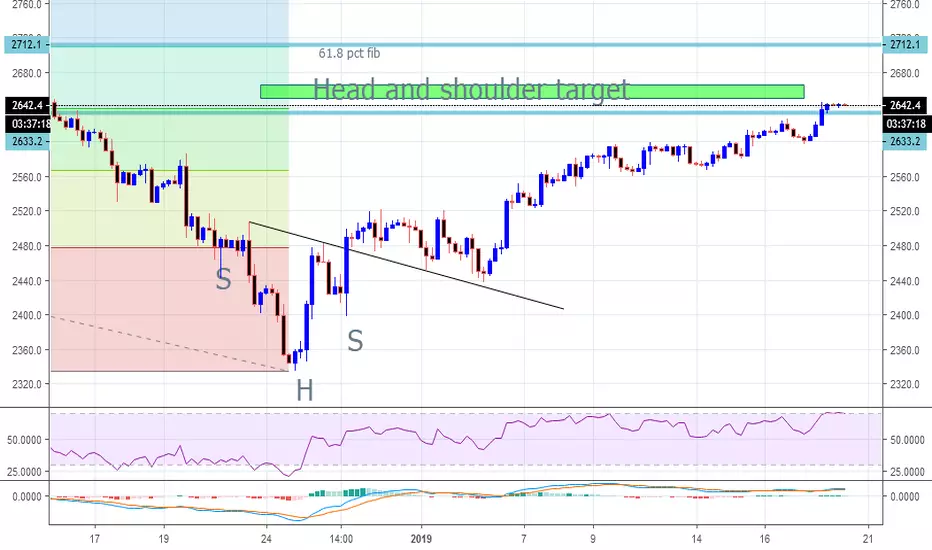
SPX500 selling areaAs per the chart we should be seeing selling pressure anywhere between the head and shoulder target and the 61.8pct retracement from the S + P all time high from 2018.
USDMXN long Head and shoulders forming on usdmxn, has hit a long support and is also breaking the downtrend, good risk reward ratio

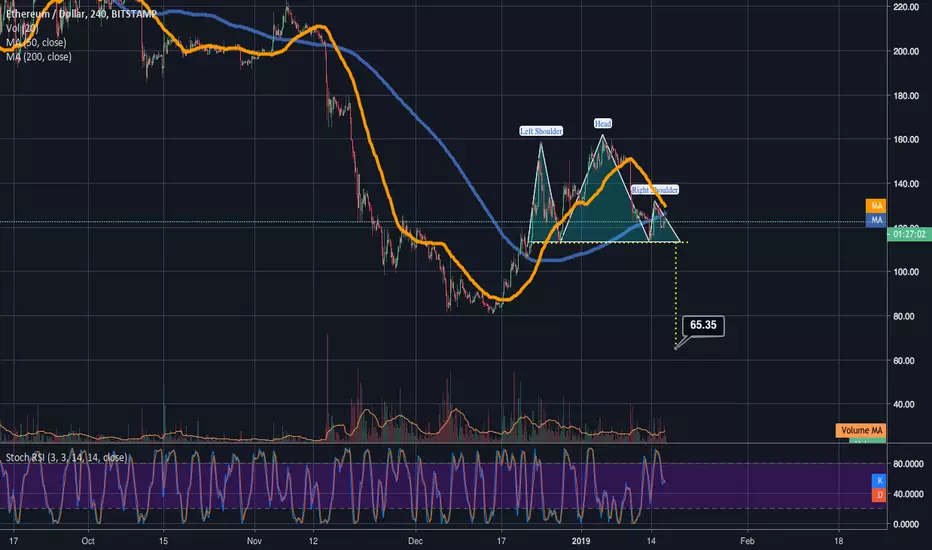
Ethereum close to completeing 4hr h&s + 4hr deathcrossthis idea is gonna remain neutral for now because fakeouts are always a possibility in crypto but we can see we are about to potentially complete a right shoulder on a very ugly looking head and shoulder pattern on ethusd's 4hr chart....we can also see that the 4hr chart is once again quickly approaching a 4hr deathcross....xrp had its 4hr death cross which led to downside followed by bitcoin which just had its and seems to be leaning towards more downside so if ethereum also gets a 4hr deathcross I'm guessing more downside is very probable...looking left on our chart we can see what kind of downside came with the last 4hr death cross...it wasn't pretty so should this 4hr deathcross occur here I think it is very very likely we will see ethereum trigger this head and shoulders breakdown which could potentially send it all the way down to $65 if this happend hopefully that will mean that the bottom of the bear market is very very near. Of course a sudden huge green candle could prevent all of this so be prepared for a fakeout around the neckline as always. It is that possibility that has me leaving this idea neutral instead of marking it as short.
Verge on the precipice of an inv h&s golden cross combo breakoutI did not mark this idea long or short....we are simply on the precipice of either a huge bullish move for verge or a massive bulltrap fakeout. if btc breaks upward then xvg will likely trigger this inverted head and shoulder breakout which would lead to a golden cross on verge on the 1 day chart which has a breakout bull target of an over 50% increase, but if bitcoin breaks down it will be both a fakeout of the inverted head and shoulder pattern and likely the golden cross as well
see the blue line directly above the inverted head and shoulder pattern? thats the 1 day 200ma and we can see it already dealt a firm rejection to the priceaction earlier so which always increases the likelihood of a fakeout..not wise to buy verge here unless you see a breakout that flips the 200ma from resistance to support and also solidifies it as support as well if that happens and you see bitcoin have a bullish breakout too then its probably wise to enter a position on verge but until then expect a fakeout. Inverted head and shoulder patterns in a bear market are usually patterns painted by the bearwhales to set the ultimate bulltrap fakeouts with *not financial advice but simply self advice that anyone else is allowed to consider* thanks for reading!

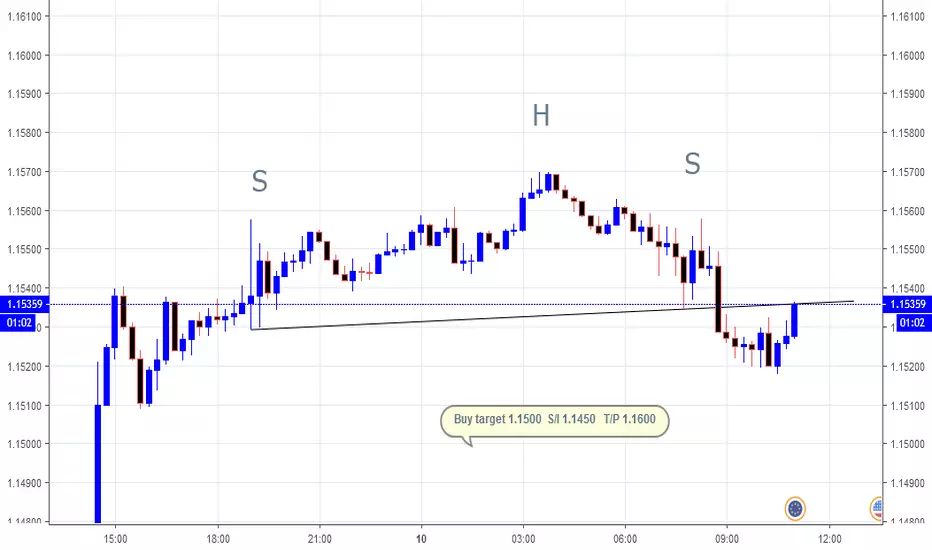
EUR/USD BUYHaving broken above 2 month consolidation pattern its time to look for buy opportunities. This head and shoulders on the 15 min chart may be our buy in point. The RSI and MACD show divergence on this time frame which makes me think this pattern could come good.
The SHS measure take us to just below 1.1500
The S/L at 1.1450 allows enough room for institutional stop hunting to take place without knocking our trade out.
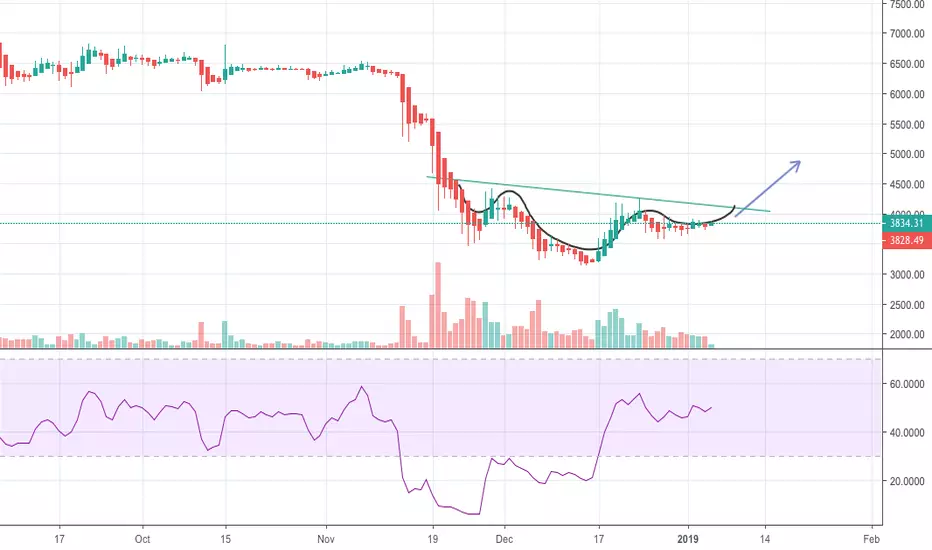
Bitcoin Inverse Head and Shoulders.There is a solid looking head and shoulders pattern forming on the BTC-USDT daily chart. already had a minor breakout from the ascending triangle pattern setting us up for a good rise in price if the price action manages to break the neckline of the H&S pattern.
SHAMPOOOOOOOO!Hey guys,
Looks like we have a potential inverse H&S breakout to me. Just need some more volume to seal the deal. (Yellow line is the neckline, green outlines inverse H&S pattern)
Lemme know what you think.