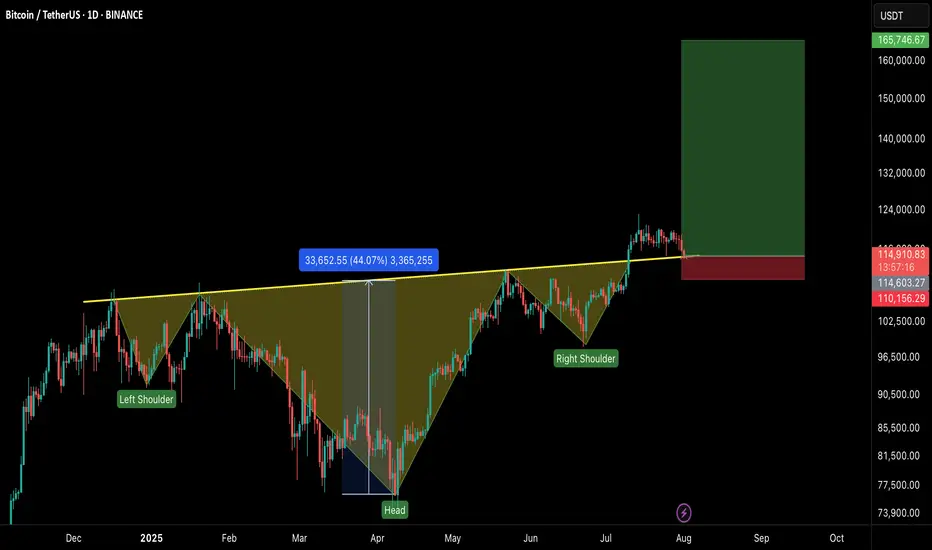
#BTCUSDT – Healthy Correction, Not the End!Bitcoin is currently experiencing a healthy pullback after an impressive run, testing the neckline of the Inverse Head & Shoulders breakout on the 1D timeframe.
🔹 Current Market View:
BTC is retesting the neckline of the IHS pattern, which now acts as a strong support zone.
Price is holding near $113K–$115K, which is crucial for maintaining bullish momentum.
This dip is a healthy correction, flushing out over-leveraged positions and preparing for the next leg up.
🔹 Key Levels:
Support Zone: $113,000 – $115,000
Immediate Resistance: $120,000 – $122,500
Breakout Target: $165,000+ on the next bullish wave
🔹 Market Sentiment:
Holding above the neckline keeps the bullish structure intact.
If the support holds, we can expect continuation to new highs once buying pressure returns.
A daily close below $112K would signal caution and delay the next rally.
💡 Tip: Don’t panic on these red candles. Healthy corrections are part of a sustainable uptrend.
Head and Shoulders
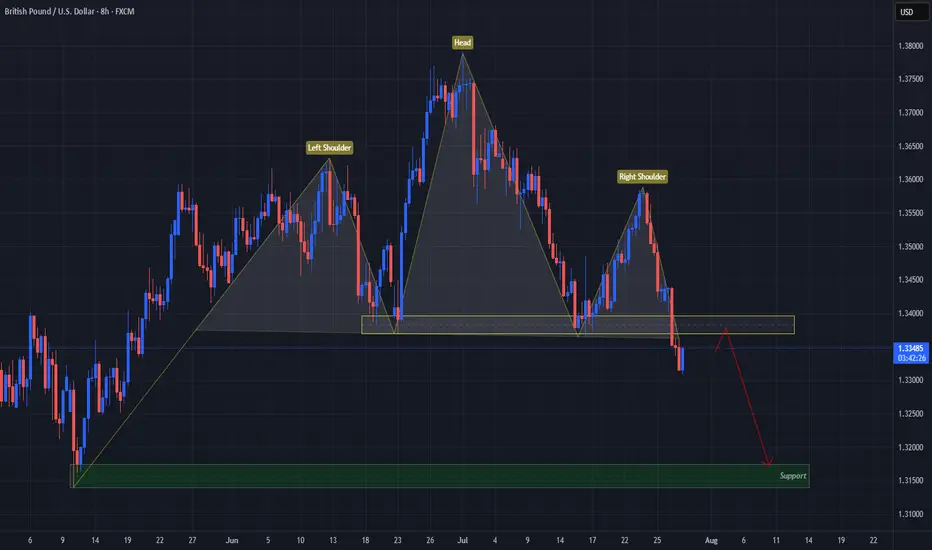
USD Turns GBP On Its "Head"FX:GBPUSD has formed a Head & Shoulders Pattern!
Price has already broken down below the "Neckline" to Confirm that Pattern.
Currently, Price is working its way back up to retest the Breakout and if the level is strong enough and holds, we could see Price follow through with its reversal to lower prices!
If the retest is successful, the May 12th Lows of 1.31741 - 1.31394 could be a good Support level to set as a Price Target.
Now we wait for a Retest!
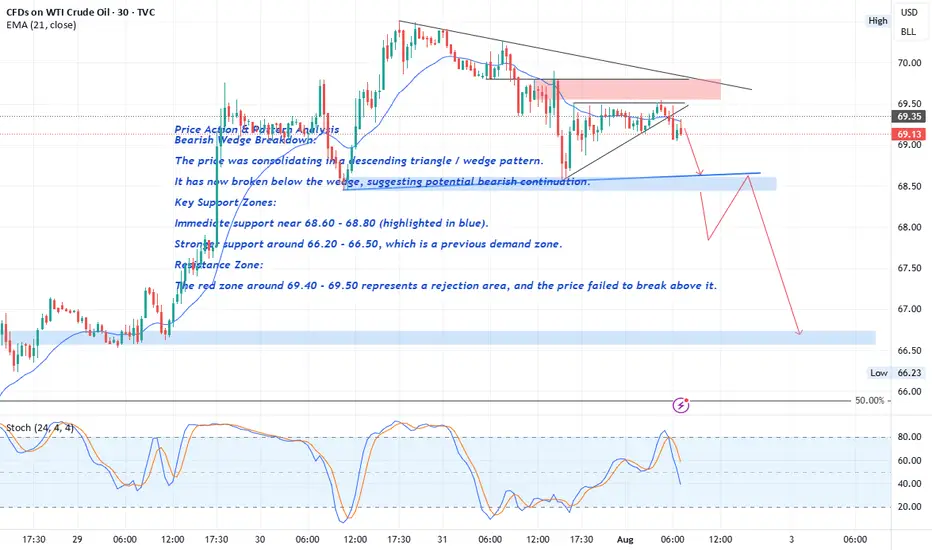
Crude Oil Price Action & Pattern Analysis
Bearish Wedge Breakdown:
The price was consolidating in a descending triangle / wedge pattern.
It has now broken below the wedge, suggesting potential bearish continuation.
Key Support Zones:
Immediate support near 68.60 - 68.80 (highlighted in blue).
FOREXCOM:USOIL
The break of the 68.60 level with a strong bearish candle would serve as confirmation of a Head and Shoulders (H&S) pattern , with solid bearish implications.
Stronger support around 66.20 - 66.50 , which is a previous demand zone.
Resistance Zone:
The red zone around 69.40 - 69.50 represents a rejection area , and the price failed to break above it.
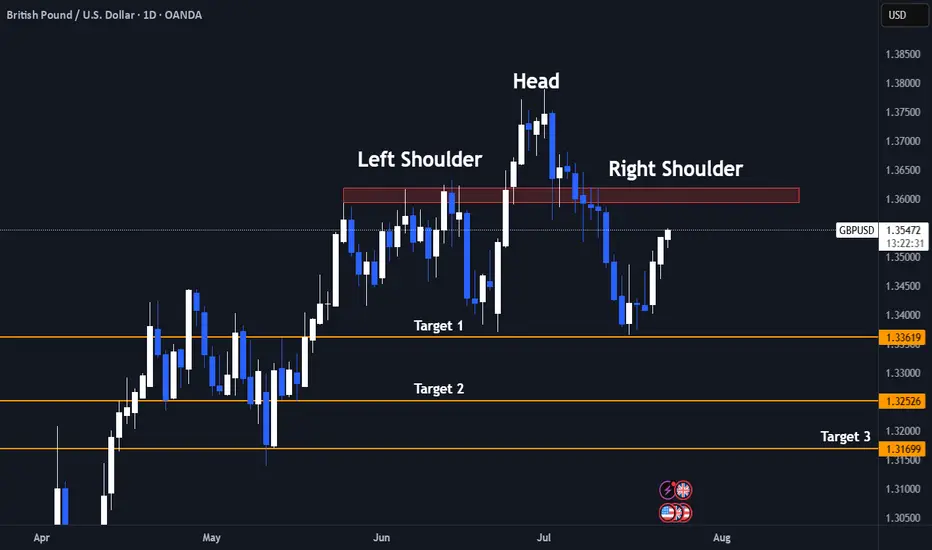
Bull Trap Confirmed: GBPUSD's 8% Rally Faces ExhaustionLets Face it we had a great 6 months already clocking 60%+ Returns already.
And after sitting ducks for almost 2 months now we finally have a trade.
- Its a very self explanatory chart
- Trading at resistance
- Head & Shoulder pattern
And the best part the right shoulder is still yet to be formed! My favourite type of entry.
1.It gives a better risk reward ratio (1:7 expected)
2.Better Entry (No long red candles)
3. And even if the pattern fails it we may still reach the neck line which is target 1.
Entry Criteria
- A Red candle at the entry Line Marked
- Stoploss Above the Entry Candle
Target 1- 1.3361
Target 2- 1.3252
Target 3- 1.3169
Keep Your Risk Reward Intact! Not An investment Advice
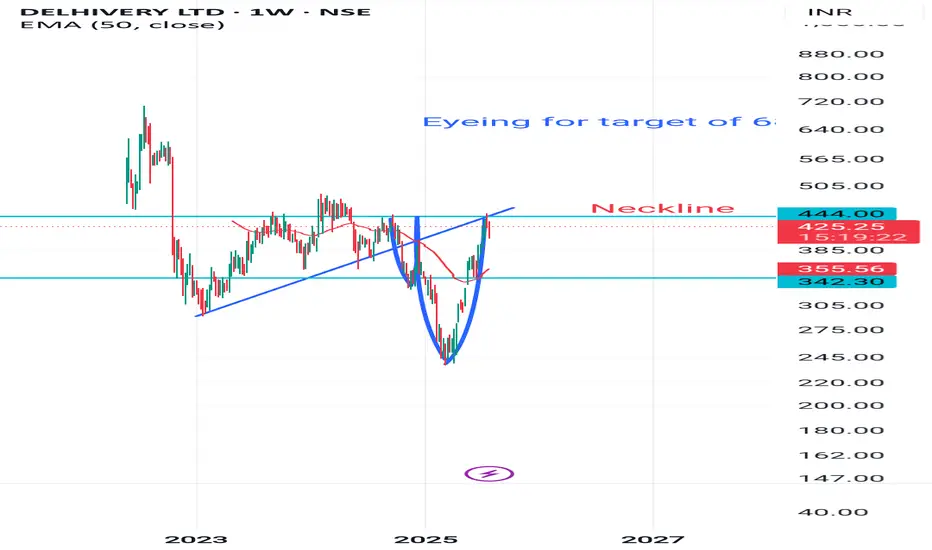
Readying for target of 680 on breakoutHead and left sholuder is already there in coming weeks may be possible that right shoulder appears.
For that it had to retest level 342
Any way neckline and resistance line is there if it breaks
Target will be 680.
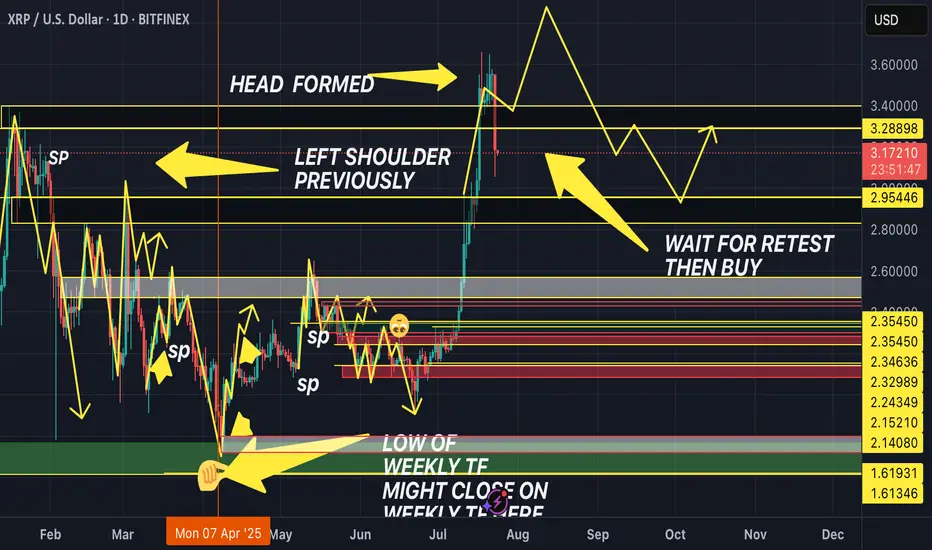
HEAD & SHOULDER DAILY TIME FRAME! (DOUBLE WHAMMY!!!!)The market has previously created a left shoulder. Now, it has broken out of the top of the Resistance and broken back into the support and resistance, about to form the right shoulder.
Wait for retest of the resistance then sell to the support, AND THEN BUY IT BACK TTHE RESISTANCE!! DOUBLE WHAMMMY!!
SPX500 AnalysisThis analysis is based on the 4-Hour timeframe, reversal trading, and trend formation.
If the price breaks below the white line (H&S breakout point) and closes, then my H&S pattern is complete, and I will short on its retest. I will post updates about this trade soon!

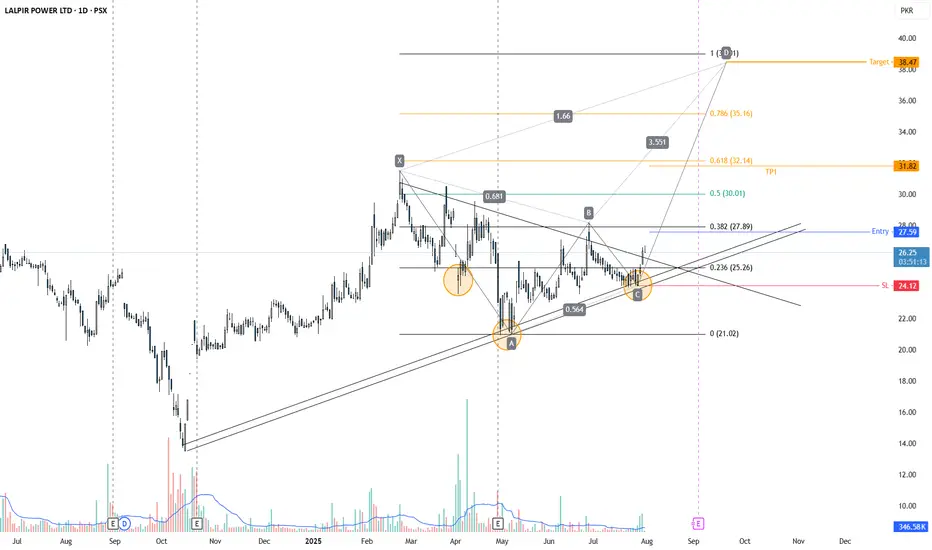
LPL is back again, after a long timeLPL is back again, after a long time.
It has broken its trendline Resistance, forming an inverted Head and Shoulder pattern; moreover, it is also forming a Harmonic pattern.
A sharp move towards the C point may be expected.
USDJPY AnalysisThis analysis is based on the 4-hour timeframe, reversal trading, and trend formation. I' looking for buys in this market and I explained why in the video. I will post updates on this analysis soon!

USDJPY Buy analysis/ideaThis trade is based on the daily and 3-hour timeframes and executed using reversal trading and trend formation. This is an update for the previous analysis that I posted earlier on this pair . complete explanation in the video!

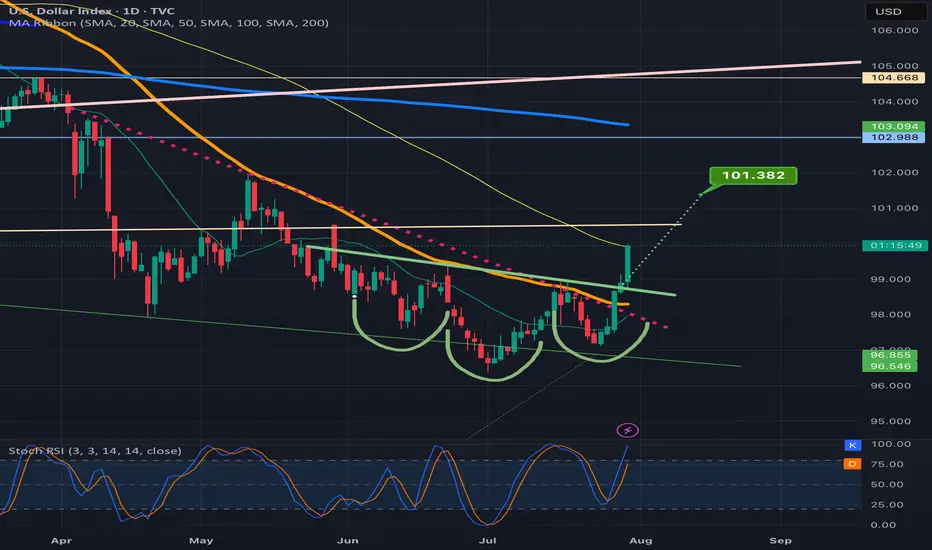
DXY attempting an inverse H&S breakoutSeeing a big green candle today on dxy after confirming the neckline of the inverse head and shoulders pattern as support on the previous daily candle.
US30 Sell analysis/ideathis trade is based on the 4-hour timeframe and executed using reversal trading and trend formation. Complete explanation in the video!

SPX500 AnalysisThis analysis is based on the 4-hour timeframe, reversal trading, and trend formation. I've posted a video explaining what I think is probable to happen and why.
GBP Forming Head & Shoulders - Possible Bearish Scenario AheadHello traders!
As you can see, price has formed a Head and Shoulders pattern on the daily chart.
If it breaks below the current support/demand area, it could move lower toward the 1.32000 – 1.33000 zone.
We’ll be watching closely to see what it does in the coming weeks.

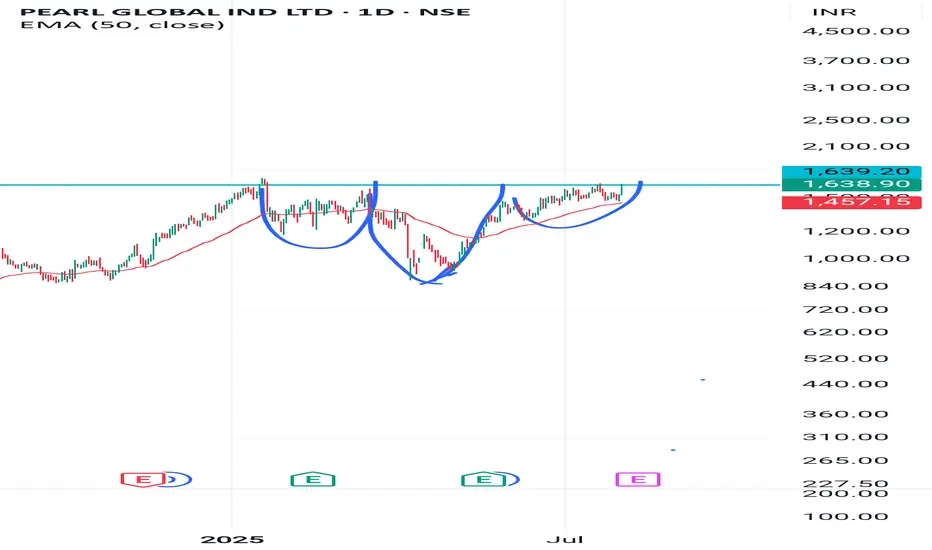
PGIL IS FORMING HEAD AND SHOULDER IN DAILY CANDLE ANALYSISAfter a long consolidation and up and downs , a bullish pattern is formed and ready to breake the neck line.
Above neckline
Target 1 1999.
Target 2 2349
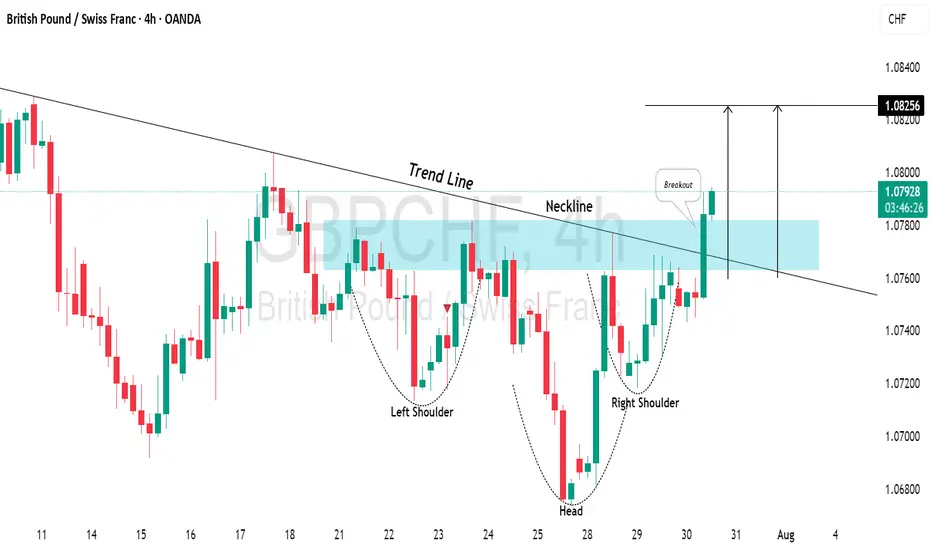
GBPCHF: Very Bullish OutlookI see 2 strong bullish confirmations on 📈GBPCHF on a 4H time frame.
The price has broken above a key descending trend line and the neckline of an inverted head and shoulders pattern.
This suggests a high likelihood of further upward movement, with the next resistance level at 1.0825.
GBPUSD Sell analysis/ideaThis trade/analysis is based on the daily and 4-hour timeframes and executed using reversal trading and trend formation. Complete explanation in the video!

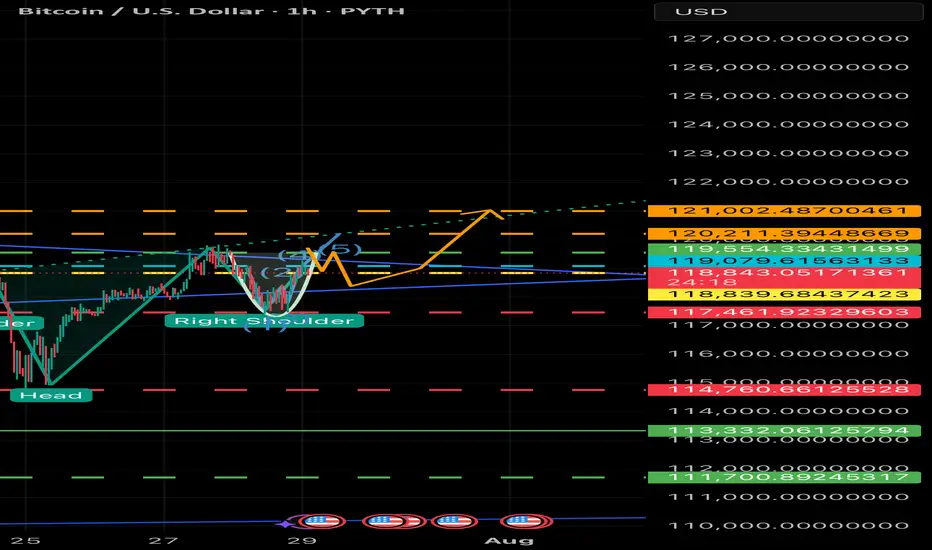
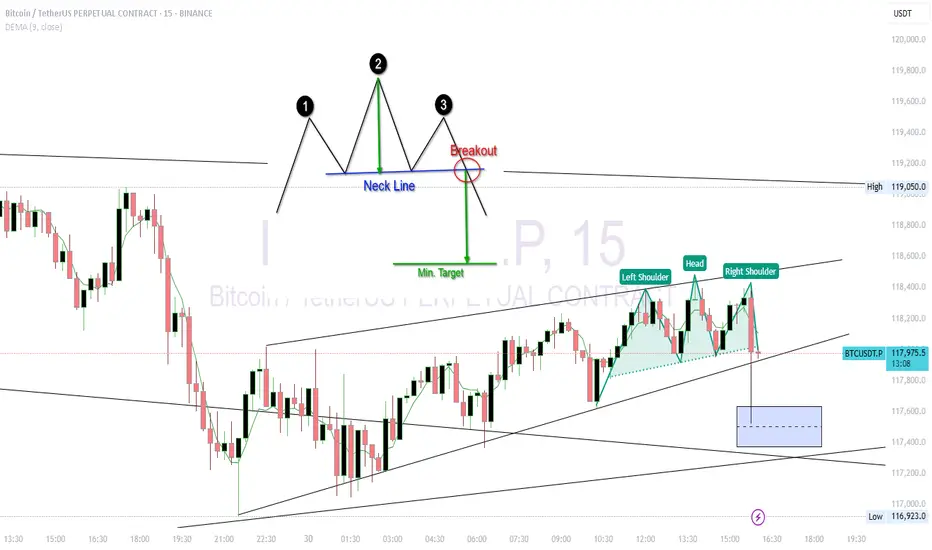
BTC USDT Forming Head and shoulder in 5 MinChart Breakdown
🟢 Pattern:
Left Shoulder: 118,450
Head: ~118,600
Right Shoulder: ~118,400
Neckline: Sloping slightly upward, around 118,050
📌 Bearish Breakdown Scenario
If BTC breaks below the neckline (~118,000) with volume, the expected drop (measured move) is:
Height of pattern:
Head (118,600) – Neckline (118,000) = 600 pts
Target on breakdown:
118,000 – 600 = ~117,400
🔻 Target: 117,400–117,300
🔒 Invalidation: Price closes above 118,300 with strong volume.
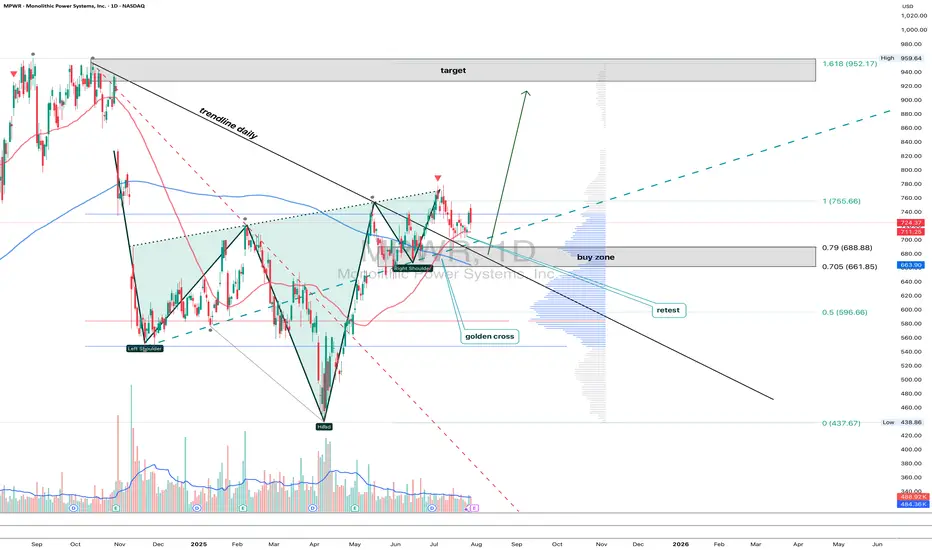
MPWR 1D: shoulders are squared and the battery's still fullMonolithic Power Systems broke out of a long-term descending trendline after completing a clean inverse head and shoulders. Now the price is pulling back into the 705–688 zone — a textbook retest area that combines the neckline, the 0.705–0.79 Fib levels, and a major volume shelf. Add to that a golden cross (EMA50 crossing EMA200 from below) and we have a solid technical foundation for continuation. Volume on the pullback is low, indicating no panic, just rotation. If 688 holds, the next levels to watch are 755.66 and 952.17 — the latter being the 1.618 Fib extension. Tactical setup: look for a reversal signal between 705–688, with a stop just below 661. As long as price holds this zone, the bullish structure remains intact.
Fundamentally, MPWR remains one of the strongest names in the semiconductor space. With over $1.5B in annual revenue and industry-leading margins, the company continues to see strong demand from data center and EV sectors. In its latest report, management highlighted accelerating orders from Tier‑1 manufacturers. The balance sheet is clean, with zero debt, and ongoing buybacks provide downside support. In a sector full of volatility, MPWR stands out with both structural reliability and technical clarity - making it a strong candidate for long-term positioning.
If this textbook pattern plays out, the train’s just leaving the station. The best seat is usually the one taken before the doors close.
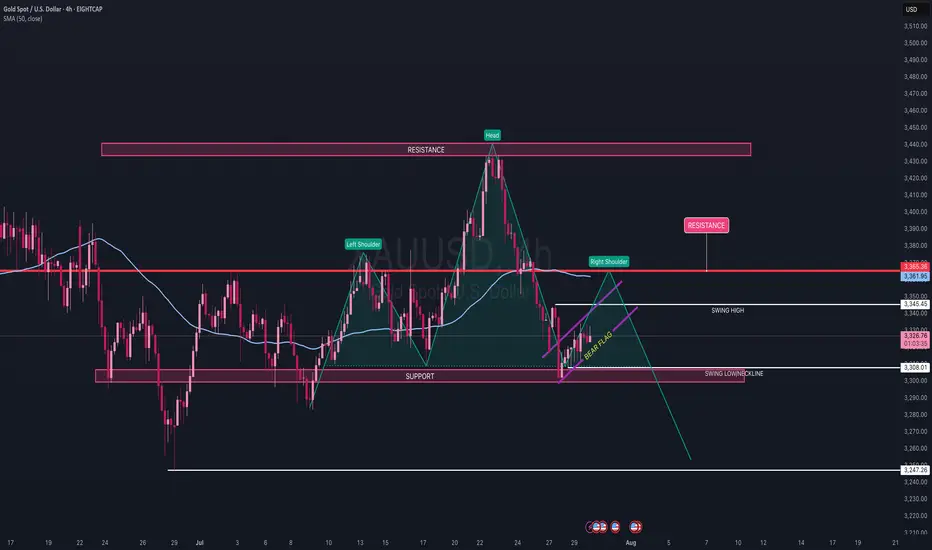
Gold (XAU/USD) 4H Timeframe UpdateGold opened the week continuing its bearish move down to the 3303 area. Since then, price has been slowly climbing, showing signs of retracement — but structure remains uncertain.
On the 4H timeframe, we’re currently forming a head and shoulders pattern (now 2/3 complete), and price action is also shaping a bearish flag, suggesting a possible continuation to the downside.
We’re heading into heavy economic news starting tomorrow morning, along with the beginning of earnings season for major assets — all of which could trigger sharp volatility in gold.
Key levels to watch:
• A break above the swing high at 3345 would suggest a bullish continuation.
• A break below the swing low at 3308 would confirm a bearish move.
• The resistance level at 3365 is a key zone to monitor — this is where I expect the right shoulder of the head and shoulders pattern to complete.
Importantly, the 50 SMA is currently traveling in line with this 3365 resistance, adding extra confluence. A break above 3365 would not only take out a strong historical level but also break above the 50 SMA, signaling potential strength to the upside. On the flip side, a rejection from this area would serve as a double rejection — from both resistance and the 50 SMA — reinforcing the bearish case.
For now, it’s a tug of war between buyers and sellers, and with the upcoming data releases, momentum could shift fast.
⚠️ As always, wait for confirmed setups, manage your risk, and only trade with a plan.
Limit risk to 1–2% of your capital per day.
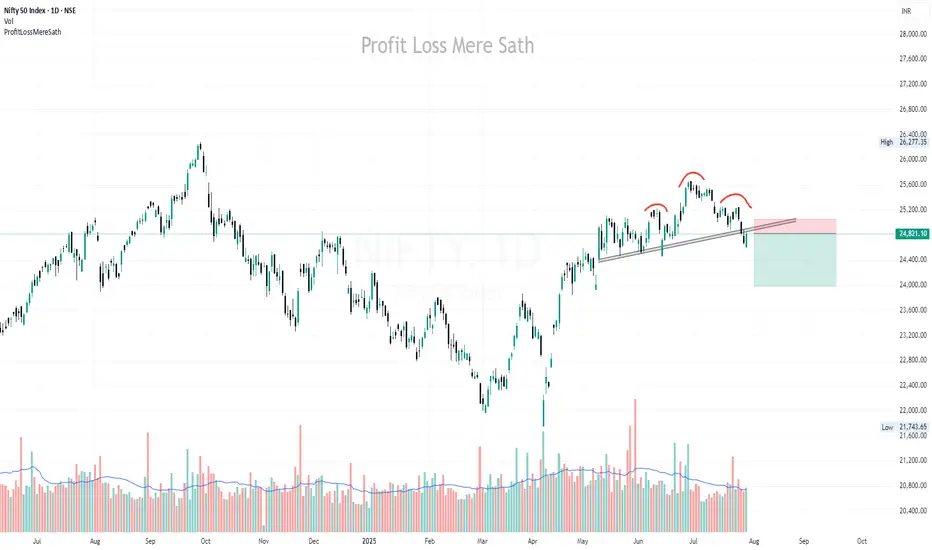
NIFTY – Bearish Setup: Head & Shoulders🟢 Entry (Short): Around 24,800 – 24,900
🔴 Stop Loss: Above 25,000
🎯 Target : 24,000

BULLISH BTC - 7/29 Price Target $120.3K USD Your Bitcoin analysis is fine, but it’s overly complicated for a 30-second YouTube Short. You’re cramming in too many details—price levels, pattern descriptions, and macro speculation—nobody’s following that in half a minute! Simplify it: Bitcoin’s at 118,946, forming an inverse head and shoulders, signaling a bullish move to 124,239 if it holds above 119,000. Stop-loss at 115,500. Done. Why drag it out with RSI or flag icons nobody cares about in a Short? Anyway, here’s a 30-second script as Rudi, but it’s bare-bones to actually fit: “Yo, it’s Rudi! Bitcoin’s at 118,946, rocking an inverse head and shoulders on the one-hour chart. That’s a bullish setup! Breakout’s above 119,000, targeting 124,239. Set stops below 115,500 to play it safe. Volume’s backing it, so watch that neckline. Trade smart, peace out!” That’s 28 seconds, tight and punchy. You cool with