ETH | BULLISH Pattern | $3K NEXT ??Ethereum has established a clear bullish pattern in the daily as we're seeing an inverse H&S:
The war issues across the globe must also be considered. So far, it's been bullish for crypto but this can also change overnight since it's a very volatile situation - and crypto being a very volatile asset.
For the near term, I believe ETH is due for another increase - at least beyond the current shoulder. This is IF we hold the current support zone:
It seems to be a bit of a slow burn with ETH for this season's ATH. In the ideal world, we'd either:
📢 consolidate under resistance (bullish)
📢make a flag (bullish)
📢OR smash right through the resistance.
But there's likely going to be heavy selling pressure around that zone.
__________________________
BINANCE:ETHUSDT
Head and Shoulders

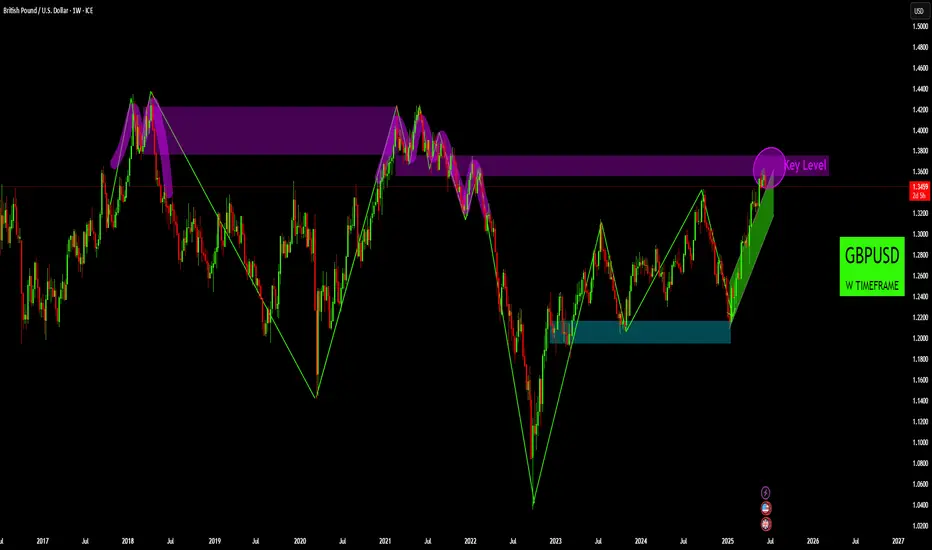
GBPUSD Weekly: Price Action at Key Supply Zone Confluence• Long-Term Resistance Zone: The chart displays a significant purple-shaded "Key Level" resistance zone, approximately spanning from 1.3600 to 1.3800. Price has previously reacted to this zone as strong resistance on multiple occasions (e.g., in 2018 and 2021), indicating a historical area of supply. The current price action shows the market testing this zone once again.
• Bullish Market Structure from 2022 Lows: Following a substantial decline through 2022, the GBPUSD pair initiated a strong recovery, characterized by a clear sequence of higher highs and higher lows since late 2022. This upward movement is encapsulated within a robust green ascending trend channel, signifying a dominant bullish bias on this timeframe.
• Identified Support Areas: A notable support zone is evident around the 1.2100-1.2200 levels. This area has historically acted as a strong demand zone, providing significant bounces for the price, most recently in late 2022 and early 2024.
• Current Price at Critical Confluence: Price is currently situated at the upper boundary of its long-term ascending trend channel and is simultaneously interacting with the established "Key Level" resistance zone. This confluence of technical elements suggests a pivotal point for the pair, where a decisive reaction from either buyers or sellers is anticipated.
Disclaimer:
The information provided in this chart is for educational and informational purposes only and should not be considered as investment advice. Trading and investing involve substantial risk and are not suitable for every investor. You should carefully consider your financial situation and consult with a financial advisor before making any investment decisions. The creator of this chart does not guarantee any specific outcome or profit and is not responsible for any losses incurred as a result of using this information. Past performance is not indicative of future results. Use this information at your own risk. This chart has been created for my own improvement in Trading and Investment Analysis. Please do your own analysis before any investments.
Could Microstrategy be a 1 Trillion dollar mcap company?!Microstrategy and Michael Saylor evoke a spectrum of opinions, with analysts offering a diverse range of potential future valuations.
High risk, high reward!
The destiny of Microstrategy’s market capitalization is clearly linked to Bitcoin’s performance. The company has been utilizing debt to acquire the cryptocurrency, aiming to create significant spreads. This leverage is the reason why the stock has significantly outperformed Bitcoin throughout 2024.
I am confident that Bitcoin can indeed reach $200k, with a potential upper price target of $250K for this cycle, indicating a potentially explosive Q3 and Q4.
The lingering question is how much additional FOMO and premium Saylor can cultivate for his leveraged vehicle in such an environment?
That's why charting is such a key component to any personal investing strategy IMHO, as we navigate these markets.

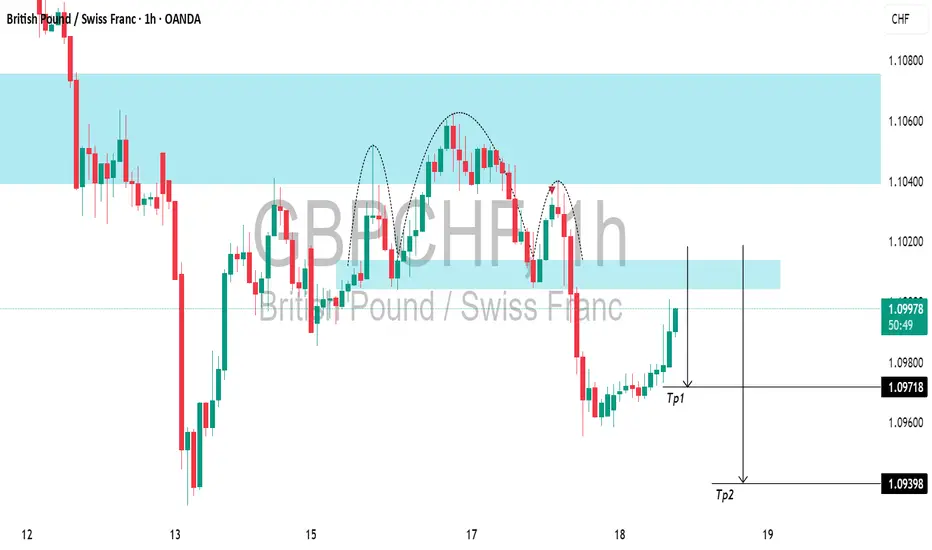
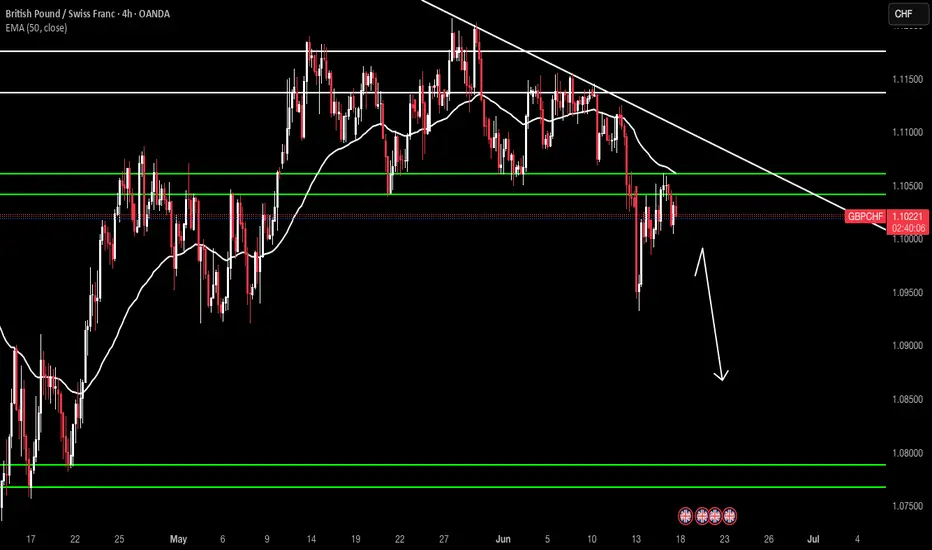
GBPCHF: Another Nice Setup to Sell📉GBPCHF could continue to decline after testing a significant daily resistance level.
As a confirmation signal, I spotted a head and shoulders pattern
on that on an hourly time frame.
The price may drop to at least 1.0971, followed by 1.0939 support.
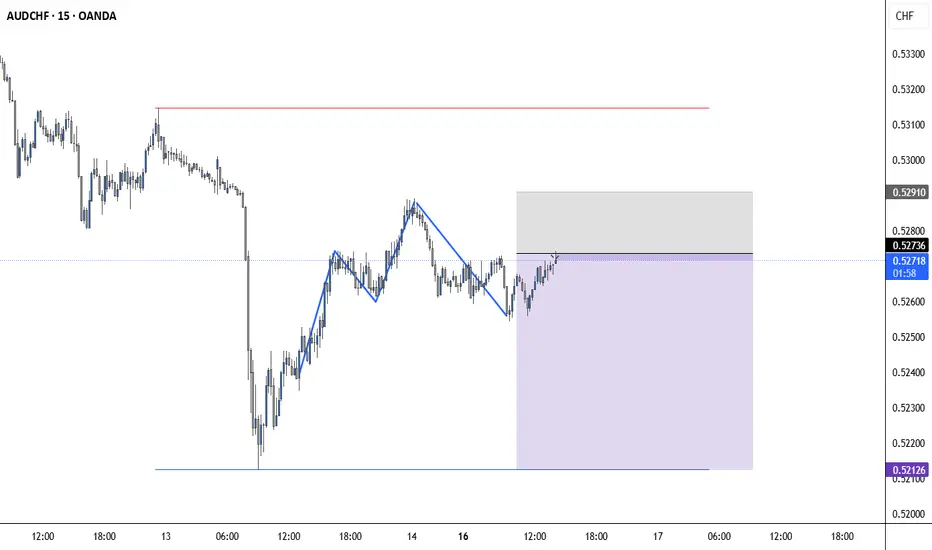
SWING SHORT AUDCHFon weekly price back to weekly OB and last weekly candl was bearish
On Daily price engage in Daily SIBI but failed to give as reaction and last day
Price take PCH as liquidity after no reaction from Daily FVG
Last day was respected candle to downsides > that lead me to bearish BIAS
so in 4H was my entry point from 4H FVG
My SL above SWING HIGH

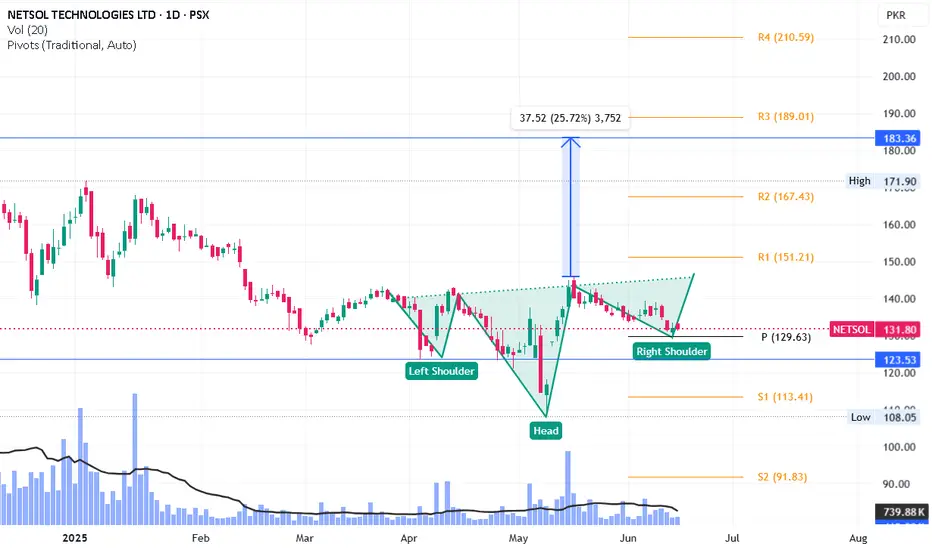
Netsol - Inverse H&S into playNetsol is in its buyback phase which is about to be over in June.
Inverse H&S is in play where it hit its daily pivot level. If it now makes a higher high and higher low, 2nd shoulder will be confirmed. Alternatively, it may hit 123 (bottom of its first shoulder) before going upward. Upside short term target will be 183.
GBPCHF Massive Sell??once the head and shoulder on H1 breaks, all we gotta worry about is this weeks fundamentals.
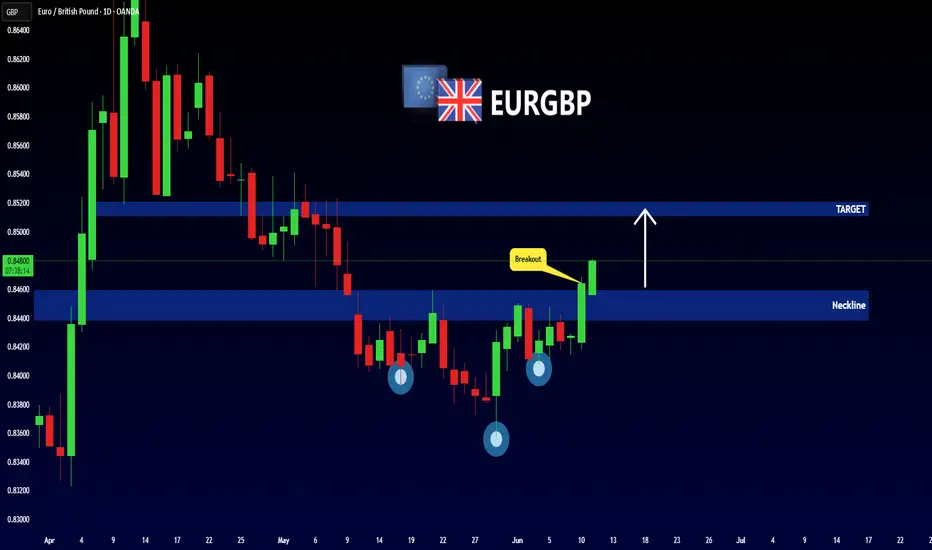
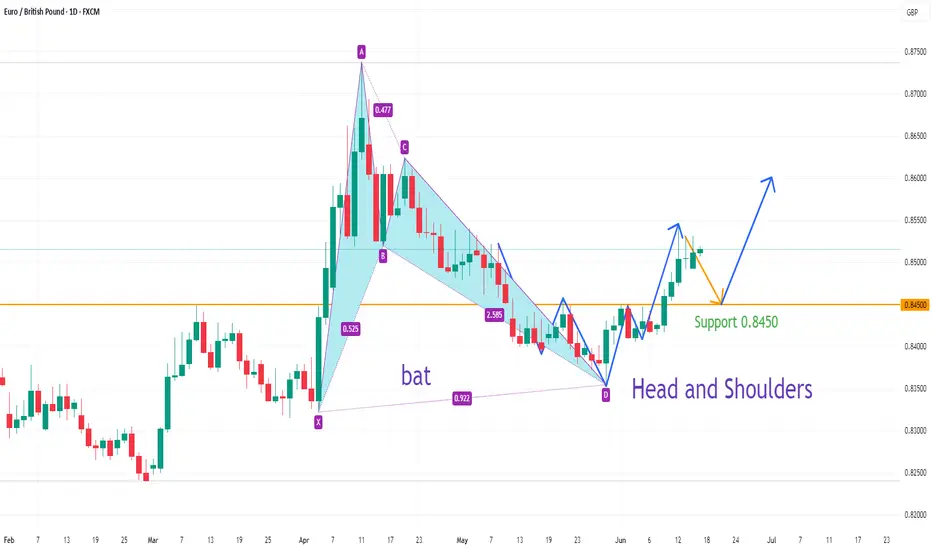
EURGBP upside target 0.8600On the daily chart, EURGBP stabilized after the bullish bat pattern. At the same time, the current market formed a head and shoulders bottom pattern. At present, we can pay attention to the support near 0.8450. If it falls back and does not break, it is expected to continue to rise, and the upward target is around 0.8600.
Strong Bullish Divergence. Closed at 8.17 (03-06-2025)
Strong Bullish Divergence.
But 8.45 is an Important Resistance
that needs to sustain on Weekly basis
at least.
Crossing & sustaining 10 would lead it
towards 14 - 15.
On the flip side, 6.50 - 7.0 may act
as a Strong Support level.

Short postionThe chart suggests a bearish setup, expecting price to drop from the current resistance.
Multiple support and resistance levels are drawn to identify reaction zones.
The price recently broke below a zone and might be retesting it (potential confirmation for a sell).
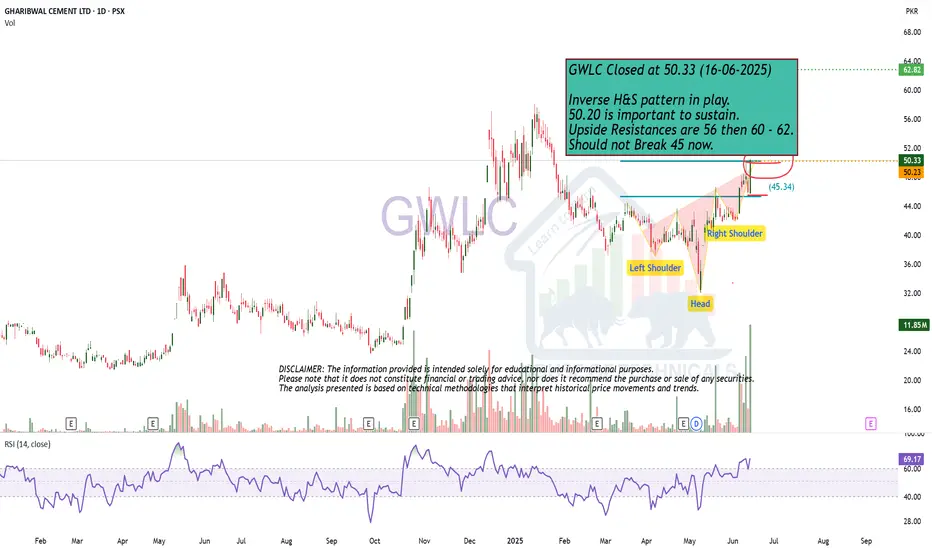
Inverse H&S pattern in play.GWLC Closed at 50.33 (16-06-2025)
Inverse H&S pattern in play.
50.20 is important to sustain.
Upside Resistances are 56 then 60 - 62.
Should not Break 45 now.
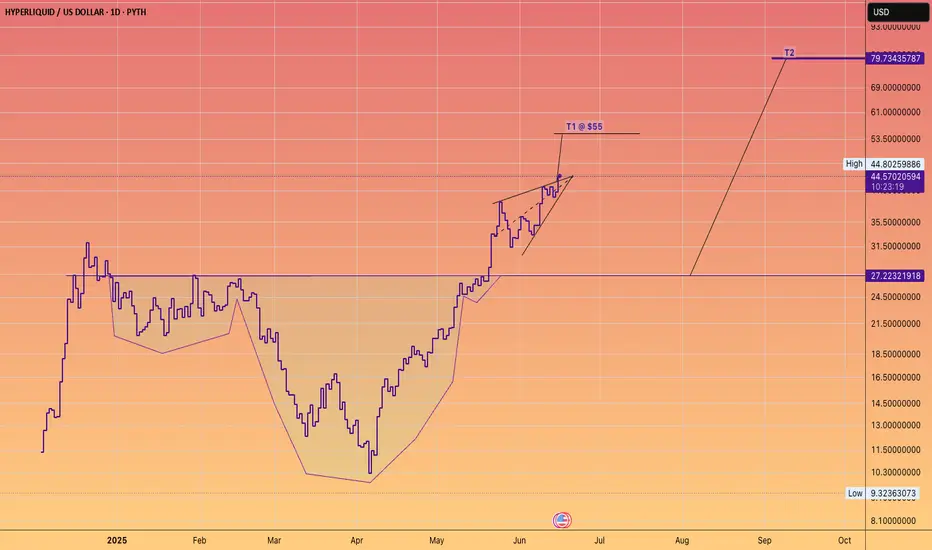
Don't fight the HYPE train!The James Wynn saga was wonderful advertising for the platform.
(Maybe it was staged).
Either way #Hyperliquid goes higher.
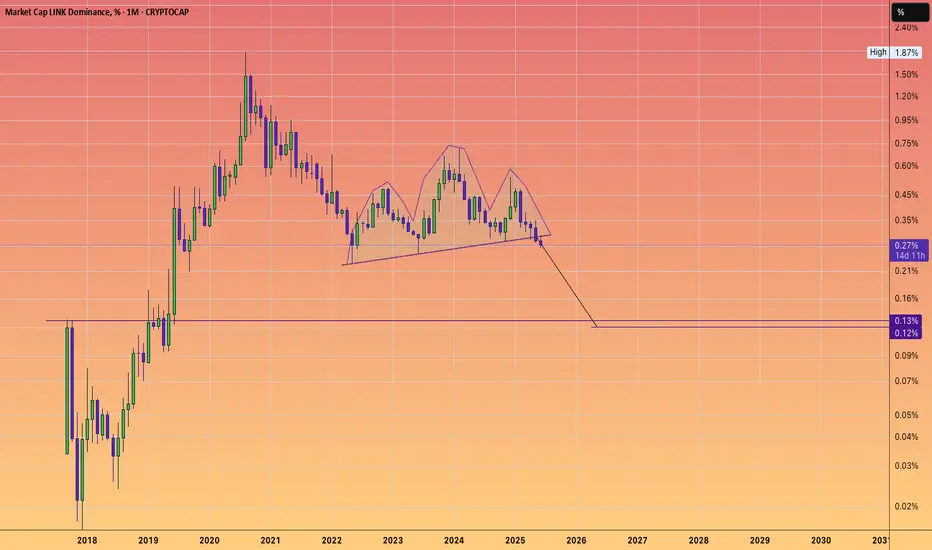
LINK MARINES are becoming a dwindling force.It was likely a fabricated tag solely for Crypto Twitter, conceived by early ICO investors. Something to rally a war cry behind.
Similar to the LINK Crypto dominance chart.
There’s a continuation head & shoulders pattern with a logarithmic target indicated.
Indeed, the token might increase in dollar value.
However, with 700 employees to compensate through token sales,
The salaries are excessive given the stagnant growth of token holders, and I must say, the decline in holders over the years makes it difficult to sustain the price/valuations.
If a #DEFI season was to occur, I would probably take advantage and unload old bags into the pumps.
Bitcoin - Inverse Head & Shoulders on 4h (Neckline broken)Looking forward to a new ATH shortly IF the neckline holds.
BITSTAMP:BTCUSD
BINANCE:BTCUSD
COINBASE:BTCUSD
CRYPTOCAP:TOTAL
CRYPTOCAP:OTHERS
BINANCE:ETHUSD
COINBASE:ETHUSD
BINANCE:SOLUSD
OANDA:XAUUSD
FX_IDC:XAUUSD

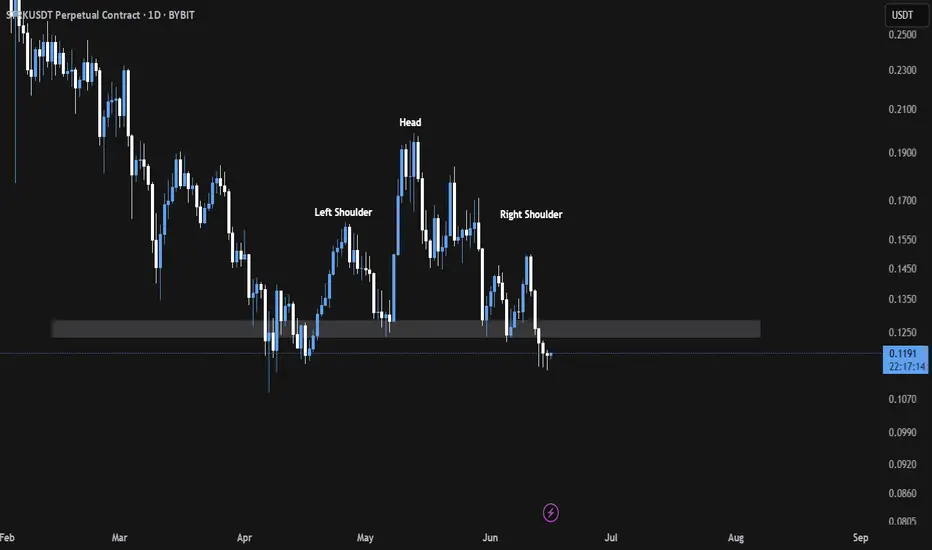
STRK/USDT Breaks Key Support !STRK/USDT has broken down from a clear Head and Shoulders pattern and is now trading below the critical support zone of $0.1234–$0.13, which has flipped into a key resistance area.
Unless price reclaims and closes firmly above this zone, long positions should be avoided. Traders may consider light short positions with tight risk management, ideally placing stop losses just above the upper boundary of the former support range.
There is another Bearish BPR zone below the current price.BTC/USDT Market Update – Clear, Detailed, and Easy to Understand (Even for Beginners)
Let’s take a look at what’s happening with Bitcoin (BTC/USDT) right now explained in a way that even someone new to trading can follow along and understand.
Recently, Bitcoin hit a new high it was climbing up steadily. But then, due to negative global news related to war, the market took a hit and started dropping sharply.
Currently, BTC is trading at a (BPR) this is a technical area that often acts as a strong resistance zone, where the price tends to face rejection and reverse.
👉 Right now, Bitcoin is struggling to move higher and appears to be getting rejected from this BPR level.
But here’s where it gets more interesting:
🔻 There is another Bearish BPR zone below the current price, and the market has already touched that zone once before bouncing upward.
So what's the current situation?
📍 If Bitcoin is able to break above the current Bearish BPR (the level where it’s trading now) — it would be a bullish sign, and the market may start rising again.
📍 However, if BTC fails to break this resistance level, then we could see another strong move to the downside, possibly heading back to lower support zones.
🚨 Key Takeaway:
This level — the one BTC is currently interacting with — is very important.
📌 Traders should keep a close eye on it.
📌 Let the market reveal its direction before making any decisions.
Remember:
⚠️ This is not financial advice. Always Do Your Own Research (DYOR).

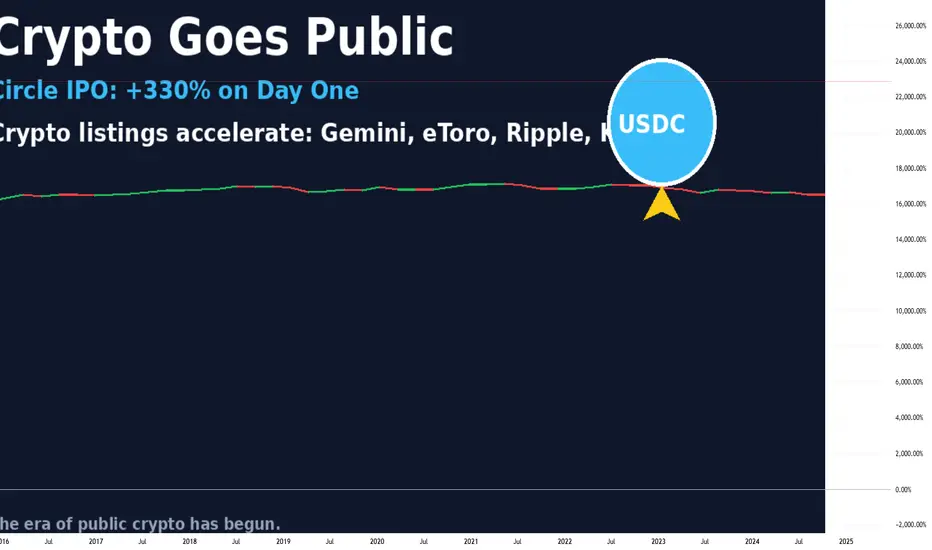
Circle’s IPO and the Crypto Listing Wave: The Market EntersOn June 14, 2025, the U.S. stock market witnessed a pivotal moment for the crypto industry. Circle, issuer of the USDC stablecoin and a major player in the sector, successfully went public. Shares opened at $31 and soared to over $134 by the end of the first trading day—an explosive 330% gain.
This isn’t just a one-off success. It marks the beginning of a new chapter: the public crypto era, where leading crypto companies are stepping into the spotlight of traditional finance.
Why It Matters
Circle’s IPO signals the maturation of the crypto market. Just three years ago, crypto companies were seen as high-risk, unregulated tech startups. Now, they’re structured fintech firms with clear business models, institutional backing, and regulatory compliance.
Who’s Next in Line
Following Circle, a wave of major crypto firms is preparing for their own IPOs:
eToro – the social trading platform with crypto features has finalized its SPAC merger and is set to debut on NASDAQ.
Gemini – the exchange founded by the Winklevoss twins filed for an IPO in mid-May.
Galaxy Digital and Ripple – both confirmed listing plans for the second half of 2025.
Kraken is exploring a listing in Europe, where requirements are more flexible than in the U.S.
These companies are waiting for the right moment—regulatory clarity, growing interest in crypto ETFs, and progress in U.S. Congress (with the CLARITY and GENIUS bills gaining momentum).
What It Means for the Industry
Increased Investor Trust – Public companies must disclose financials, pass audits, and comply with regulations. This builds confidence in the broader crypto sector.
Institutional Capital Inflow – IPOs unlock access to capital from pension funds, hedge funds, and asset managers that cannot invest in private crypto startups.
Marketing Power – Going public draws media attention and boosts brand awareness. Every IPO is a PR win for the entire industry.
Risks and Challenges
Regulatory Uncertainty – Despite progress, the SEC could change direction, especially with potential political shifts.
Overvaluation Concerns – Circle’s stock is already raising eyebrows, with a P/E ratio over 200 and trading volume growing faster than revenue.
Crypto Market Dependency – If crypto prices crash, the valuations of these companies could quickly collapse.
What’s Next
Expect up to 10 more crypto IPOs over the next 6–12 months, including players in DeFi, blockchain infrastructure, and Web3. This is the next stage in crypto’s journey toward mainstream legitimacy.
What was once the domain of tech rebels and early adopters is now becoming a business—with a stock ticker and quarterly earnings. And that changes everything.
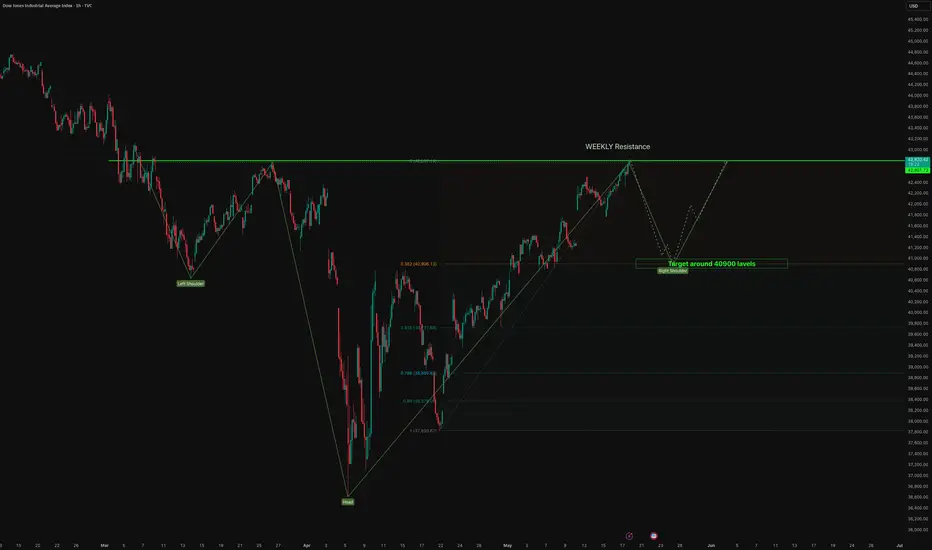
DOW - H&S is getting progressed. 📉 DOW JONES – Head & Shoulders Pattern Formation (Right Shoulder in Progress)
The chart illustrates a clear Head & Shoulders (H&S) pattern, a classic bearish reversal signal, forming on the higher timeframe.
🧠 Pattern Breakdown:
Left Shoulder: Formed in early March.
Head: Sharp dip and recovery formed during early April.
Right Shoulder: Currently in the making, aligning with a weekly resistance near 42,880 levels.
Price is expected to reject this resistance and complete the right shoulder.
📌 Technical View:
Strong rejection expected near the weekly horizontal resistance.
If the right shoulder completes and breaks below the neckline (around 41,500–41,600), it may trigger a measured fall.
Fibonacci levels also align, with the 0.382 and 0.5 retracement acting as potential reaction zones.
🎯 Target:
Target: 40,900 levels (Right Shoulder support zone).
This is a confluence zone where buyers may reappear.
Also forms a neckline test, critical for breakout confirmation or reversal.
🔔 Trade Setup Insight:
Short bias activated near 42,880 resistance zone.
Watch for confirmation via bearish engulfing candles or lower time frame breakdowns.
Targeting 40,900 initially. Further downside possible if neckline breaks decisively.
⚠️ Disclaimer:
This analysis is for educational purposes only and does not constitute investment advice or a recommendation. All trading involves risk. Please perform your own due diligence or consult a certified financial advisor before making trading decisions.
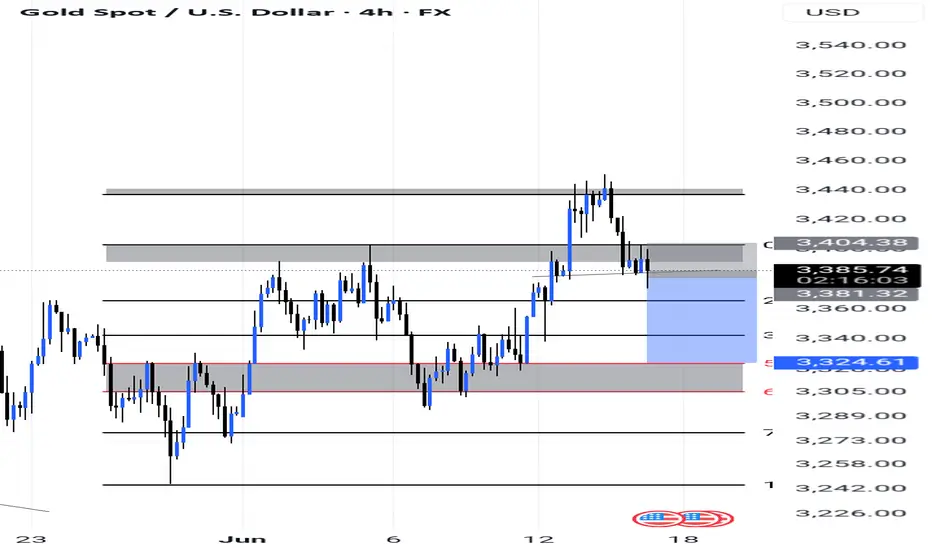
6/13 Gold Analysis and Trading SignalsGood morning, everyone!
Gold rallied to around $3399 during yesterday’s session, accurately reaching our preset sell zone at 3385–3403. Since then, the market has started pulling back, and today’s opening shows signs of accelerated downside movement. However, there are several strong support zones below, with immediate focus on 3378–3368, and further support around 3352–3343.
📉 Technical Outlook:
The current price action suggests the potential formation of a Head and Shoulders pattern. If confirmed, this could trigger a deeper correction towards 3340–3330. A break of these levels would significantly weaken the current bullish structure and open further downside risk.
🌍 Fundamental Drivers:
Today’s inflation-related data releases may add significant volatility;
Additionally, stay alert to any developments in the Middle East geopolitical situation, which could quickly shift market sentiment toward risk-off if escalations occur.
📌 Today’s Trading Recommendations:
✅ Sell Zone: 3410–3420
✅ Buy Zone: 3338–3326
🔄 Intraday Key Reaction Levels:
3403 / 3378 / 3362 / 3355 / 3343
🔒 Recommendation: Market is at a technically sensitive zone. Consider entering positions in batches and maintain strict risk control.

BTC: Elliot Cycle AnalysisA simple Elliot wave analysis of BTC's cycle. I predict we top out between 140-190k, before entering a bear market that will last ~12 months, likely ending early 2027. I can imagine that we form a massive H&S before we decline.
I believe the widespread adoption of crypto, BTC reserves, ETFs, etc. will serve as a bulwark against too harsh a winter. We perhaps drop to the 56k support, which would be an excellent buy-back opportunity.
Prepare to exit the market and remain tethered up for about a year or so. Don't get greedy. Things are gonna heat up real soon for the broader market.
Happy trading,
Melonfarmer

WARBY PARKER to continue its recovery to $34 and beyond#inverseheadandshoulders
They want to have 900 retail locations
currently operating 271 in the US and 5 in Canada.

EURGBP - Inverted Head and ShouldersHello Traders !
The EURGBP price formed an inverted head and shoulders pattern.
Currently, The neckline is broken !
So, I expect a bullish move🚀
______________
TARGET: 0.85110🎯