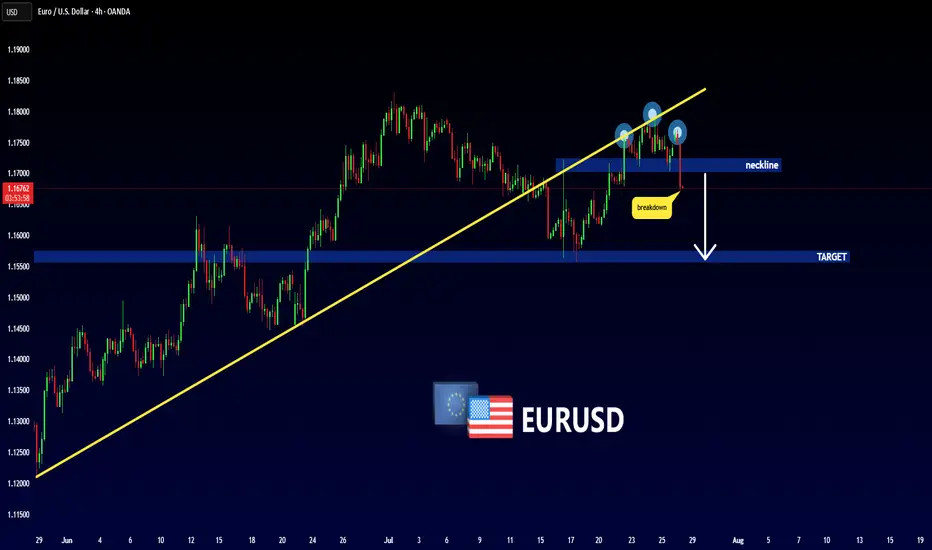
EURUSD - Head and ShouldersHello Traders !
The EURUSD failed to create a new higher high!
The price formed a head and shoulders pattern.
Currently, the neckline is broken!
So, I expect a bearish move📉
________________
TARGET: 1.15750🎯
Head and Shoulders
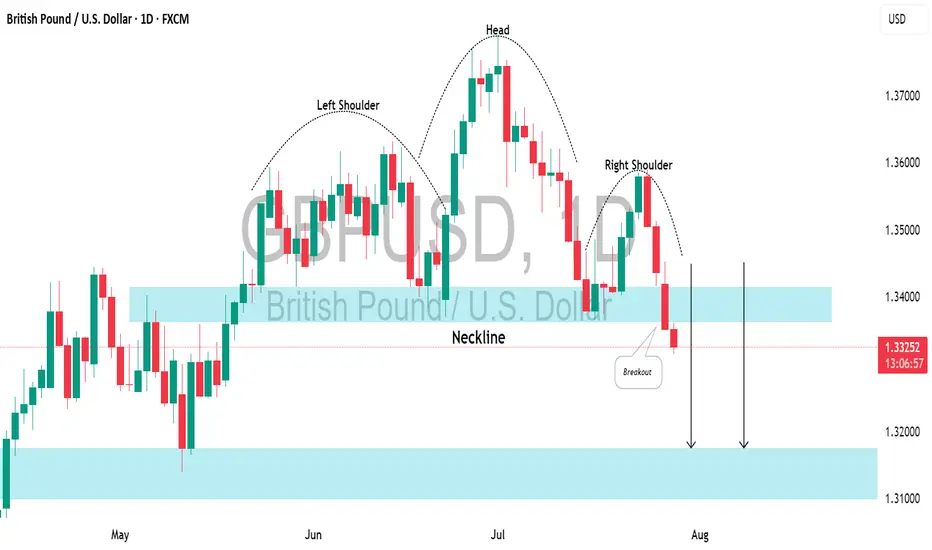
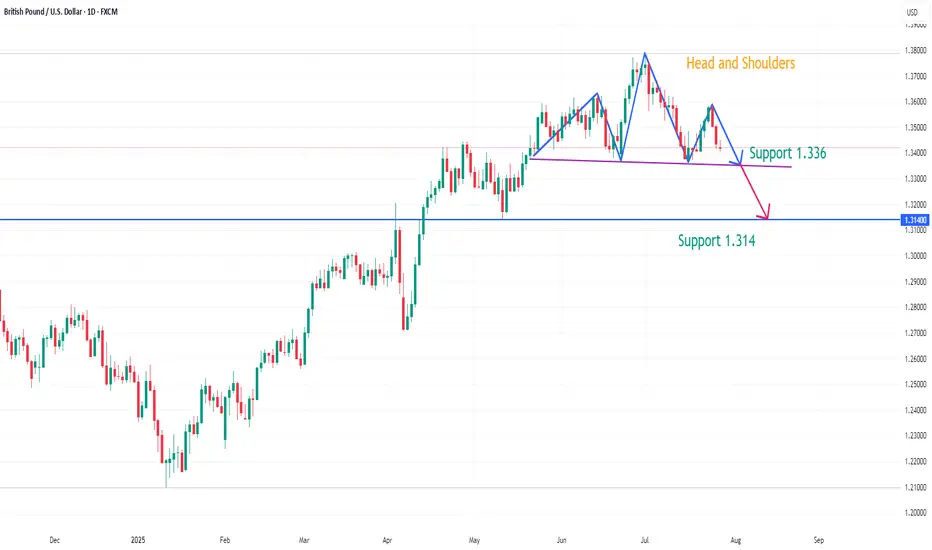
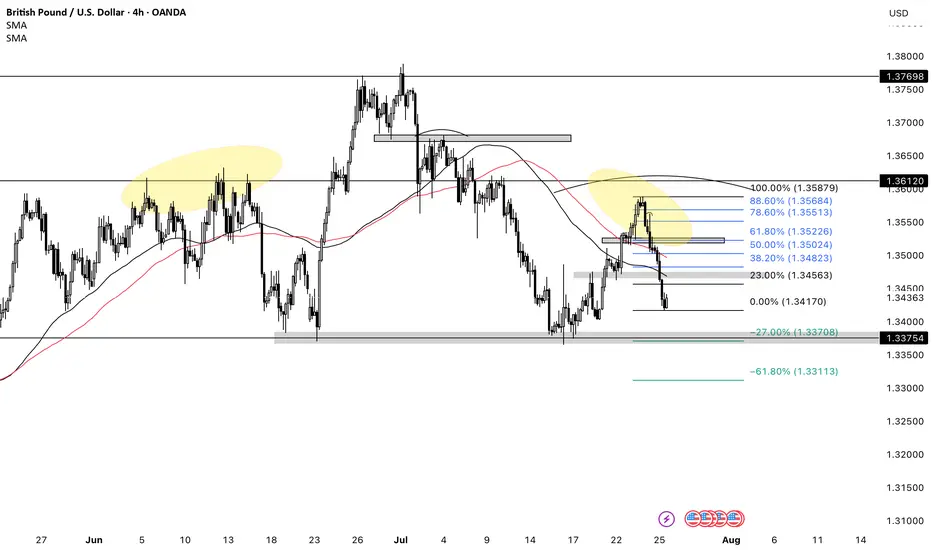
GBPUSD: Bearish Reversal Coming?!The 📉GBPUSD pair formed a significant head and shoulders pattern on the daily chart.
The neckline was violated yesterday, with a daily candle closing below it. I anticipate a downward movement.
With the next support level at 1.3170.
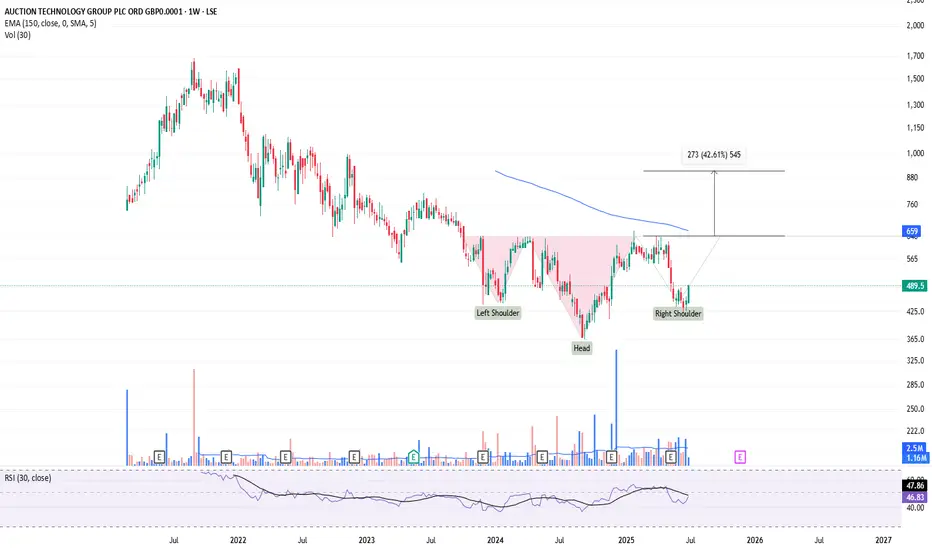
ATG forming a right shoulder?Is this a textbook H&S pattern being formed? 643 is break out/neck line and 912 is the target. Looks like it and reversal will be know by September to November 2025.
This is not a solicitation to trade in ATG shares.
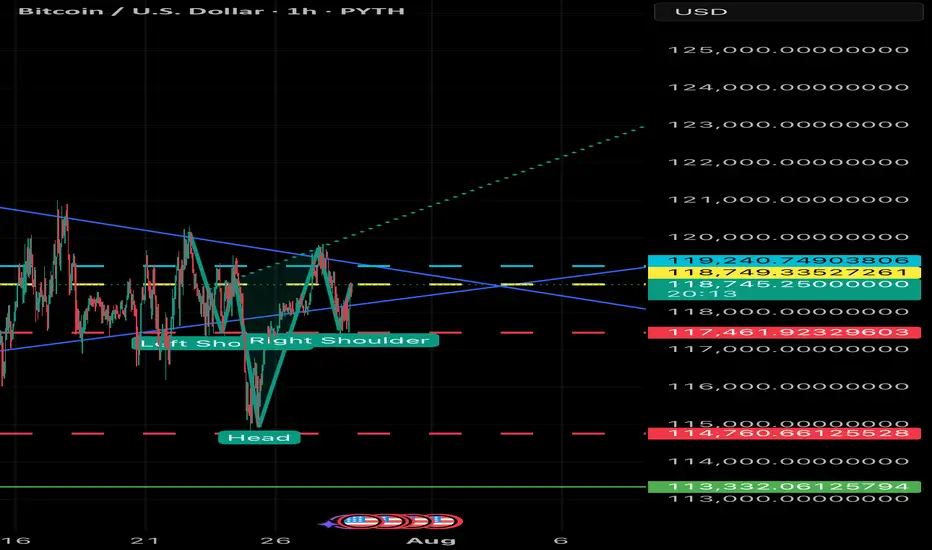
BULLISH - BTC Breakout Imminent The breakout confirmation in the context of the inverse head and shoulders pattern depicted in the provided chart refers to the validation of a bullish reversal signal, indicating a potential shift from a downtrend to an uptrend. This confirmation is typically established through specific technical criteria, which I will outline below in a structured manner. Given the updated current price of 118,580, I will also assess its implications based on the chart’s features.
Key Elements of Breakout Confirmation
1. Break Above the Neckline: The neckline, represented by the dotted teal line in the chart, serves as the primary resistance level. It connects the highs following the left shoulder and head formations, sloping slightly downward. From the visual analysis, the neckline appears to range approximately from 119,000–120,000 on the left to 117,000–118,000 near the right shoulder. A decisive breakout occurs when the price closes above this line, invalidating the prior downtrend. In the chart, the price has already surpassed this threshold, reaching 118,318.57 at the time stamp of 23:23.
2. Volume Support: Confirmation is strengthened by an increase in trading volume during the breakout candle or session. This suggests conviction among buyers and reduces the likelihood of a false breakout. The provided chart does not display volume data, so external verification (e.g., via exchange metrics) would be necessary for full assessment. Absent this, price action alone provides preliminary evidence.
3. Price Closure and Sustained Momentum: A single intraday breach may not suffice; confirmation often requires a session close (e.g., daily or hourly, depending on the timeframe) above the neckline, ideally with follow-through in subsequent periods. Additional supportive factors include:
• No immediate retest or pullback below the neckline, which could signal a trap.
• Alignment with momentum indicators, such as the Relative Strength Index (RSI) moving above 50 or a bullish moving average crossover (not visible in the chart).
4. Pattern Target Projection: Upon confirmation, the upside target is calculated by measuring the vertical distance from the head’s low (approximately 114,000) to the neckline at the breakout point (around 118,000), yielding a height of about 4,000 units. Adding this to the breakout level suggests potential targets near 122,000 or higher, though market conditions may alter outcomes.
Assessment at Current Price of 118,580
At 118,580, the price remains above the estimated neckline breakout point (approximately 118,000 at the right shoulder), extending the upward trajectory shown in the chart. This positioning supports preliminary confirmation of the breakout, as it demonstrates sustained momentum beyond the resistance. However, for robust validation:
• Monitor for a close above this level on the relevant timeframe.
• Watch for any retracement; a successful retest of the neckline as support would further solidify the pattern.
• Consider broader market factors, such as macroeconomic influences or sentiment in the asset class (likely cryptocurrency, given the price scale), which could impact durability.
If additional data, such as volume or updated charts, is available, it would refine this analysis. Should you require further details or evaluation of related indicators, please provide specifics.
Sharplink Bets Big on ETH as It Breaks $3,900Ethereum has surged past the $3,900 mark, propelled in part by news that Sharplink has acquired 77,200 ETH — a transaction worth over $300 million at current market value. For BBDelta, this move is not just market noise — it’s a concrete example of how institutional-grade Ethereum strategies can drive both asset growth and consistent income.
Sharplink, originally focused on gaming and Web3 infrastructure, has recently pivoted toward an asset-heavy Ethereum strategy. This latest acquisition positions the firm among the top ETH holders globally — and, more importantly, signals a clear roadmap to profit generation within the Ethereum ecosystem.
BBDelta analysts believe Sharplink isn’t buying ETH for speculative purposes. Rather, the company is likely deploying a multifaceted revenue model using its holdings. That includes high-yield staking via Ethereum’s proof-of-stake protocol, engagement with DeFi lending platforms, and participation in liquidity pools. These strategies, when executed correctly, can yield between 4% and 8% annually — paid directly in ETH or stablecoins.
In addition to yield generation, Sharplink could be utilizing ETH to collateralize derivatives positions, fund tokenized infrastructure, or support its presence in NFT ecosystems. Ethereum, as a platform, offers an incredibly diverse set of use cases — making it more than just a crypto asset, but a cornerstone of digital finance.
The breakout past $3,900 further strengthens this strategy. BBDelta’s technical analysis shows increased open interest in ETH futures and options, indicating rising institutional demand and the likelihood of continued volatility — a prime environment for experienced players to profit from both price movement and structure-based yields.
Sharplink’s timing also reflects sound macroeconomic thinking. As fiat currencies continue to face inflationary pressure and traditional interest rates plateau, ETH-based strategies offer both protection and performance. BBDelta believes this dual value proposition — yield + appreciation — is driving renewed interest in Ethereum as a strategic reserve asset.
At BBDelta, we empower clients to capitalize on these same dynamics. Whether it’s through ETH staking, DeFi revenue models, or structured derivatives, we offer the tools and advisory frameworks that allow investors to turn ETH holdings into active profit centers — with proper risk management in place.
Ethereum’s $3,900 milestone is not a peak — it’s a gateway to next-level opportunity. For those with the infrastructure, insights, and risk controls in place, the digital economy is not just a bet — it’s a business.

EURUSD Did Not Like the EU–US DealThe heavily one-sided EU–US deal has put negative pressure on EURUSD. Ahead of a crucial week filled with major events, including GDP data from both the Eurozone and the US, the PCE report, payrolls, and meetings from the FOMC and BOJ, EURUSD has broken a short-term head and shoulders formation. The pattern's target is near 1.1610.
A retest of the broken support is possible and could even extend to 1.1725. However, unless sentiment changes due to some news, this move may offer only a selling opportunity. The downward trend could also continue without pause.
Options market activity suggests that the 1.16 to 1.18 range is viewed as a "safe zone," with large players likely aiming to keep EURUSD within this band for the week. If the head and shoulders target is reached, EURUSD might stabilize and bounce around the 1.16 level.

GBPUSD has formed a potential head and shoulders patternOn the daily chart, GBPUSD has formed a head and shoulders top pattern. The current support below is around 1.336. If it falls below, it is expected to continue to fall, with the downside target around 1.314. At present, you can pay attention to the short-selling opportunities around 1.345.
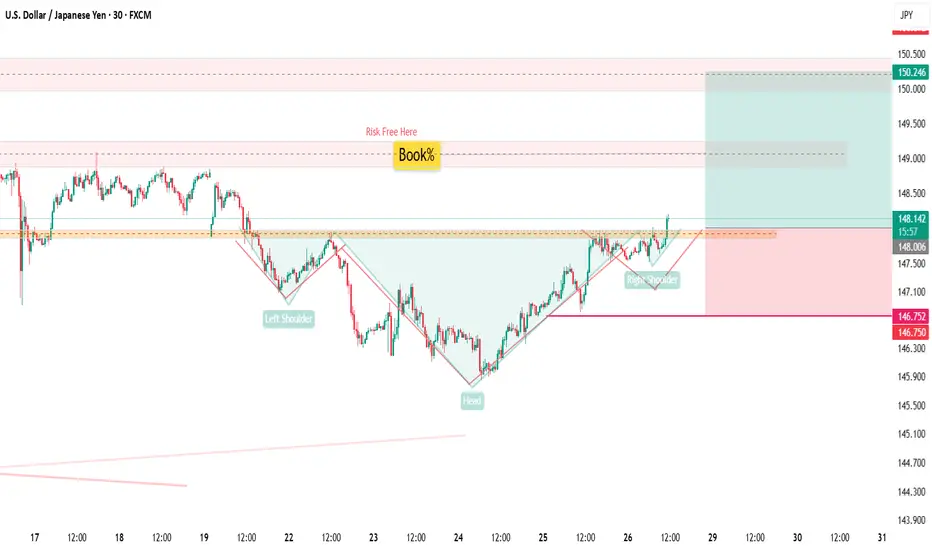
USDJPY30h Candle confirmed break out!
📢 USDJPY – 30H Breakout Confirmed
Technical Outlook:
Confirmed breakout on the 30H candle, signaling bullish.
Resistance break!
A Inverse Head & Shoulders pattern observed, though the right shoulder is slightly weaker than the left.
For safety, Stop Loss placed below the last Higher Low (HL) to respect market structure.
📍 Key Line:
“Imperfect structures can still produce perfect trades — when aligned with price action and fundamentals.”
🌐 USD Fundamentals Supporting the Bias:
Stronger-than-expected economic data (e.g., recent PMI and labor reports) continues to support USD strength.
Fed's hawkish stance and higher-for-longer rate policy remain favorable for the dollar against low-yielding currencies like JPY.
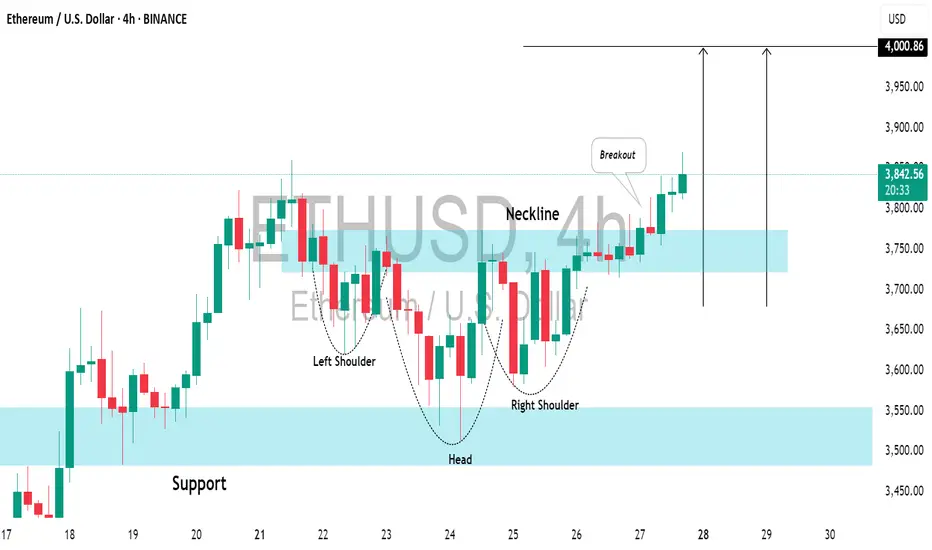
ETHEREUM (ETHUSD): Bullish Move After BreakoutIt looks like Ethereum has completed its bearish correctional movement.
Analyzing the price movement on a 4H timeframe, the market formed an inverted head and shoulders pattern on a retest of a horizontal support.
The neckline of this pattern is broken, which suggests a strong likelihood of a bullish trend resuming, with the price expected to reach the psychological level of 4000 soon.
GBPUSD SHORTSPrice closed the week bearish. There’s a daily head and shoulders pattern as well. Looking for price to continue bearish towards daily support. I’d like for price to retrace and create a LH before looking to get back into shorts.
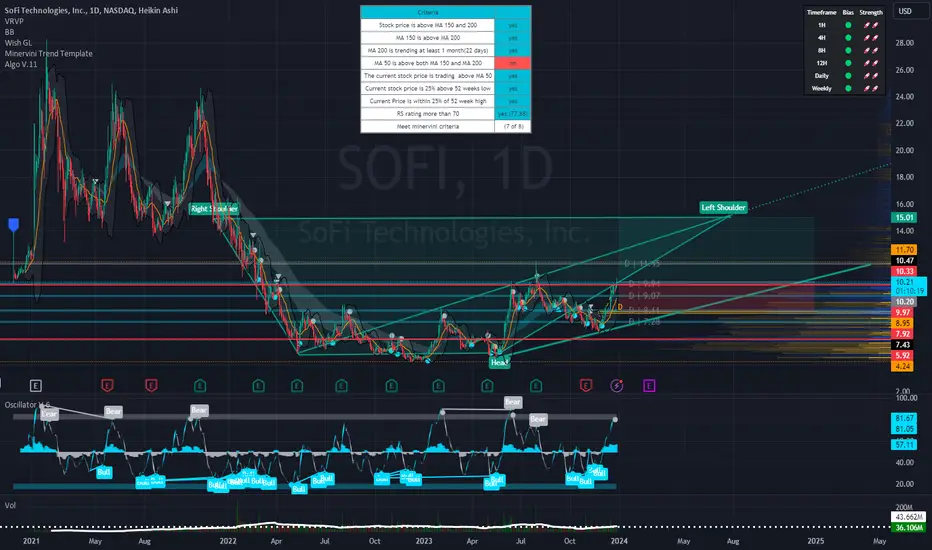
SoFi's Surge: Unveiling 2023 and What Lies Ahead in 2024Technical Analysis Overview
Current Price : $10.34, a 3.77% increase.
Weekly Trend : Showing a positive trend with a 5.35% increase over the last five days.
1-Month Trend : A significant increase of 51.96%, indicating strong bullish sentiment.
6-Month and Yearly Trends : A 17.04% increase over the last six months and a 124.51% increase year to date, highlighting a robust bullish trend.
Advanced Technical Indicators
Relative Strength Index (RSI) : 70.41 - Indicating that SOFI is nearing overbought territory, which could lead to a potential reversal or consolidation in the short term.
Moving Average Convergence Divergence (MACD) : 0.63 - Suggesting bullish momentum, indicating a strong buying trend.
Other Indicators : STOCH (83.28), STOCHRSI (84.02), ADX (37.09), Williams %R (-8.57), CCI (104.63), ATR (0.46), Ultimate Oscillator (54.76), and ROC (24.66) all contribute to a picture of current bullish momentum but with potential for short-term volatility or pullback.
Market Sentiment and External Factors
Market Capitalization : $9.904B USD.
Trading Volume Analysis : A high trading volume of 35,199,288, suggesting active market participation and interest in the stock.
Recent News Coverage Impacting SOFI
Bullish Outlook for 2024 : Analysts predict SOFI stock could continue its rally in the new year, benefiting from expected interest-rate cuts. A notable analyst has set a high price target of $14 for SOFI stock, implying significant upside potential ( InvestorPlace ).
Focus on Non-Lending Businesses : Analysts appreciate SoFi's shift towards non-lending businesses, improving earnings quality despite a higher-for-longer interest-rate policy.
Central Bank Policy Changes : Potential interest rate cuts in 2024 could benefit SoFi's lending business, as lower rates tend to spur borrowing and lending activity.
Conclusion
SOFI's stock shows strong bullish signs in the medium to long term, but the current overbought condition warrants caution for short-term traders.
The recent news and analyst predictions provide a positive outlook for 2024, making SOFI an interesting stock for both traders and long-term investors.
Market Dip or Bullish Pause Why These 4 Crypto Still Have StrongAs the crypto market retraced modestly in late July, shedding roughly 5% in total market cap, investors were left wondering: is this a signal of deeper correction—or merely a bullish pause before the next leg up?
According to analysts across leading funds and research firms, the recent dip may be healthy consolidation—and several assets continue to show strong structural momentum, even as prices pull back.
Here are four cryptocurrencies still demonstrating resilience and upside potential:
1. Bitcoin (BTC): Strong Hands, Strong Signals
Despite falling from $131,000 to $115,000, Bitcoin’s long-term holder supply reached an all-time high, with over 70% of BTC unmoved in over 12 months. Derivatives data shows rising open interest and neutral funding rates—suggesting professional positioning, not panic.
“If this is a pullback, it’s one with strong underpinnings,” said Felix Grayson, portfolio manager at Helix Funds.
2. Ethereum (ETH): ETF Flows and Ecosystem Growth
Ethereum continues to benefit from spot ETF inflows and Layer 2 expansion. Gas fees remain low, and total value locked (TVL) on Ethereum-based chains has grown by 9% in July alone.
“ETH’s on-chain activity is diverging from price,” said Melinda Zhou, research lead at TitanAlpha. “That’s usually a leading indicator.”
3. Chainlink (LINK): Real-World Integration Boom
LINK is quietly gaining institutional traction. The token surged 14% month-to-date on the back of Oracle partnerships with global banks exploring tokenized bonds and CBDCs.
Chainlink’s Cross-Chain Interoperability Protocol (CCIP) is also seeing adoption by multiple Layer 1s, strengthening its role as the data layer of Web3.
4. StarkNet (STRK): Layer 2 With Institutional Backing
A newer entrant, StarkNet, is positioning itself as the “ZK-powered” Ethereum scalability solution of choice. With backers like Sequoia and Paradigm, and growing traction among DeFi protocols, STRK has outperformed peers in July with a 27% gain.
“The zero-knowledge narrative is just beginning,” noted Zhou. “StarkNet could lead the next phase of Layer 2 expansion.”
Conclusion
Not all dips are created equal. While short-term price action may test investor nerves, fundamentals across major Layer 1 and Layer 2 networks remain robust and improving. For seasoned investors, these moments offer not panic—but perspective.
As capital returns and development accelerates, expect these four projects to remain at the forefront of the next bullish wave.

Top 5 Cryptocurrencies This Month: July 2025 Leading PerformersBy Forbes Contributor
Despite ongoing regulatory turbulence and macroeconomic uncertainty, July 2025 has proven to be a month of notable gains across the cryptocurrency market. A mix of established leaders and rising altcoins have outperformed expectations, driven by ecosystem developments, market sentiment, and broader digital asset adoption. Based on performance metrics, trading volumes, and real-world developments, here are the top five crypto gainers of the month.
1. Toncoin (TON)
+67% (Month-to-Date)
Toncoin surged on the back of growing Telegram ecosystem integrations. With more mini-apps and wallets going live on the platform, TON is rapidly becoming a medium of exchange for users worldwide. Its alignment with a major messaging platform provides Toncoin with unique network effects that most cryptocurrencies can’t match.
Key driver: Telegram’s global user base crossing 1 billion, bringing TON into daily utility.
2. Render (RNDR)
+58%
The rise of AI and decentralized GPU rendering continues to benefit the Render Network. RNDR gained momentum as AI developers increasingly rely on decentralized GPU resources to train and deploy models, particularly in gaming and VR applications.
Key driver: Strategic partnerships with gaming studios and AI startups boosted investor confidence.
3. Ethereum (ETH)
+31%
Ethereum gained steadily following the approval of several ETH-based financial products in Europe and Asia. Additionally, increased staking activity and rollup adoption contributed to its bullish trajectory.
Key driver: Layer-2 activity and continued optimism surrounding Ethereum 2.0 upgrades.
4. Arbitrum (ARB)
+26%
Arbitrum benefited from significant ecosystem growth and DAO-funded initiatives. The implementation of new governance features and distribution of developer grants have brought more attention to the rollup-based network.
Key driver: Grant program rollout and cross-chain bridges attracting liquidity from competitors.
5. Worldcoin (WLD)
+24%
Despite controversy, Worldcoin’s biometric authentication project saw renewed adoption in emerging markets. With discussions around digital ID becoming central to Web3 identity, WLD attracted attention from institutional analysts.
Key driver: Integration into digital ID pilots in Latin America and Southeast Asia.
Final Thought
July's winners reflect a broader shift in investor preference: towards utility-driven, scalable projects. As we enter August, investors should monitor upcoming protocol upgrades, regulatory developments, and macroeconomic shifts — all of which could impact the next wave of top performers.

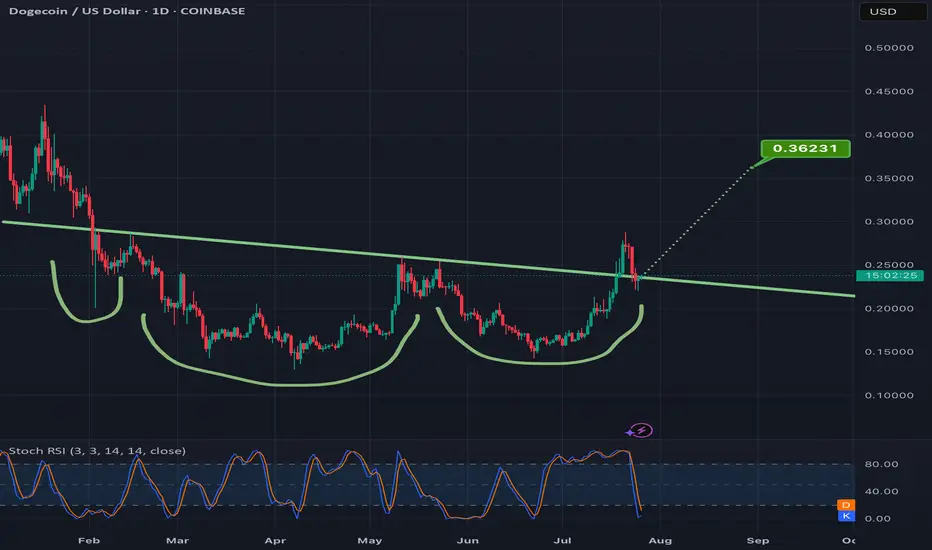
Confirming the breakout of this invh&s on doge can = 50% gainsAlready went above the neckline once and the current daily candle is currently back above the neckline for a second time. Hitting the full target would mean a good 50% gain from current price. *not financial advice*
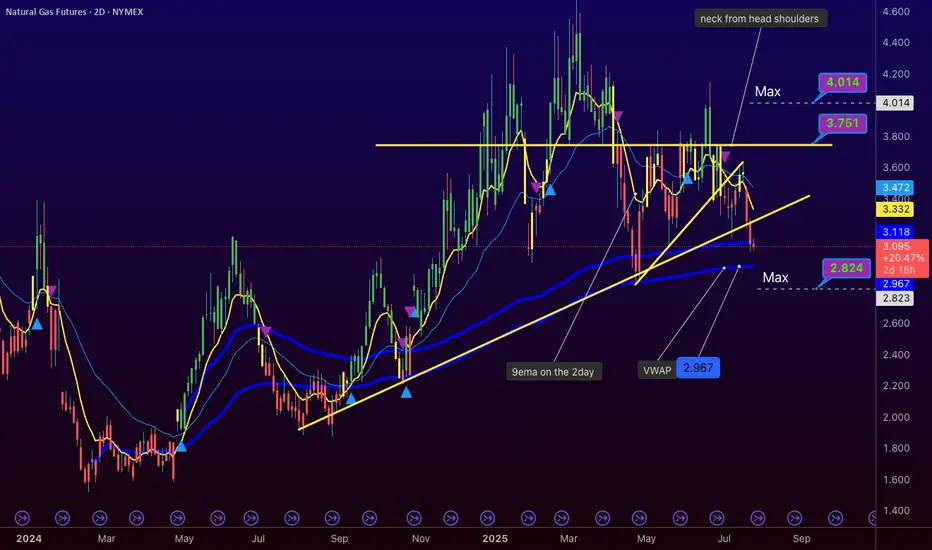
NG1! Bearish Break to $3.00-$2.82 by Tuesday?tradingview.sweetlogin.com NYMEX:NG1! Update - Bears Pushing, Turnaround Looms Short-Term Odds: ~60% pullback to $3.00-$2.99, ~40% chance to $2.82 - Key Signal: Low volume on 1000-tick chart, holding below VWAP ($3.134). Third test at $3.10 done—$3.00 next if support breaks. - Trend Hint: Bearish with high storage (3,075 Bcf). August heat (Dallas 104°F) looms but not flipping yet. Expect a potential dump Monday (July 28), turnaround Tuesday (July 29). lets see how it plays out - Enjoying these updates?
Good hunting! #NaturalGas #Trading #NG1
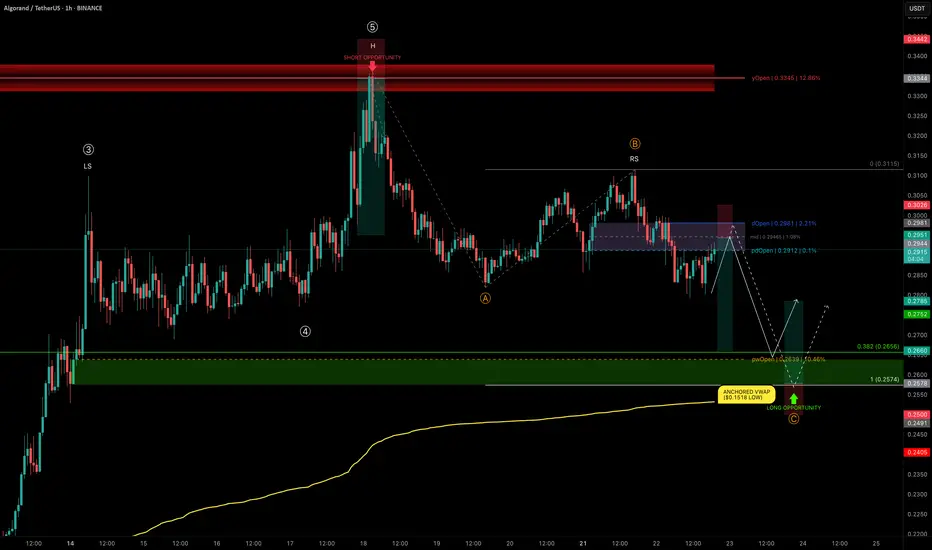
ALGO rejects at yOpen — Mapping High-Conviction Trade ZonesALGO has delivered an impressive +124% rally from $0.1518 to $0.336 in just 25 days, completing a 5-wave Elliott impulse right into the yearly open resistance.
We are now in a correction phase, and the current structure is showing a head and shoulders pattern, with the right shoulder currently forming.
Let’s break down the key levels and setups.
🧩 Technical Breakdown
➡️ ABC Corrective Structure:
Targeting wave C near the trend-based fib extension (TBFE) at $0.2574
➡️ Fib Retracement Confluence:
0.382 retracement of the entire 5-wave move → $0.2656
Previous weekly open (pwOpen) → $0.2639
Liquidity pocket likely to be swept
Anchored VWAP from the $0.1518 low (start of the bullish trend) → currently at $0.2532, acting as a major support layer
Conclusion: Long opportunity zone between $0.2656–$0.2574
Trade Setups
🔴 Short Setup:
Why? ALGO has lost dOpen and pdOpen — a bearish sign for downward continuation.
Entry Zone: Between dOpen and pdOpen
Stop-loss: Above dOpen
Target (TP): 0.382 fib retracement (~$0.2656)
R:R: ≈ 1:3.5
🟢 Long Setup:
Entry Zone: Laddered Entries between $0.2656–$0.2574
Stop-loss: Below anchored VWAP (~$0.2532)
Target (TP): ~$0.2785+
R:R: ≈ 1:2.65
🛠 Indicator Note
I’m using my own indicator called "DriftLine - Pivot Open Zones " for this analysis, which I recently published.
✅ Feel free to use it in your own analysis!
Just head over to my profile → “Scripts” tab → apply it directly to your charts.
💡 Educational Insight: Why Confluence Matters
High-probability trades aren’t based on just one tool or level — they come from confluence, where multiple signals align: fib levels, VWAP, liquidity pools, price structures , and key levels.
For example, in this ALGO setup, it’s not just the fib retracement or just the VWAP — it’s the stacking of all these elements together that creates a precise zone with a better statistical edge.
✍️ Lesson: Don’t chase trades off single signals; stack tools for confirmation.
Patience, confirmation, and confluence — as always, the keys to high-probability setups. 🚀
_________________________________
💬 If you found this helpful, drop a like and comment!
Want breakdowns of other charts? Leave your requests below.
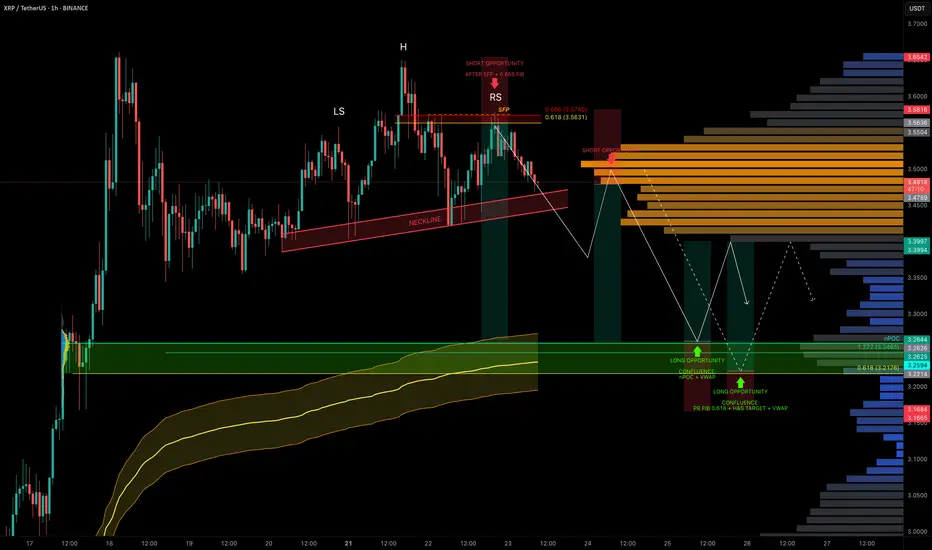
XRP Coiled in Range — Liquidity Below, Trade Setups AheadXRP has been stuck in a trading range around $3.50 for the past 5 days, offering multiple trade opportunities within the chop.
A notable short was triggered after a swing failure pattern (SFP) at the 0.666 fib retracement level near $3.563.
Now, with liquidity building to the downside, we’re watching closely for the next high-conviction setups.
🧩 Current Structure & Short Setup
🔴 Short Opportunity (Triggered):
SFP + 0.666 fib retracement at $3.563 led to rejection.
Market now shows a head & shoulders pattern forming.
Target: $3.2176 (0.618 fib retracement).
Trigger: Watch for a neckline break + retest for short confirmation.
Stop-loss: Above the right shoulder.
🟢 Long Setup:
Watching for a high-probability long around:
$3.26 → nPOC + 1.272 TBFE
$3.23 → anchored VWAP bands
This zone offers strong confluence and could act as the next launchpad.
Long Trade Plan:
Entry Zone: potential entries between $3.26–$3.22, price action needed for confirmation
Stop-loss: Below swing low at $3.1675
Target (TP): ~$3.40
✍️ Plan: Set alerts near the lows and react to price action at the zone — don’t front-run, let structure confirm.
💡 Pro Tip: Trade the Confluence, Not the Emotion
High-probability trades come from confluence, not guessing.
This setup combines nPOC, TBFE, VWAP, fib levels, and classical market structure (H&S) to map precise zones for both longs and shorts.
Let price come to you and wait for confirmation — especially in a rangebound environment where liquidity hunts are frequent.
Final Thoughts
We’re still rangebound, but liquidity is building below.
Keep an eye on the $3.26–$3.22 support zone for long entries and the H&S neckline for short breakdown confirmation.
_________________________________
💬 If you found this helpful, drop a like and comment!
Want breakdowns of other charts? Leave your requests below.
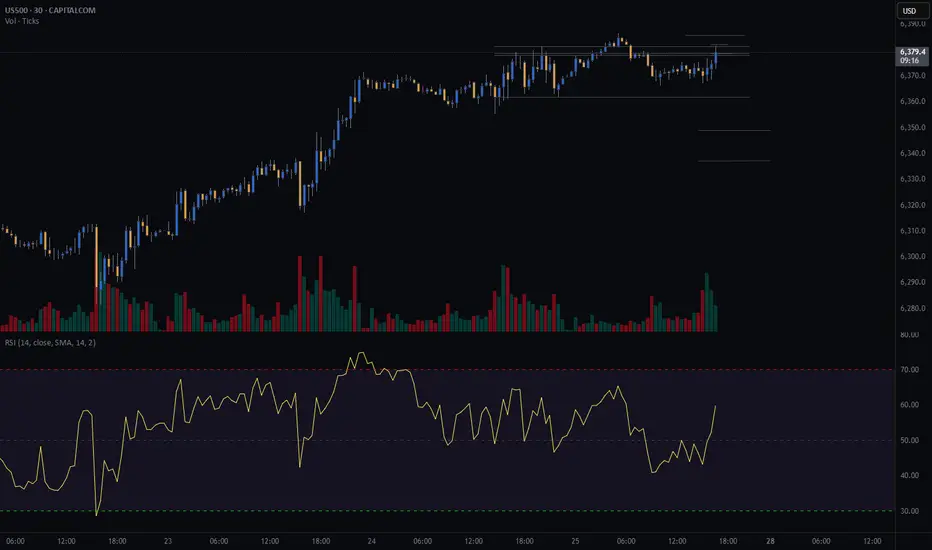
S&P500 (CASH500) SHORT - head and shoulders 30minRisk/reward = 4.1
Entry price = 6378
Stop loss price = 6385.9
Take profit level 1 (50%) = 6349.2
Take profit level 2 (50%) = 6337.2
Still waiting on confirmation of a few variables at close of this 30min candle at 17.00
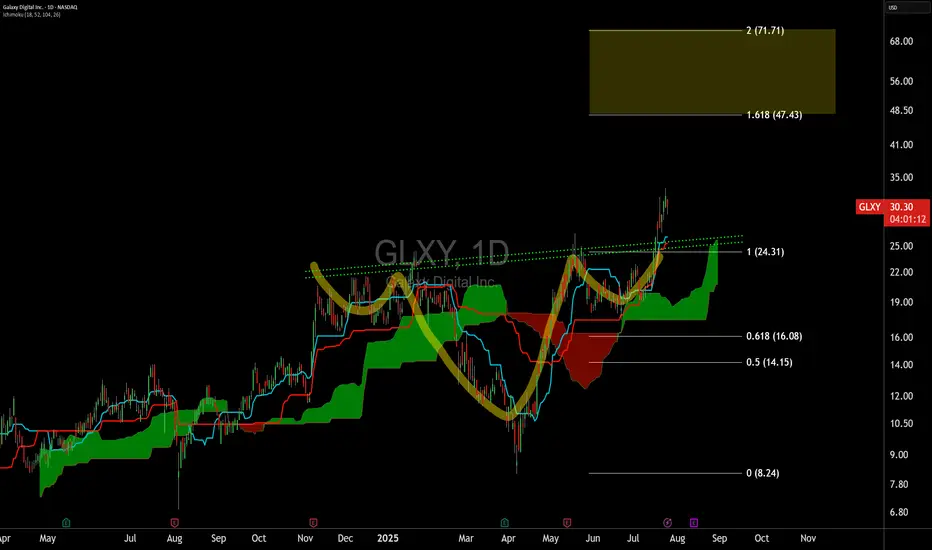
SG Approaching a Potential Trend ShiftPotential trend flip on the SweetGreen Chart for the first time since December 2024. I use a default doubled cloud on the daily timeframe 18/52/104/26. I find this to be superior to the default cloud on both backtesting and forward testing over the past decade on any chart.
Ideal bullish entry conditions occur on the cloud system when all four conditions are met:
Price above cloud
Bullish cloud
Bullish tenkan and kijun cross (TK)
Lagging span above price and above cloud (LS)
The doubled cloud settings are meant to decrease noise and increase signal, because of this I ignore the lagging span entirely and have never used the lagging span for entry criteria. We are approaching sufficient EARLY entry conditions was price enters the daily cloud.
Additionally, SG has one of the cleanest active inverted head and shoulders patterns in the market at the moment.
The target zone is merely based on the 50% retracement of high to low of the multi-month down trend, see: Dow Theory. Additional upside can be seen if the trend remains intact. Trailing stop losses via Williams Fractals and keeping an eye out for bearish divergences are both key to position management for this strategy.
Stop loss considerations for this idea is a combination of price below cloud and new lower lows., in this case below 13. Be mindful of a poor earnings result on Aug 7th could easily trip this SL level.

ETHUSD Inverse Head Shoulder 4hrRather self explinatory . Potential Inverse Head & Shoulder 4hr and 1hr . Target approx. 4,014 USD

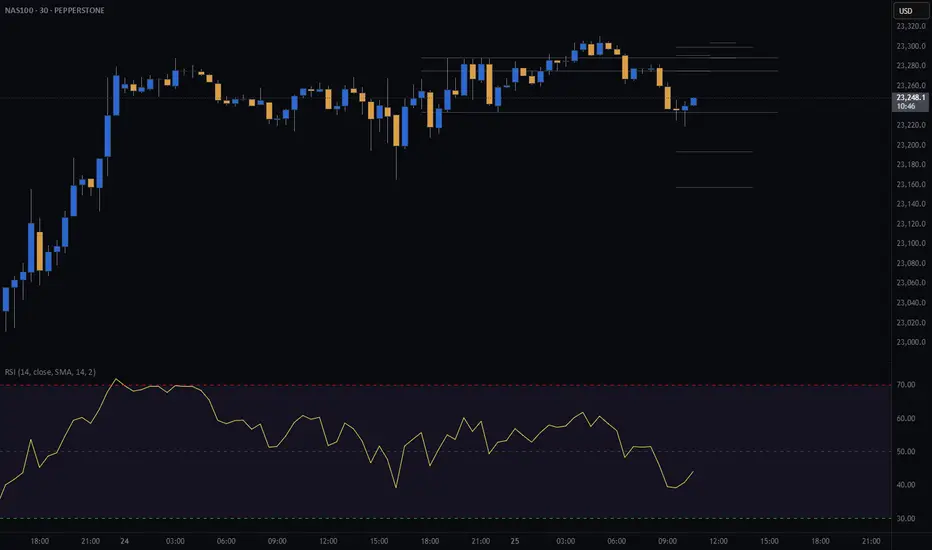
NDX (NASDAQ) CASH500 SHORT - Head and shoulders 30minRisk/reward = 3.2
Entry price = 23 275.7
Stop loss price = 23 303.9
Take profit level 1 (50%) = 23 193
Take profit level 2 (50%) = 23 157
Waiting on confirmation on a number of variables before entering the trade.
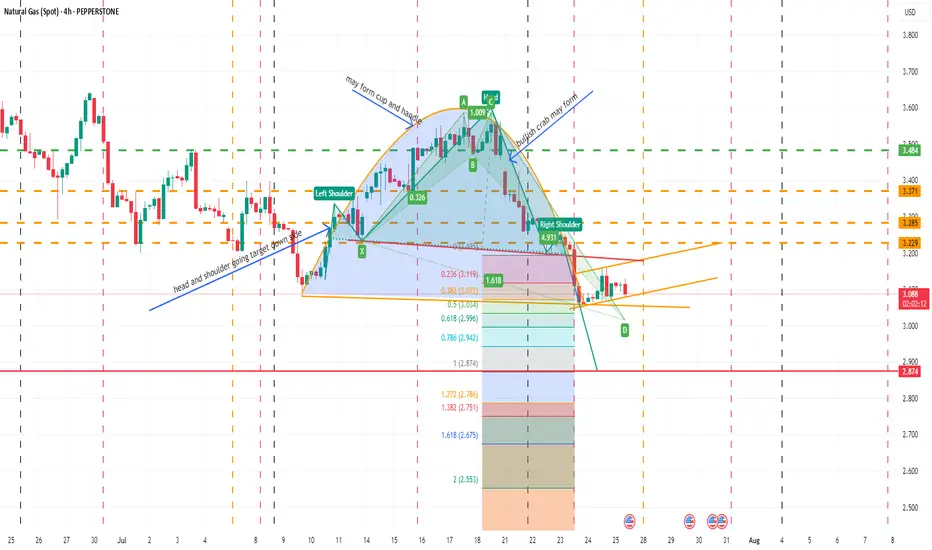
NATURAL GAS SPOTMay form inverse cup and handle, bullish crab also about to form , after completing one head and shoulder pattern already posted earlier new head and shoulder going on. In daily and 4 hr chart below ichimoku cloud. In weekly within cloud. Moving averages showing weakness in daily and weekly, monthly candle also no bearish. May be in such scenario bullish crab pattern may fail but need to be careful as over sold territory. Let see how all works in future though so far all as per analysis. I am not SEBI registered analyst.