SUI Long-Term H&S: Epic Crash Ahead?
SUI daily chart paints a clean Head and Shoulders pattern, pointing to a massive drop to around $0.83 by late Summer. As a fractal, this model also aligns with the trough-to-trough cycle from October 2023 to August 2024.
What do we think?
Head and Shoulders

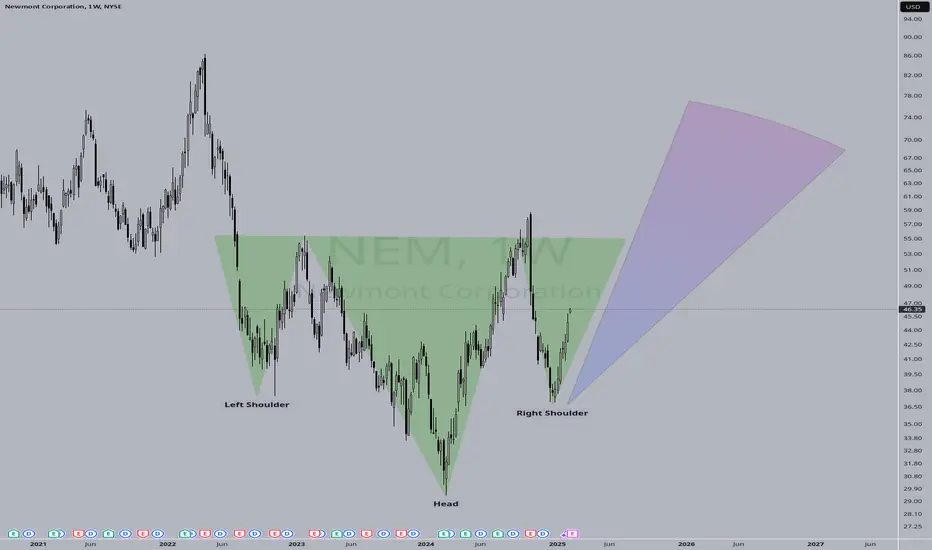
NEM H&SThis looks like an inverted Head and Shoulders doesn't it?
I wouldn't be surprised if this right shoulder had a double-bottom.
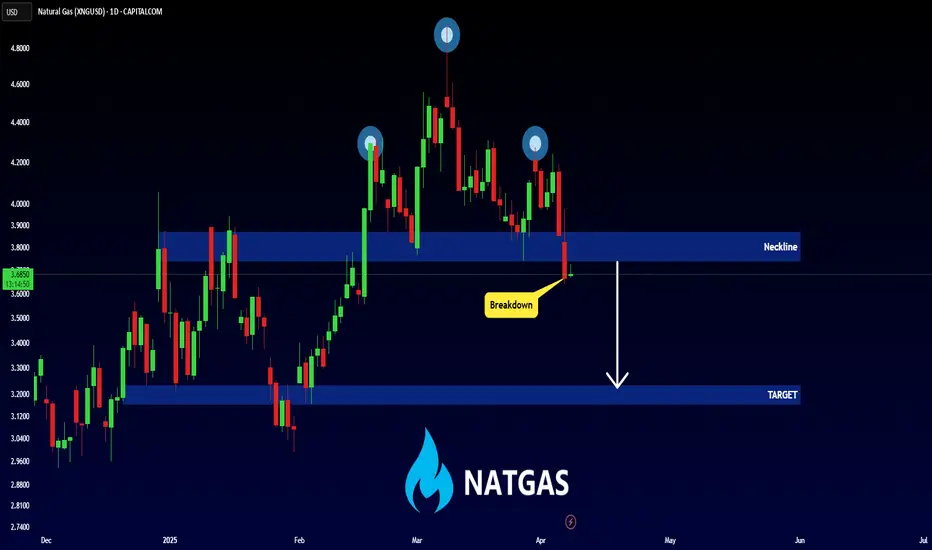
NATGAS - Bearish Head and ShouldersHello Traders !
The Natural Gas price formed a head and shoulders pattern.
Currently, The neckline is broken !
So, I expect a bearish move📉
_______________
TARGET: 3.2350🎯
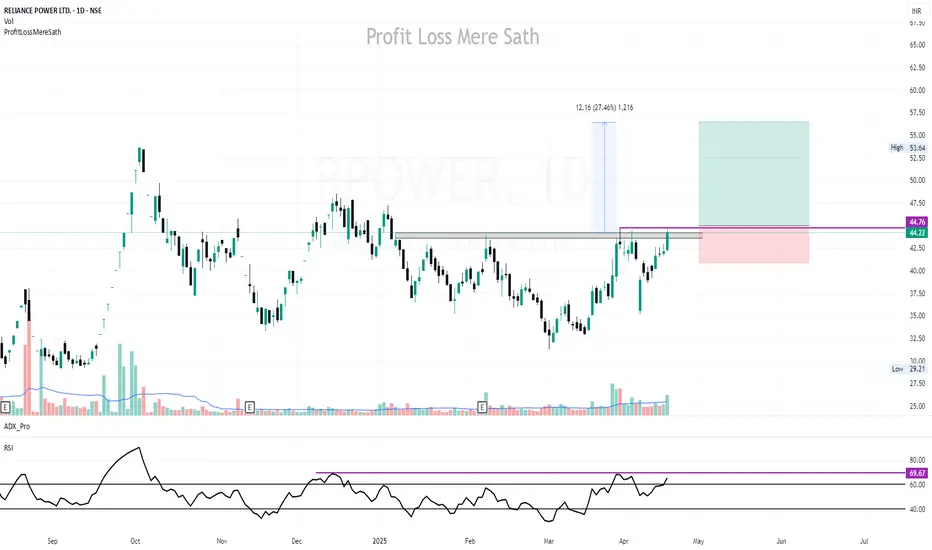
RPOWER | Buy @45 | Strict SL below 41 | Target 56, 2nd 74Disclaimer:
This is not financial advice. Please do your own research or consult with a financial advisor before making any investment decisions. Investments in stocks can be risky and may result in loss of capital.
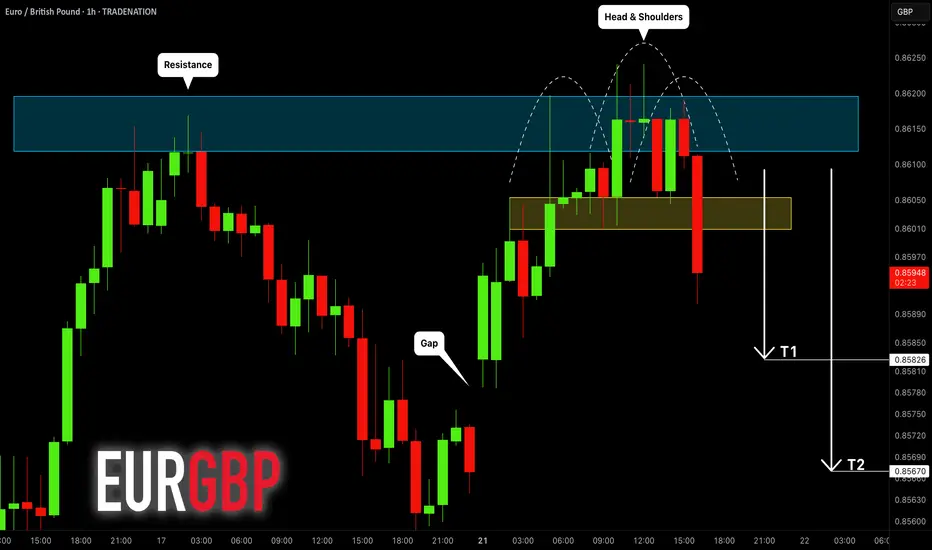
EURGBP: Gap is Going to Be Filled! 🇪🇺🇬🇧
I see a nice gap up opening on EURGBP.
After a strong up movement, the pair finally
leaves strong bearish clues.
I see a bearish breakout of a neckline of a head & shoulders pattern
on an hourly time frame after a test of a key intraday resistance.
It looks to me that the price is going to drop and fill the gap.
Goals: 0.8582 / 0.8567
❤️Please, support my work with like, thank you!❤️
I am part of Trade Nation's Influencer program and receive a monthly fee for using their TradingView charts in my analysis.
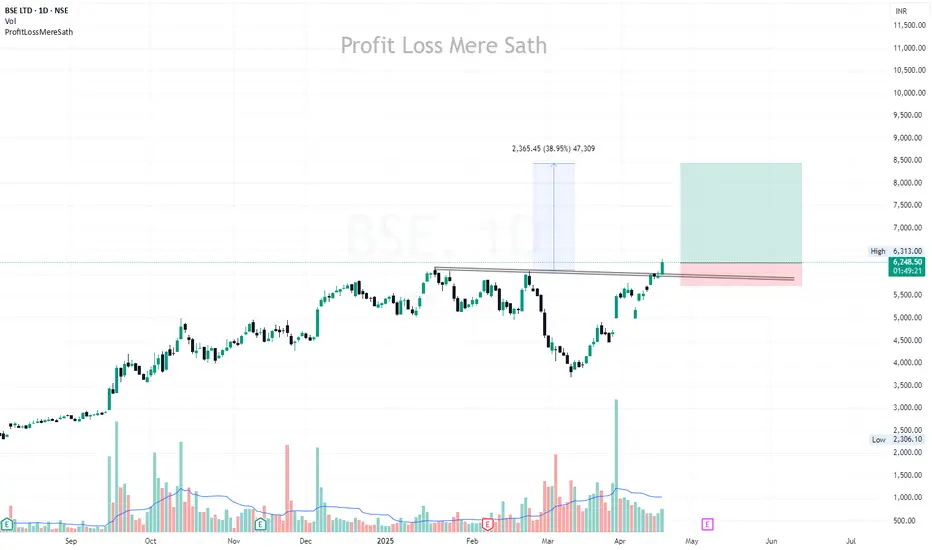
BSE | Buy @LTP | SL below 5700 | Target 8400Disclaimer:
This is not financial advice. Please do your own research or consult with a financial advisor before making any investment decisions. Investments in stocks can be risky and may result in loss of capital.
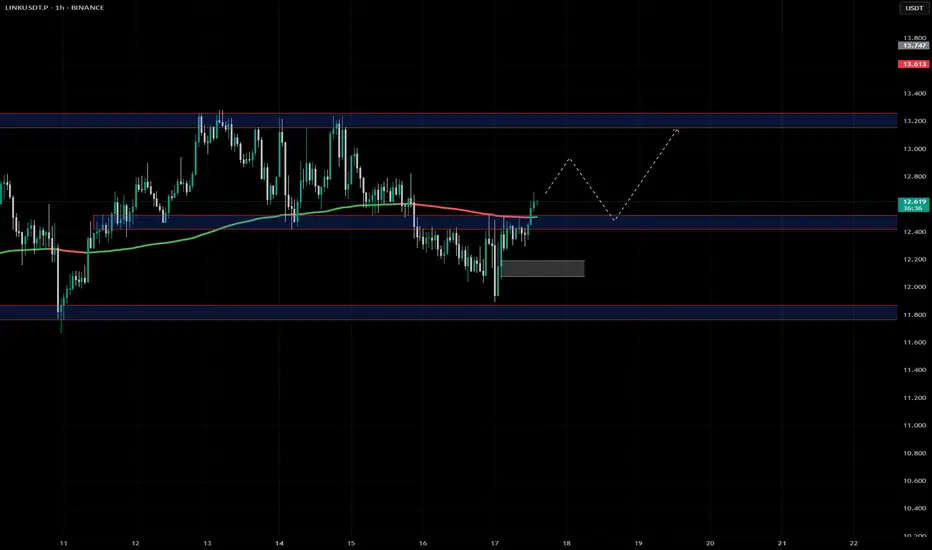
LINK OUTLOOKHello, TradingView community and my subscribers, please if you like ideas do not forget to support them with your likes and comments, thank you so much.
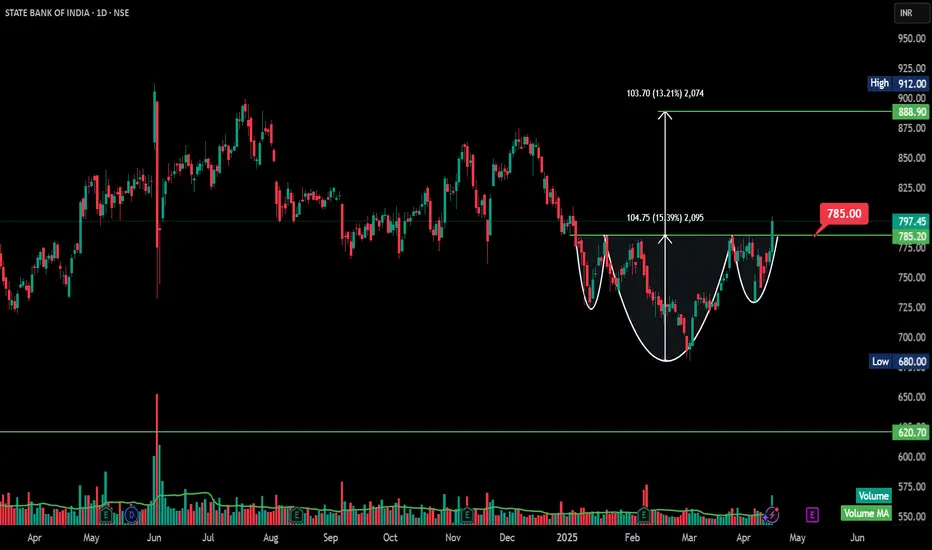
SBIN - Inverted Head and Shoulder - BreakOut- DailyThe chart clearly depicts Inverted Head and Shoulders (H&S)**, which is a **bullish reversal pattern**. Here's the updated analysis for **SBIN (State Bank of India)**:
---
### 🧠 **Pattern Recognition: Inverted Head & Shoulders**
- **Left Shoulder**: Formed in **early February 2025**
- **Head**: Deeper low formed in **early March 2025**
- **Right Shoulder**: Higher low formed in **early April 2025**
- **Neckline**: Around **₹785**, which has just been **broken on strong volume**
This pattern often marks the end of a **downtrend** and the beginning of an **uptrend**.
---
### 📏 **Measured Move Target**
- Neckline Breakout Level: ₹785
- Depth (Head to Neckline): ₹104.75
- **Target = ₹785 + ₹104.75 = ₹889.75**, which aligns almost exactly with the marked level of **₹888.90**
---
### 🔍 **Volume Confirmation**
- Volume has **increased notably** on the breakout candle, which is a **key confirmation signal** for H&S patterns.
---
### 🧱 **Support and Resistance**
- **Breakout support (neckline)**: ₹785
- **Next resistance levels**: ₹888.90 → ₹912
- **Downside support zones**: ₹775, ₹680 (head base), and major at ₹620.70
---
### 📌 **Summary**
- ✅ **Inverted Head & Shoulders** pattern confirmed
- ✅ Breakout above neckline with volume = bullish
- 🎯 **Target**: ₹889 (approx 11.5% upside from breakout)
- 🔄 Watch for potential retest at ₹785 for a low-risk entry
---
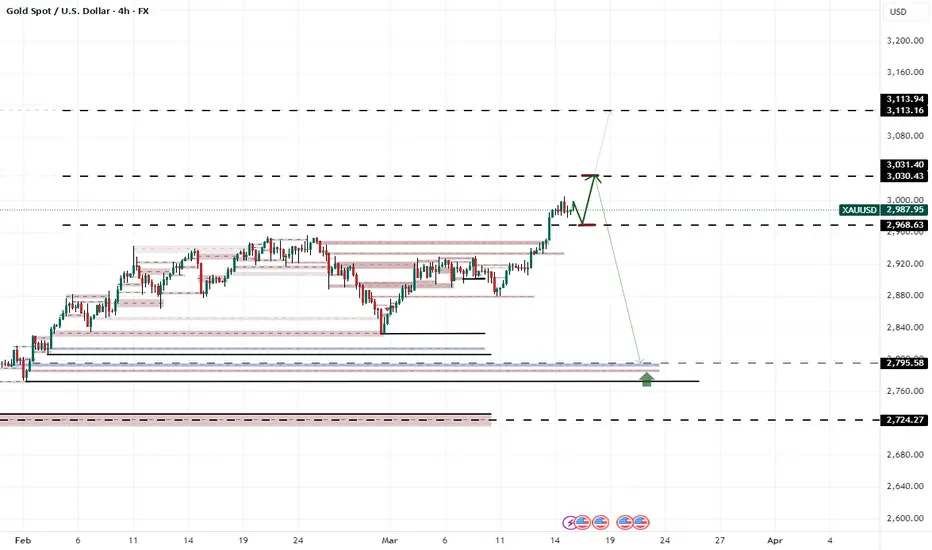
XAUUSD|LONGHello to all traders. I hope you stay more disciplined to your trading rules this week. The price has reached a global high, so the main bias is bullish. However, after identifying resistance levels with Fibonacci, I expect a pullback first, then a potential rise at the support zone. Watch how the price reacts to support and resistance lines, and wait for your entry signal in lower time frames. This analysis is just my personal view.
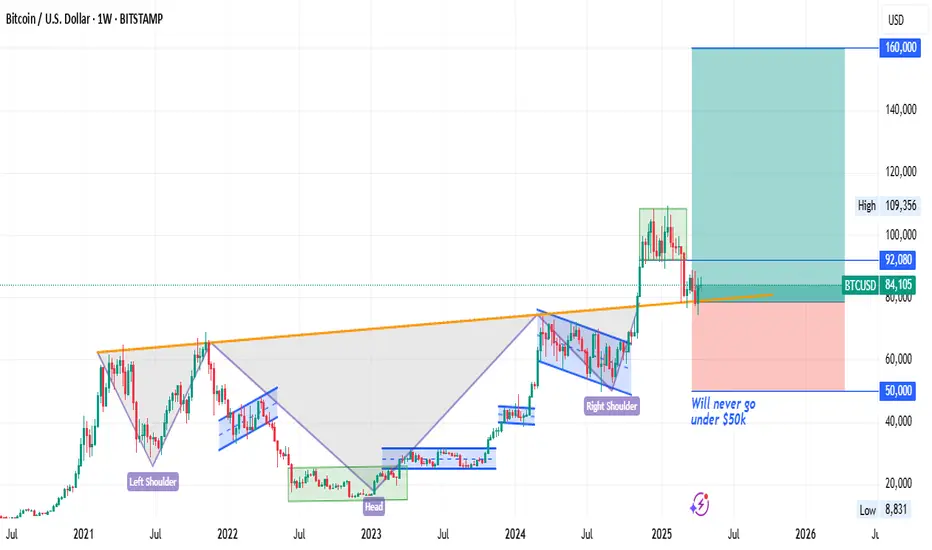
Inverted Head & Shoulders Pattern for BTC??!!!??!Bitcoin appears to be trading in an inverted h&s pattern.
Which coincides with a bullish breach of a Bullish Expanding Triangle highlighted in red to the upside!!
A double bottom is where the head of the inverted triangle can be formed, the space between the two bottoms forms the apex of the head of triangle.
First upside target of $90k USD
Second upside target is $260k USD

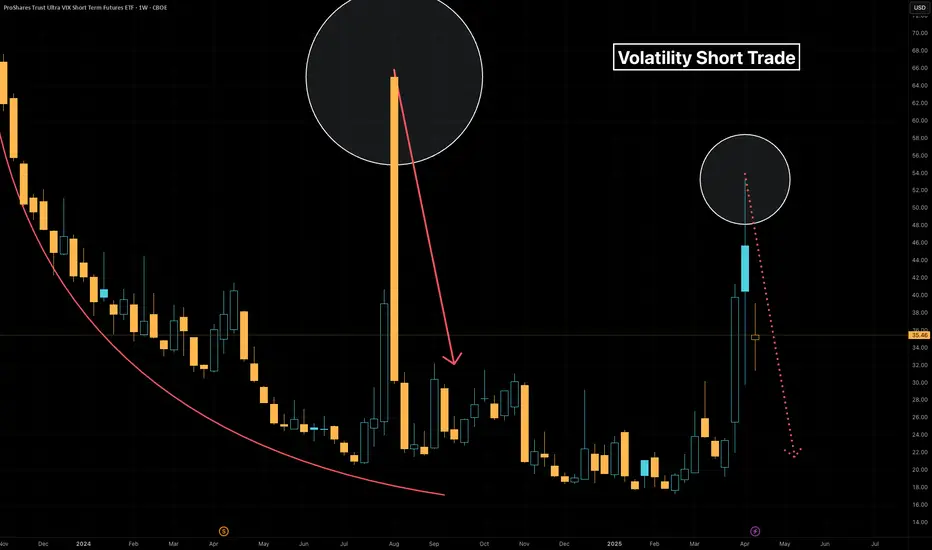
Short Volatility during rare spikes using leveraged ETF $UVXYOverview
Volatility represents how greatly an asset’s prices swing around the mean price. Historically there are rarely brief volatility flare-ups that present trading opportunities. Trying to anticipate volatile events can be costly, because other market participants generally expect the same well known events, and one never knows how big a volatility spike might arise from a given event. Instead if one merely awaits extreme volatility events, which historically are ephemeral, there's a higher probability trade in shorting it. I've thought about this previously, and took the opportunity with Liberation Day to successfully short volatility.
Volatility Instrument Selection
Choosing an appropriate instrument can aid in the likelihood of a successful short position. Among the options CBOE:UVXY looks attractive for the trade, because it's a leveraged ETF, is highly liquid, and provides options with granular strike prices and expiration dates. Leveraged ETFs are known to decline over time due to
Daily rebalancing and compounding effects
Volatility drag
Cost of leverage
Management fees and expenses
Path dependency
These characteristics of leveraged ETFs provide a structural tailwind to a short position, because the instrument naturally declines over time. This phenomenon easy enough to see on a CBOE:UVXY weekly chart
Moreover selection of a liquid product is prudent. At the time of writing CBOE:UVXY has an average daily volume north of $22 million dollars for the past 30 days.
Trade execution
Execution of the trade starts with recognition of a highly volatile event, this is both technical and discretionary. From there a trader is advised to use their preferred tactics to select entry, stop-loss and exit points. Personally I like to use chart patterns across different timeframes in tandem with Relative Strength Index, and to a lesser extent volume to identify trading setups. I use longer term charts to identify a trend, and shorter timeframe charts to determine entry and exit points. The timeframe(s) depend on the particular instrument and what the charts look like at the time of the trade.
During the Liberation Day Volatility Short trade, I've been using 1W, 1D, 4H and 1H charts.
The 1H chart has been suitable for entering an exiting trades. Head & Shoulders patterns have manifested both on price and momentum alongside declining volume. I've posted a couple CBOE:UVXY minds along the way.
Additional Thoughts
Volatility can also be used generally to anticipate moves in other asset classes, such as stocks, bonds, crypto and commodities. Using the levels from that last chart fed into successful NASDAQ:TQQQ & NASDAQ:SQQQ trades in the aftermath of Liberation Day.
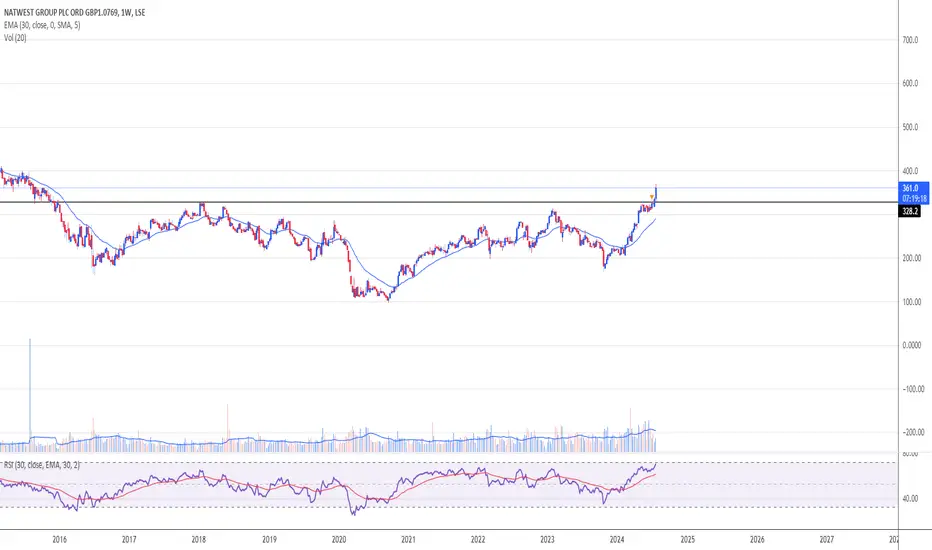
Nat West breakoutClear breakout from 327, which was established resistance since 2016. Inverse Head and Shoulders pattern completed.
Volumes have been ramping up since Feb this year and the shares are not oversold on the weekly RSI yet.
Market likes their results today too.
In my opinion, heading for 400p.
Do your own research and this is NOT a solicitation to hold, buy or sell.
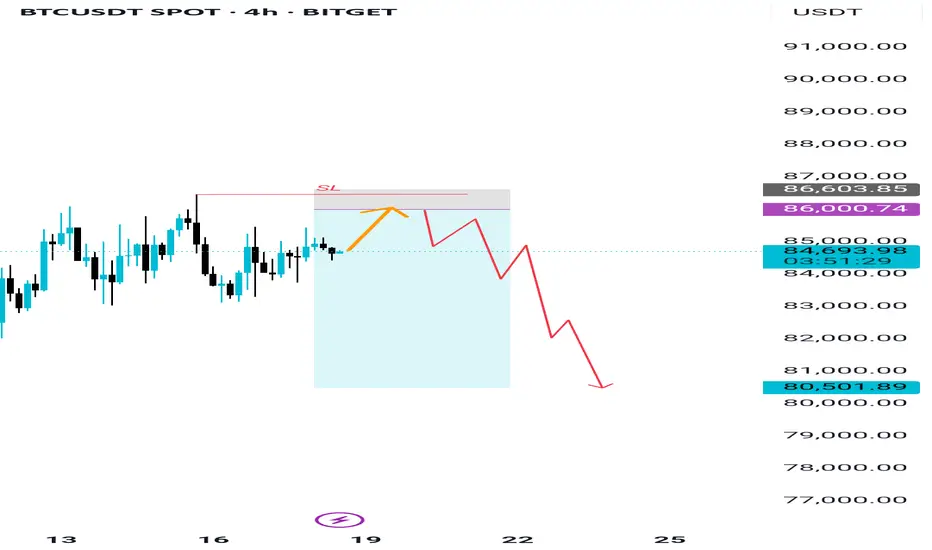
I'll Short BTC if? I'll Short BTC if I see it at 86k once again
Too much weakness on 4h time frame
But I'll use a tight stoploss there above the high
My tp will be at 81000 or 80000
But at the end I'll definitely wait for the confirmations on the lower time frames because without confirmations it's total loss in trading.
This trade is 1:10 risk to reward
So it does not hurts me but i don't know about your margin and capital.
So act accordingly manage your risk definitely.
Profit and loss all is yours I'm not responsible for your profit and loss.
I'm sharing my thoughts.
So let's see how it plays out,
One trade like this and you don't have to trade for months.
Wait for the prey like a lion 🦁
Regards Trader Scorpion 🦂
EURGBP Potential Head and Shoulders PatternOn the 4-hour chart, EURGBP has formed a potential head and shoulders top pattern. Currently, we can focus on the support around 0.8520. If it falls below, it will start to go down, and the downside target will be around 0.8450.

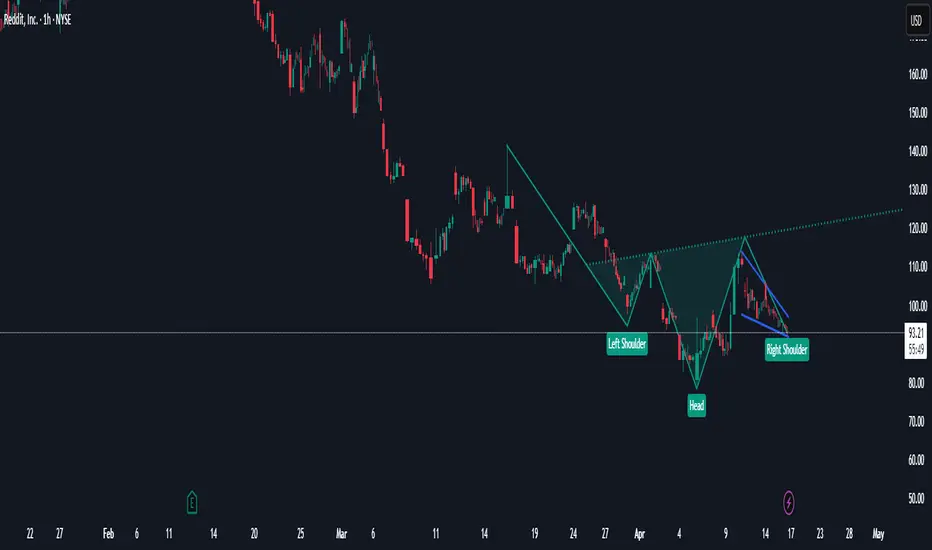
RDDT Long @ 93.44
It looks like there is a head and shoulders pattern lining up with a falling wedge pattern that could indicate a jump in RDDT share price. I'm entering a long position @ 93.44.
This is not investment advice and I'm just getting started with pattern analysis so please don't trust me :)
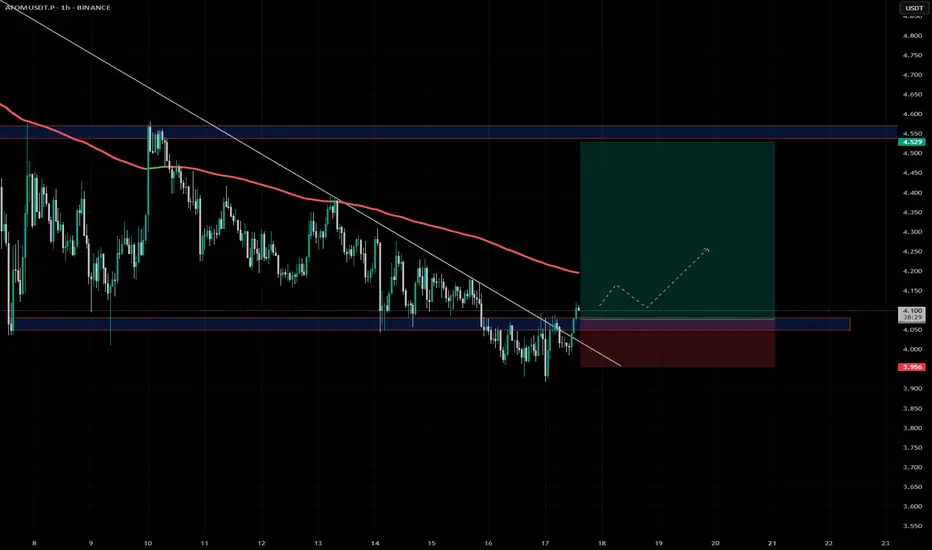
ATOM LONG/BUY SETUPHello, TradingView community and my subscribers, please if you like ideas do not forget to support them with your likes and comments, thank you so much and we will start a LONG/BUY outlook on #ATOMUSDT.P explained
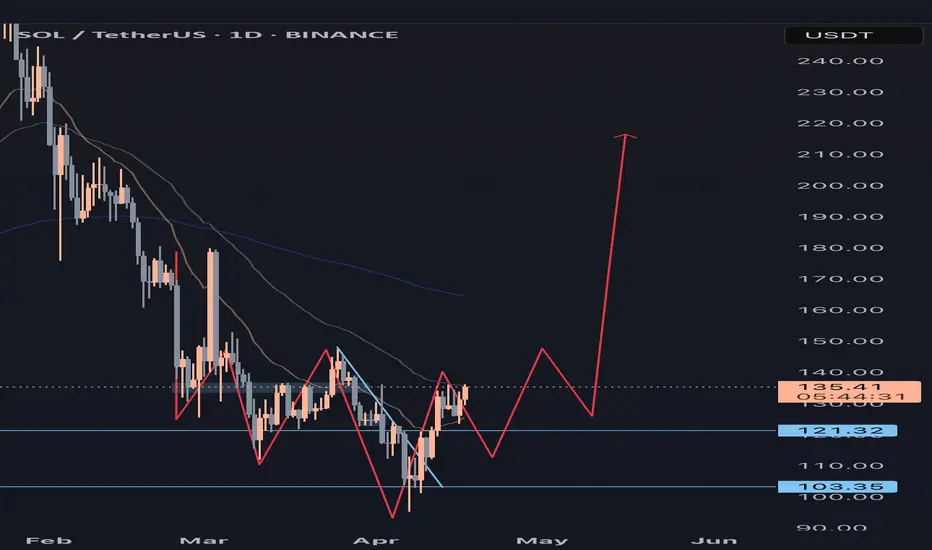
Solana (SOL) Market Overview – April 17, 2025As of April 17, 2025, Solana (SOL) is trading at approximately $134.55 USD, reflecting a 5.48% increase from the previous close.
⸻
📈 Technical Analysis
Price Action & Momentum:
• Recent Performance: SOL has rebounded from lows near $120 to around $134.55, positioning itself as one of the top-performing altcoins recently.
• Support & Resistance Levels:
• Immediate Support: $120 – Crucial for sustaining the current bullish momentum.
• Resistance Zone: $133 – $135 – A breakout above this range could unlock further upside.
Key Indicators:
• RSI: 53.90 – Neutral momentum
• MACD: -3.01 – Slightly bearish
• Stochastic Oscillator: 92.14 – Overbought territory
• ADX: 19.10 – Weak trend strength
⸻
🧭 Fundamental Analysis
Network Strength:
• High Throughput & Low Fees: Solana continues to dominate with its scalable and low-cost blockchain infrastructure.
Institutional Interest:
• ETF Activity: Five ETF filings as of March 2025 highlight increased institutional trust in Solana.
Market Sentiment:
• Fear & Greed Index: 29 – Market is in “Fear” zone, potentially creating long-term buying opportunities.
⸻
🔍 Summary
Solana is showing bullish recovery signs driven by positive price action and ETF momentum. However, technicals suggest a cautious approach in the short term due to overbought signals and weak trend strength. Fundamentally, Solana’s powerful infrastructure and institutional support could fuel long-term growth.
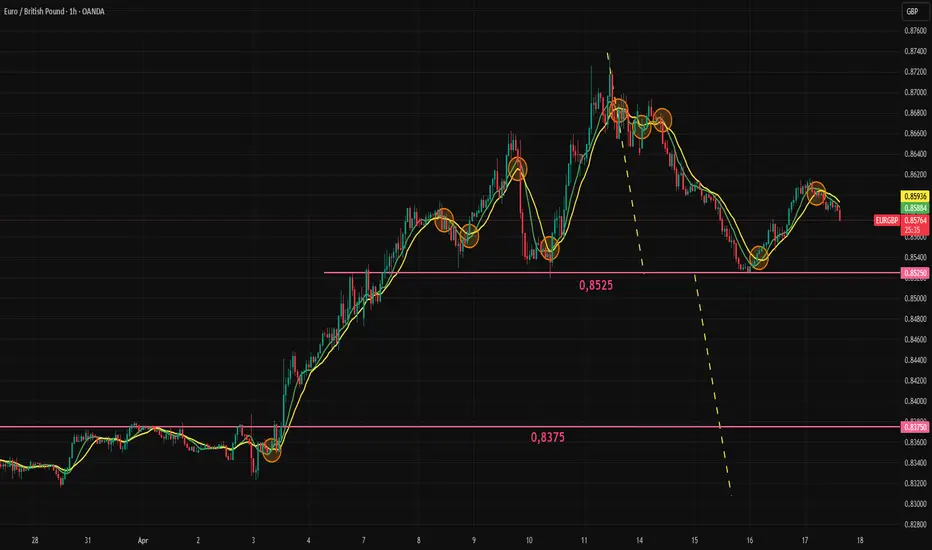
EURGBP Flashes Two Bearish Technical Signals Ahead of LagardeEURGBP is giving negative technical signals ahead of the Lagarde's press conferance. After Trump announced new tariffs, the euro surprisingly gained against the pound. The U.S. imposed tariffs twice as large on the EU compared to the UK, with a minimum of 10% on UK goods. Despite this, the pound weakened more than expected. However, this move might prove to be temporary.
The real focus of ECB will be on the outlook. Recent economic data, combined with the added pressure from tariffs, may push the ECB toward further rate cuts later this year.
President Lagarde has been cautious for some time, offering few forward-looking signals. Today, markets will be closely watching for any hint of future easing. If Lagarde sounds more dovish than expected, the euro could come under renewed bearish pressure.
EURGBP has been forming a head and shoulders-like pattern since the start of last week. It may currently be developing the second shoulder, depending on how the price moves today.
A combination of 8–13 hour moving average crosses and RMI sell signals on the 60-minute chart has successfully captured all local tops since April 7. These same signals have appeared again today. If they prove accurate once more, the 0.8525 support level will be key. This level represents the neckline of the potential head and shoulders pattern.
However, if EURGBP moves above 0.8620, the bearish setup would be invalidated.
XRP forms inv. H&S, suggesting a 21% upsideXRP is nearing a key trendline with an inverse head and shoulders pointing to a possible breakout. Watch 2.1974 closely. Targets at 2.47 and 2.67 offer strong risk-reward.
This content is not directed to residents of the EU or UK. Any opinions, news, research, analyses, prices or other information contained on this website is provided as general market commentary and does not constitute investment advice. ThinkMarkets will not accept liability for any loss or damage including, without limitation, to any loss of profit which may arise directly or indirectly from use of or reliance on such information.

EURUSD forms inverse head and shouldersEURUSD has stalled after testing key levels, but a new inverse head and shoulders is forming. We’re watching for a breakout above 1.1429, backed by correlated moves in GBPUSD and USDCHF. Triangle and flag patterns also point higher.
This content is not directed to residents of the EU or UK. Any opinions, news, research, analyses, prices or other information contained on this website is provided as general market commentary and does not constitute investment advice. ThinkMarkets will not accept liability for any loss or damage including, without limitation, to any loss of profit which may arise directly or indirectly from use of or reliance on such information.

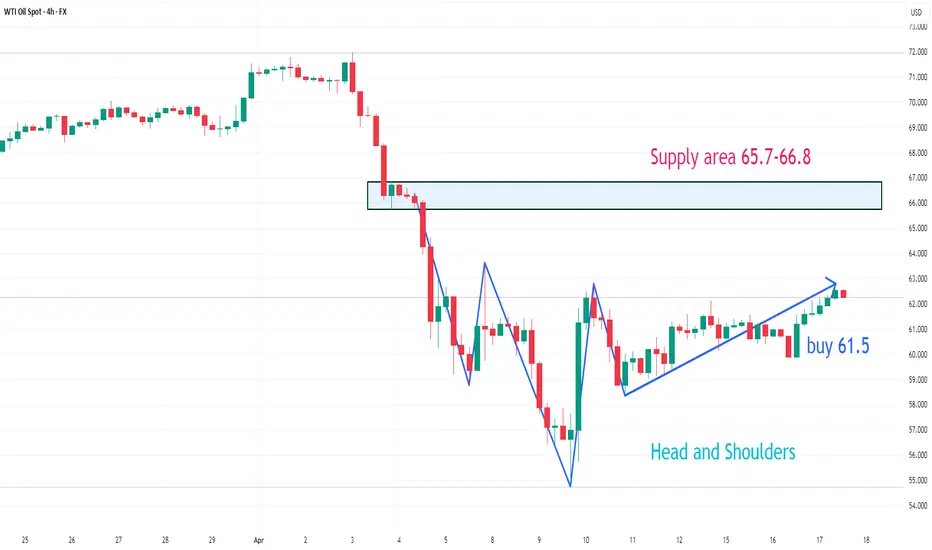
US CRUDE OIL (#WTI): Intraday Bullish ReversalUSOIL reached a significant level of support last week and formed an inverted head and shoulders pattern before bouncing back and breaking through a strong downward trend line.
This indicates strong buying pressure and suggests that the market may continue to rise. The next resistance level for to watch is at 65.32.

USOIL has formed a head and shoulders bottom patternOn the 4-hour chart, USOIL formed a head and shoulders bottom pattern. Currently, we can pay attention to the support near 61.5. If it falls back and stabilizes, we can consider buying. Pay attention to the resistance in the 65.7-66.8 area above.