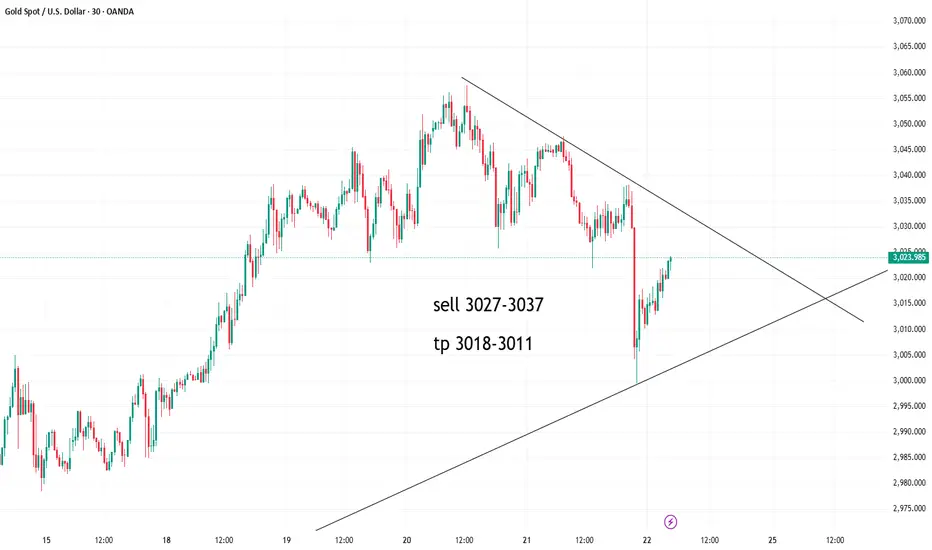
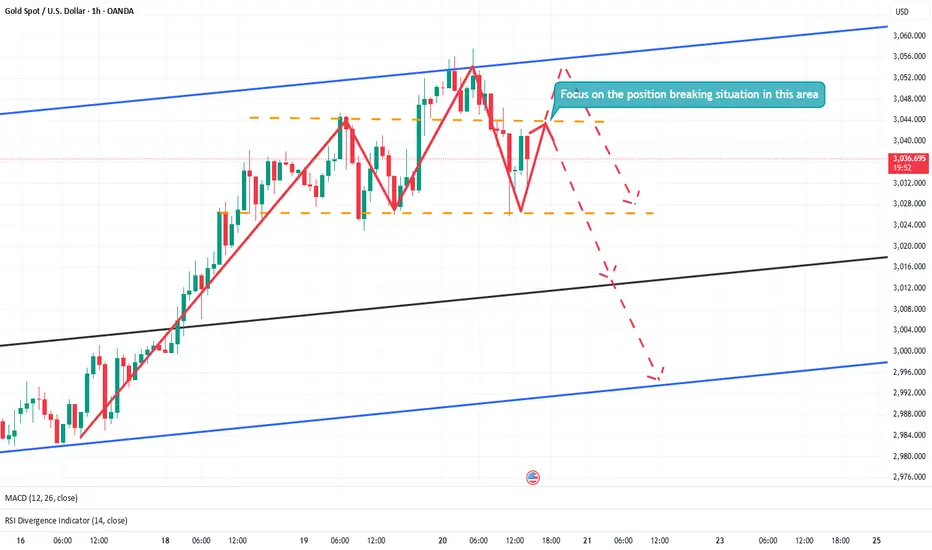
Golden Signal: Go Short in the 3027-3037 AreaLast Friday, gold rebounded to near resistance. Although the indicator in the 30M level chart shows that there is still some rebound momentum, the space is not very large, because the head and shoulders pattern has appeared in the early stage, and the pressure on the bulls is still very large.
Therefore, in the intraday trading on Monday, we can focus on short trading around the resistance area of 3027-3040. The single needle bottoming provides good support, so TP does not need to be set too large for the time being. The previous rising point of 3007 is used as a reference support, and TP is controlled in the range of $10-$16. Personally, it is expected to be in the 3018-3011 area.
I will update the specific trading information during the intraday, please pay attention to the content of the intraday update. If you have any questions, you can leave me a message, and I will reply to you in time when I see it.
I wish you all a prosperous new week!
Head and Shoulders
XRPUSDT Consolidating at ATHi see the consolidation as very young and it may need both : time and volume to gather serious weight in order to register new all time highs . I see a rare fractalized repetition of H&S patters on the lower timeframes which is up to end a toping pattern in the following days thus granting short term opportunities for shorting with significant R/R ratios

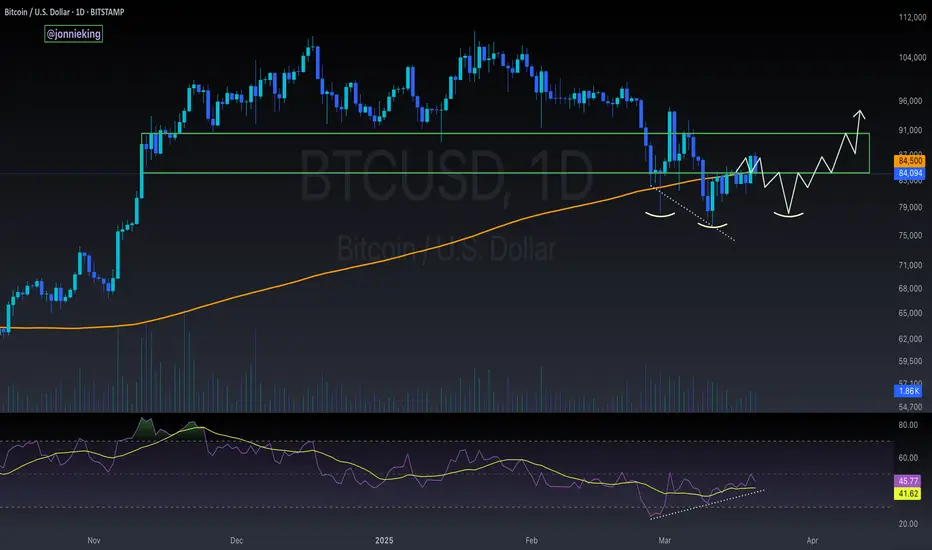
Potenial inverse head and shoulders pattern for Bitcoin This is the scenario I’m believing in for the near term for BINANCE:BTCUSD .
One more leg down to confirm the neckline around 78,300 USD.
Quick reversal price action to retest the 92,300 USD (ish) level.
If the breakout takes place to the upside, then I think we will retest the previous highs, with a higher probability of going much higher. Although I believe the tariffs will have a big impact on the USD (DXY index), which I believe will have a strong effect on BTC for the near term, around the coming 6 months. So, I believe the new high will most likely come in Q4 this year, making this cycle different from the historic crypto cycles. Although, there is still a chance that other countries will start to adopt more crypto-friendly policies for crypto or Bitcoin, making this thesis more uncertain. If the policies come out as positive, then I think there are good chances of reaching new highs earlier than Q4, 2025.

Tesler LT estimationA quick guess at Tesler at the long run, if reality continues against corporate and political manipulation of the stock.

XRP decision time !Hello Traders 🐺
In this idea, I want to talk about XRP, because in my opinion, the price is currently sitting at a critical decision-making area—and any moment could lead to a major move. So let’s take a look at the possible scenarios: 👇🔥
🟢 Bullish vs. Bearish – What’s Next?
First of all, we’re still in an uptrend, and as the saying goes: "The trend is your friend until the end." 📈 However, the current pattern forming on the chart—if it plays out—could mark the end of this uptrend, at least in the short term. 😬
On the flip side, there’s also a bullish scenario at play: a potential bull flag pattern. I’ve drawn it on the chart using the orange resistance line. If the price can break above this resistance, we could expect much higher targets—and I’ll definitely update you on those in my next posts. So make sure to follow me and don’t miss the train! 🚂🚀
and also remember :
🐺 Discipline is rarely enjoyable, but almost always profitable. 🐺

The Bear Awakens: A Perfectly Executed Short on Gold📍Over the past few days, I’ve consistently emphasized that the bear is on the verge of fully awakening, warmly inviting everyone to watch it dance. Today, gold has indeed pulled back to the 3000 level as anticipated, making our short position from the 3035-3045 range a resounding success!
📍Since gold has tested the 3000 level for the first time, a second test is highly likely. Therefore, the primary trading strategy remains focused on selling gold on rebounds. The head-and-shoulders formation continues to exert significant pressure, making a sustained breakout to the upside unlikely in the near term.
📍With this in mind, the resistance zone can be adjusted lower to 3025-3035. If gold fails to break through this region during its rebound, further downside movement is expected. In that case, gold will likely retest the 3000 level and could potentially breach it, extending losses towards the 2995-2985 range.
🔎Trade Idea:
Xauusd: Sell at 3025-3035
TP:3005-2995
SL:Adjust according to risk tolerance.
📩Trading means that everything has results and everything has feedback. I have been committed to market trading and trading strategy sharing, striving to improve the winning rate of trading and maximize profits. If you want to copy trading signals to make a profit, or master independent trading skills and thinking, you can follow the channel at the bottom of the article to copy trading strategies and signals
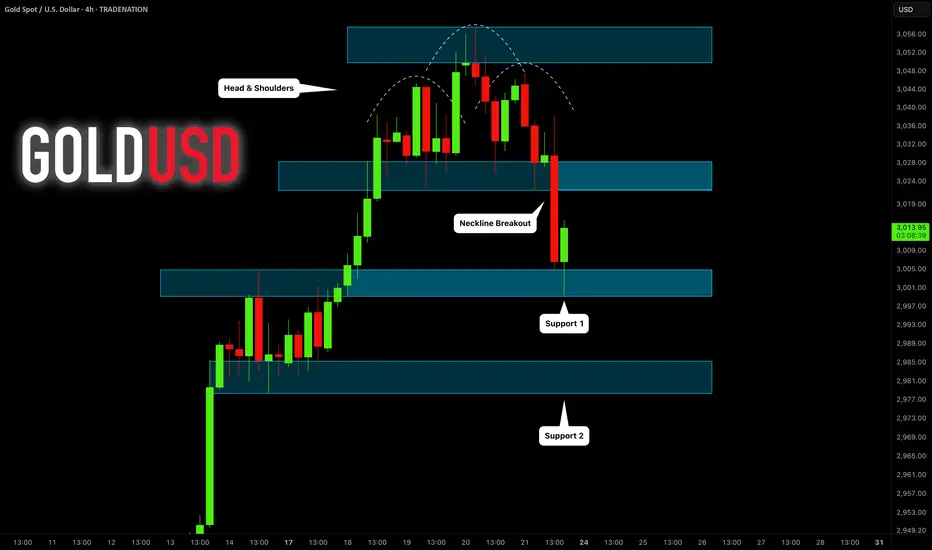
GOLD (XAUUSD): Selling Now is HIGH RISK
The head & shoulders pattern that I spotted earlier
perfectly played out and we saw a strong bearish move after the
NY session opening.
HOWEVER, be extremely careful.
Many traders started to sell heavily, anticipating an extended bearish reversal.
For now the price nicely respected 3000 psychological support
that previously was a resistance.
I suggest not placing any short trades this week.
Let's wait till Monday and how the market opens.
❤️Please, support my work with like, thank you!❤️
I am part of Trade Nation's Influencer program and receive a monthly fee for using their TradingView charts in my analysis.
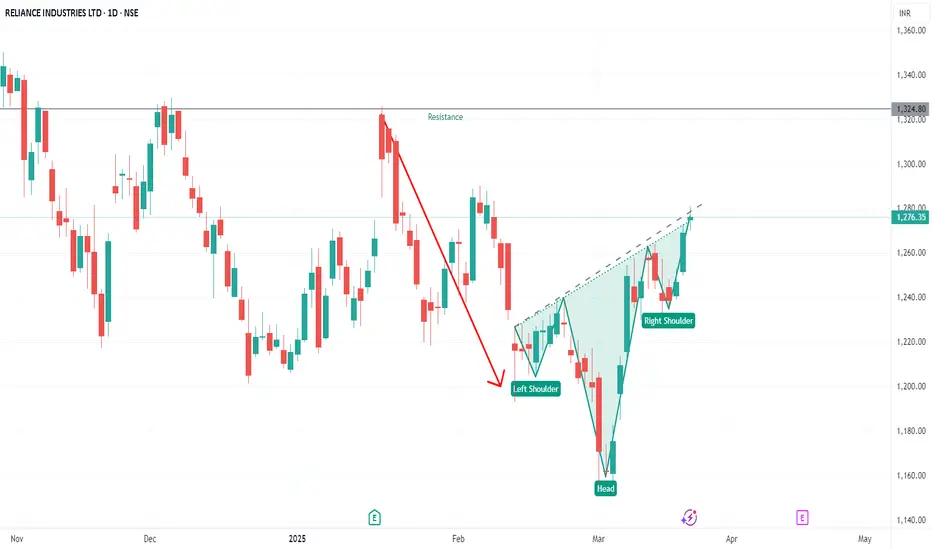
Reliance Ind, IHNS Formation on Daily TFafter a down trend Reversal Pattern Found Let`s What Happen In coming Days
The bearish trend will continue📍Since the day before yesterday, I've been sincerely inviting everyone to watch the bear dance.Gold has decisively broken below the recent support zone at 3030-3026 and extended its decline to around 3021. Based on this price action, two key conclusions can be drawn:
1. 3057 is now confirmed as the current high.
2. Gold has successfully formed a head and shoulders pattern in the short term.
📍This indicates that bearish momentum remains strong and far from exhausted. Under the pressure of structural resistance, gold is likely to continue testing lower support levels around 3010-3000, with a possible extension toward 2995.
🔎Trade Idea:
Xauusd: Sell at 3035-3045
TP:3015-3005
SL:Adjust according to risk tolerance.
📩Trading means that everything has results and everything has feedback. I have been committed to market trading and trading strategy sharing, striving to improve the winning rate of trading and maximize profits. If you want to copy trading signals to make a profit, or master independent trading skills and thinking, you can follow the channel at the bottom of the article to copy trading strategies and signals

Gold Perfect Candidate to ShortGold is moving in pattern forming head and should pattern at the top, This is perfect candidate to short
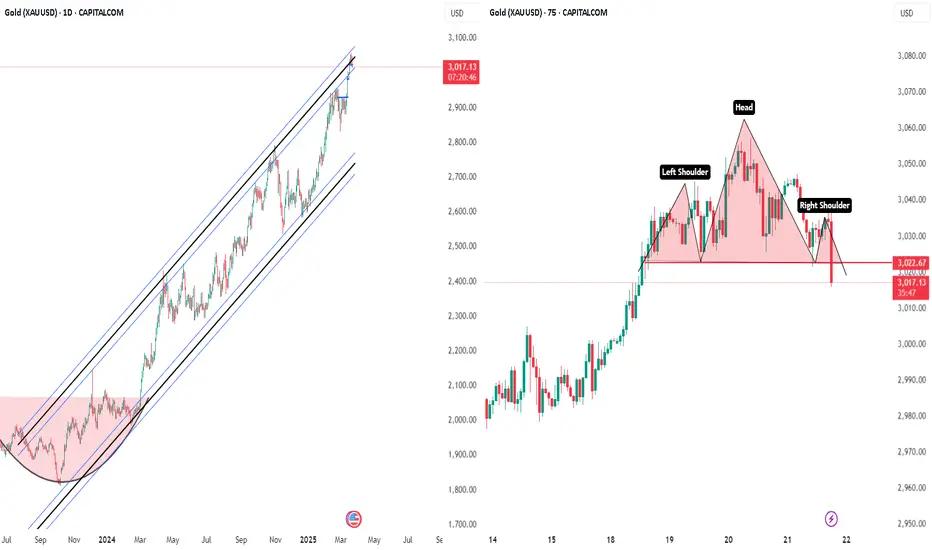
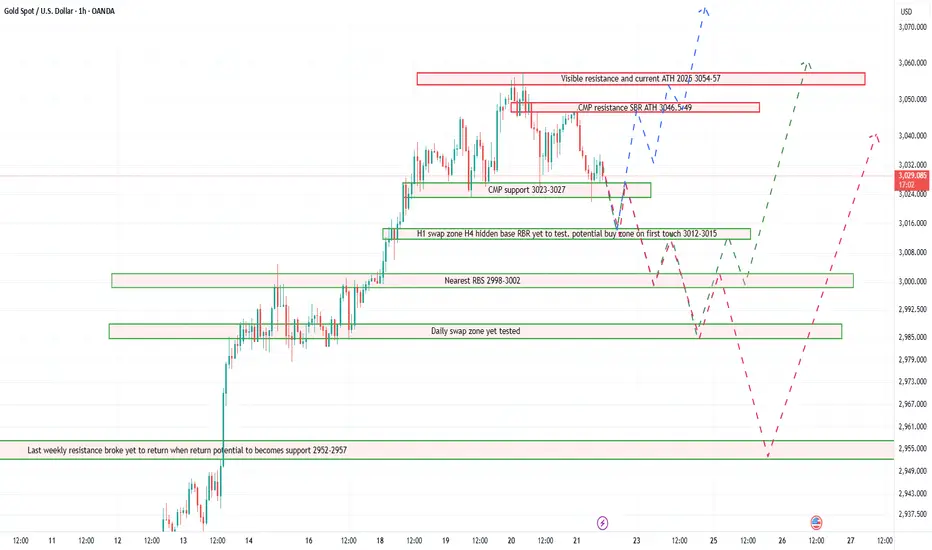
Gold is ready for retracementAs we can witness the current resistance and ATH stands at 3057.
yesterday gold did a strong pullback to the CMP support 3025 however fail to break above ATH support that currently becomes resistance for the current market price today.
I won't be trading at the current support area as in H1 full HNS has formed in this CMP which showing signs of a strong pullback to certain location that gold left a gap for the current bull run to cover it up potentially. only if it broke from current ranging then to decide on the trade with more clarity for gold towards its directions
In the bigger Timeframe for Weekly is still an uptrend. The bias is still buy at certain zones such as 3012-15 which a hidden H1 swap zone of H4 breakout this zone potential a good 80-100pip rejections area. need to monitor thou for this trade as it'll rate as still high risk.
next good zone with higher chance to win is 2998-3002, why, it took gold several touches in H1 and H4 to be able to finally break that resistance before it able to climb to the current ATH. target to win here atleast 100-150 pips. This trade would be rating as medium risk trade.
one more of most gold favourite area to sweep buyers is Daily swap zone which usually can contribute to a homerun trade of swing 1-3 days for a good 300-500pips standing in the area of 2984-2989.This trade would be rating as low risk trade
Last is the no Brainer trade when gold arrive to the location of previous ATH in weekly of 2956-54 area. This even a yolo trader can win atleast 200pips should provide a good rejections however usually it'll go deeper to chase those SL or margin call accounts and usualy can happen on great news week. will not happen today but if does its a sin not to take a trade there.
Nifty Media Index – Strong Reversal from Support! The Nifty Media Index has shown a strong bounce from a crucial support zone, gaining +10.83% in recent sessions. This move indicates a potential trend reversal!
📊 Key Observations:
✅ Support Retest Successful: The index held above the key 1,450-1,500 zone and bounced.
✅ Breakout Confirmation: Price is attempting to sustain above this level, signaling further upside potential.
✅ Next Resistance: The 1,650-1,700 zone could act as the next target.
⚠️ Trading Plan:
A sustained close above 1,550 could trigger further upside.
If the breakout sustains, 1,650-1,700 could be the next target.
Support at 1,450 should hold for a bullish continuation.

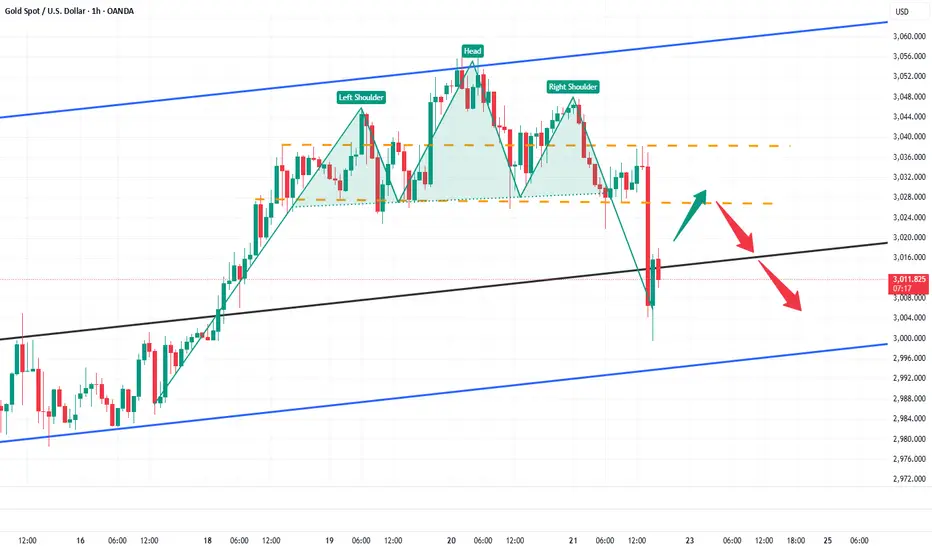
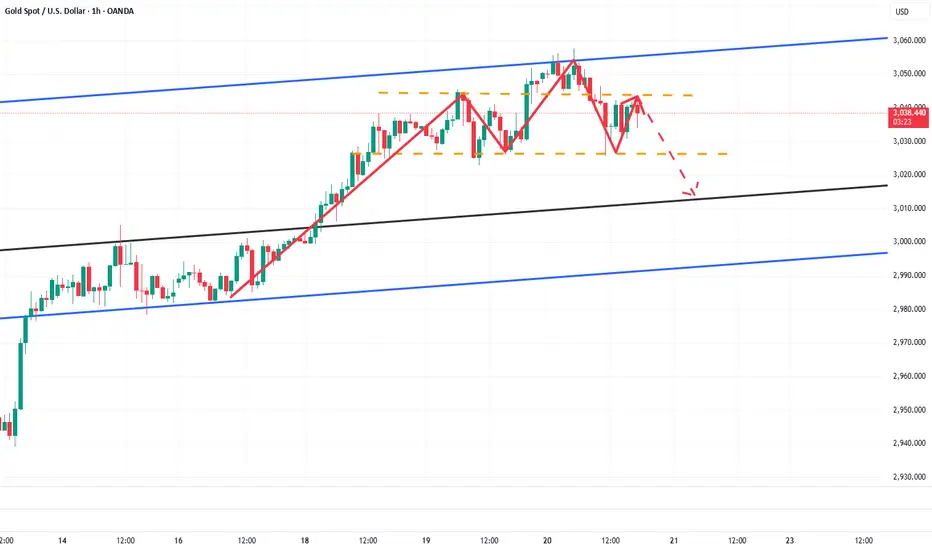
GOLD (XAUUSD): Correctional Movement Ahead?After experiencing a strong uptrend, ⚠️Gold appears to be overbought.
By analyzing the 4H chart, we can see a complete head and shoulders pattern.
A bearish trend will be confirmed if the price breaks below the horizontal neckline.
If a 4-hour candle closes below 3022, we can anticipate a significant pullback to around 3000.

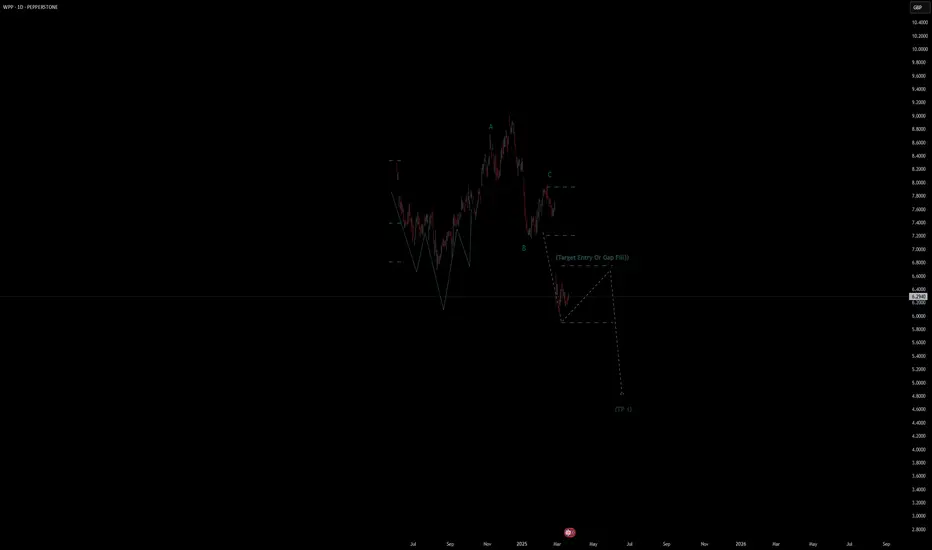
WPP Stock Quote | Chart & Forecast SummaryKey Indicators On Trade Set Up In General
1. Push Set Up
2. Range Set up
3. Break & Retest Set Up
Notes On Session
# WPP Stock Quote
- Double Formation
* Retracement & Inverted Pattern | Completed Survey
* ABC Wave Feature | Reversal Entry | Subdivision 1
- Triple Formation
* (Target Entry Or Gap Fill)) | Subdivision 2
* (TP1) | Subdivision 3
* Daily Time Frame | Trend Settings Condition
- (Hypothesis On Entry Bias)) | Indexed To 100
- Position On A 1.5RR
* Stop Loss At 80.00 GBP
* Entry At 75.00 GBP
* Take Profit At 65.00 GBP
* (Downtrend Argument)) & Pattern Confirmation
* Ongoing Entry & (Neutral Area))
Active Sessions On Relevant Range & Elemented Probabilities;
European-Session(Upwards) - East Coast-Session(Downwards) - Asian-Session(Ranging)
Conclusion | Trade Plan Execution & Risk Management On Demand;
Overall Consensus | Sell
Gold Daily AnalysisPrice has been ranging in the lower timeframes after making a fresh high of around 3057. There are no significant data releases today so it could range further between the red resistance and green support zone. However, since today is Friday, we could see an end of week profit booking, which could make the way for some sells. But beware that gold has been in a massive uptrend fueled by geopolitics, and it could make a way up at any time. Any sells may have to be accompanied by regular profit booking and continuous monitoring since price to spike up at any time based on war tensions or tariff news.

Boldly short gold, the bear has awakened!📌Bros, as mentioned in the previous article, Marvin invites you to grab a cup of coffee and quietly watch the dancing bears.
📍As I just said, if gold cannot break through the 3040-3050 area, it will build a head and shoulders structure in the short-term structure, and gold may accelerate downward to the 3020-3010 zone.
🔎Xauusd: @3040-3050 Sell
📩Trading means that everything has results and everything has feedback. I have been committed to market trading and trading strategy sharing, striving to improve the winning rate of trading and maximize profits. If you want to copy trading signals to make a profit, or master independent trading skills and thinking, you can follow the channel at the bottom of the article to copy trading strategies and signals
$BTC Battle at 200DMA - Bullish DivergenceThe 200DMA is the real battle for bulls and bears rn.
At least PA is respecting my squiggles 😊
Bullish Divergence is the key here.
Watch as the bears are about to dance!📍Bros, we must pay attention to the 3040-3050 area next. If gold cannot break through this area during the rebound, then the technical level may build a head and shoulders top structure, further stimulating the decline of gold. The market bullish factors for gold have all appeared. If there is no extra force to support the rise of gold, then the bears will fully wake up and may even go down to the 3020-3010 area.
📌So in terms of short-term trading, we can try to short gold in the 3040-3050 area.
🔎Xauusd:@3040-3050 Sell
📩Trading means that everything has results and everything has feedback. I have been committed to market trading and trading strategy sharing, striving to improve the winning rate of trading and maximize profits. If you want to copy trading signals to make a profit, or master independent trading skills and thinking, you can follow the channel at the bottom of the article to copy trading strategies and signals
SILVER (#XAGUSD): Bearish Reversal ConfirmedSilver formed a classic head and shoulders pattern on the 4-hour chart.
Following the release of US fundamentals today, the price quickly dropped significant and broke below the pattern's neckline.
The price currently retesting the broken neckline, suggesting a potential continuation of the bearish reversal.
The next support levels to watch for are at 33.05.

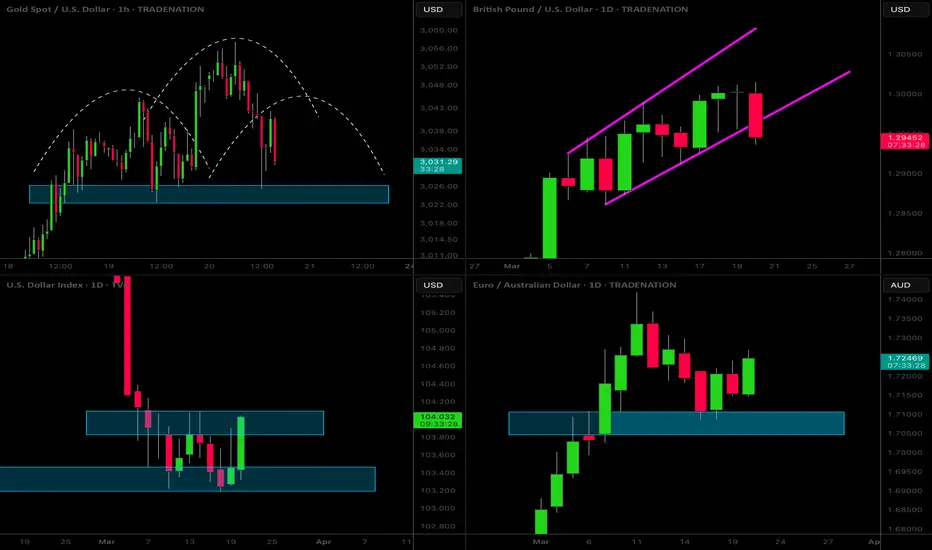
MarketBreakdown | GOLD, GBPUSD, DOLLAR INDEX, EURAUD
Here are the updates & outlook for multiple instruments in my watch list.
1️⃣ #GOLD XAUUSD 1H time frame 🥇
Earlier on Sunday, I shared a completed head & shoulders pattern on Gold.
Its neckline was respected and the price bounced from that, setting a new historic high.
That same neckline is now a perfect base for a new head & shoulders pattern.
The plan remains the same, if the price violates and closes below that
a correctional movement will be expected.
2️⃣ #GBPUSD daily time frame 🇬🇧🇺🇸
GBPUSD looks weak and shows a clear signs of a strong overbought state.
We see a breakout attempt of a rising parallel channel at the moment.
Daily candle close below that will trigger a correctional movement with a high probability.
3️⃣ DOLLAR INDEX #DXY daily time frame 💵
Dollar Index shows clear strength after 2 recent US fundamental releases.
The last obstacle for the bulls is the underlined blue resistance,
its breakout and a daily candle close above will trigger more growth.
4️⃣ #EURAUD daily time frame 🇪🇺🇦🇺
It feels like the pair is returning to a global bullish trend.
The price has recently retraced and perfectly respected the underlined support.
With a high probability, we will see a test of a current high soon.
Do you agree with my market breakdown?
❤️Please, support my work with like, thank you!❤️
❤️Please, support my work with like, thank you!❤️
I am part of Trade Nation's Influencer program and receive a monthly fee for using their TradingView charts in my analysis.
My Daily $NGAS / $NG1! Idea Because of Absent Seasonal WeaknessSeasonal weakness in FX:NGAS / NYMEX:NG1! is absent so far but it could come into play if war-related concerns are fading with Putin and Ukraine set under "friendly pressure" to end this war.
Still, the gap between ending heating period and beginning demand for cooling is big enough to see a seasonal weakness period, imo.
It's just an idea. As always, do your own research. You are solely responsible for your trades.
Disclaimer
The information and publications are not meant to be, and do not constitute, financial, investment, trading, or other types of advice or recommendations

IKIO Lighting - Bullish Breakout!IKIO Lighting Ltd has given a strong breakout above the trendline resistance with a sharp move of +27.2% from recent lows. 🔥
Price has broken the downward trendline, signaling a potential reversal.
High volume on the breakout confirms strong buying interest. 📈
A successful retest of the trendline could provide a good buying opportunity.
If the momentum continues, price may rally towards ₹300+ in the coming sessions.
Disclaimer:
This is not financial advice. Please do your own research or consult with a financial advisor before making any investment decisions. Investments in stocks can be risky and may result in loss of capital.

BITCOIN (BTC/USD): Update & The Thing to WatchTake a look at the price movement of ⚠️BITCOIN, the market is consolidating around a significant daily support level.
Analyzing a 4-hour chart, I spotted a descending trend line and a potential inverted head and shoulders pattern.
The left shoulder and head have already formed, and the right shoulder is currently in progress.
The neckline for this pattern is between 83,600 and 84,488.
The trigger to buy BITCOIN will be its bullish breakout (4h candle close above), could signal a buying opportunity for BITCOIN with a target range of 88,000 to 90,000.
⚠️However, if the price drops to a new low, the pattern will no longer be valid.
