PCG Weekly Swing Trade | High-Probability Reversal Zone📍 Ticker: PCG (Pacific Gas & Electric Co.)
📆 Timeframe: 1W (Weekly)
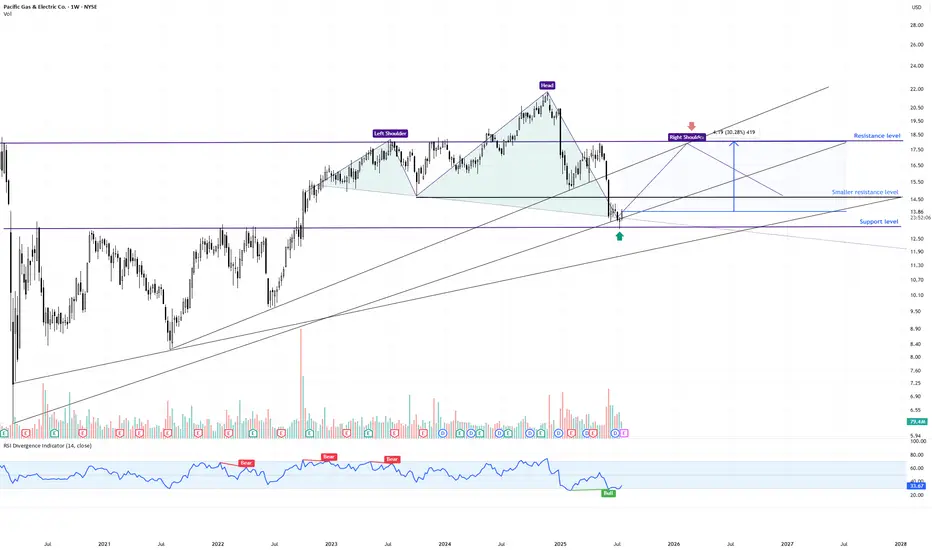
💡 Pattern: Head & Shoulders Formation – Testing Neckline & Long-Term Support
📉 Price: $13.87 (current weekly level)
📊 Volume: 78M
📉 RSI: 33.7 → oversold zone brewing
🔍 What the Chart is Showing
PCG is in the late stages of a Head & Shoulders pattern, but the right shoulder is still developing. Price is now pressing into a critical confluence area where multiple factors intersect:
✅ Neckline zone from the potential H&S structure
✅ Multi-year ascending trendline support (2020 origin)
✅ Horizontal support cluster from 2022–2023 consolidation
✅ Weekly RSI hovering near oversold, hinting at possible bullish divergence
Importantly, the H&S is not yet confirmed – it would require a decisive weekly close below the neckline to trigger a textbook breakdown.
🧠 Swing Trade Scenarios
➡️ Bullish Reversal Scenario (Failed Breakdown)
🟢 Entry Zone: $13.60–$14.00
🎯 Target 1: $14.62 (initial resistance pivot) - close 30-70% of the position
🎯 Target 2: $17.80–$18.50 (major resistance) - close the another 30-70% of the position.
⛔️ Stop-Loss 1: Close below $13.20 (neckline break confirmation)
➡️ Bearish Breakdown Scenario (Pattern Confirmation)
❌ If PCG closes below $13.20 on the weekly, it confirms the H&S → opens downside toward $11.50 (the lowest trendline support)
⚠️ What Makes This Week Critical
📌 A hammer-like candle is forming – but needs a strong weekly close to indicate buyer absorption
📌 A close above $14.00 would weaken the H&S formation, hinting at a failed pattern
📌 A close below $13.20 would confirm the bearish continuation
This is a decision zone: either the right shoulder fails, triggering a deeper swing lower, or buyers defend and negate the pattern.
💬 Will PCG confirm the weekly H&S breakdown or trap bears with a failed pattern bounce?
✅ This week’s close will define the next major swing move!
LIKE & FOLLOW for more professional swing setups with clean risk/reward.
#PCG #SwingTrade #Utilities #TargetTraders #TechnicalAnalysis #HeadAndShoulders
Head and Shoulders
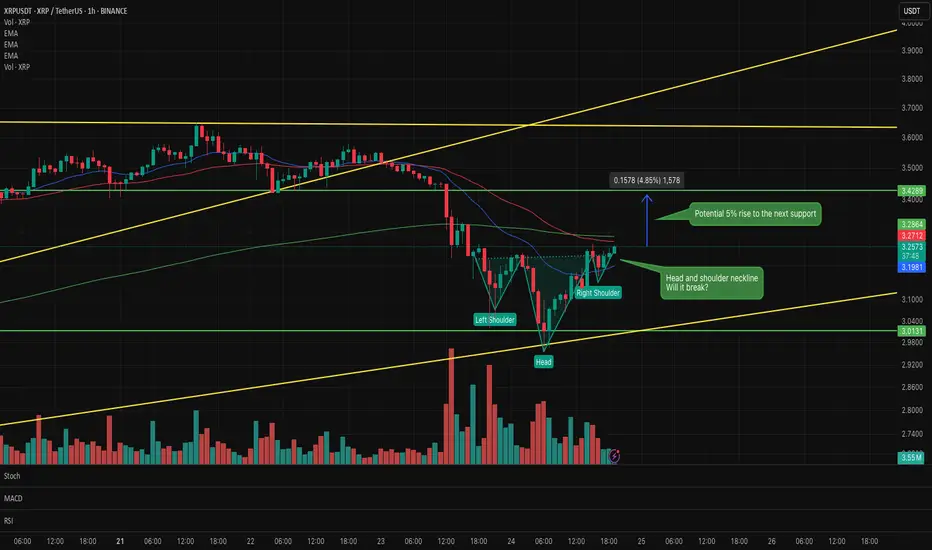
XRP 1hr Inverse head & shoulder formingXRP 1 hr chart inverse head and shoulders forming.
If it breaks the neckline it could break out for a 5% rise to the next resistance.
Watching this closely over the next few hours for confirmation.

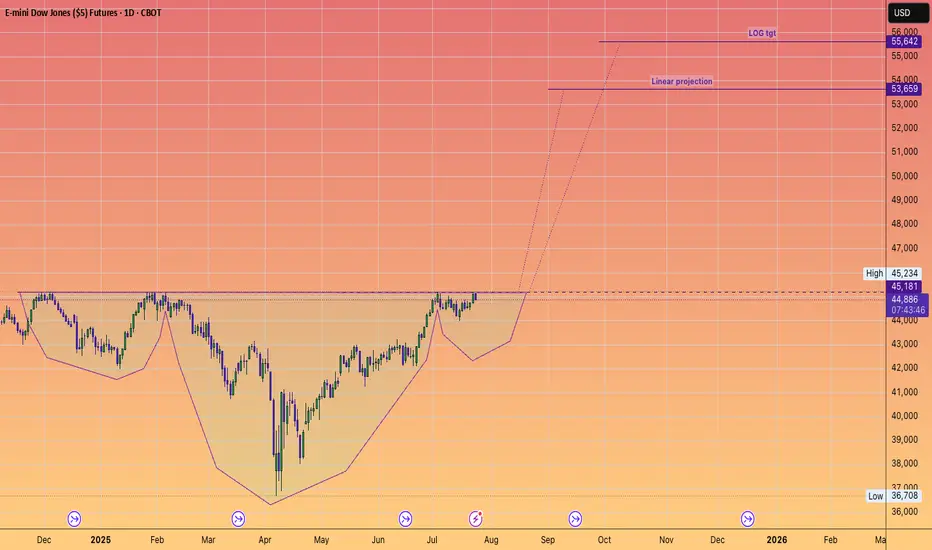
DOW JONES to 55,642#InverseHead&Shoulders
Projects record new highs.
Another stepping stone to our long held forecast of 64,000
Why?
Because AI will significantly contribute to an EXPANDING #GDP
Bullish Breakout Watch on Inverted Head & ShouldersSteel Dynamics ( NASDAQ:STLD ) is consolidating on the daily chart but forming an inverted head and shoulders (IHS) pattern, signaling potential bullish reversal. Neutral until breakout above 140 pivot, but bias leans bullish with supportive steel fundamentals. Long idea on confirmation; current price ~132-135 (as of July 23, 2025). Upside targets offer strong risk-reward if triggered.
Thought Process Walkthrough:
Spotting the Setup: Scanned steel stocks amid sector rebound signals. STLD's daily chart shows a downtrend bottoming at 107, forming IHS: head at 107 support, shoulders higher, neckline ~140. Overlaid rectangular consolidation (107-151.5) adds confluence for breakout potential.
Technical Tools: Used trendlines (descending from highs, capping at 140-151.5), pivot points (140 key reaction level), and classic patterns. No indicators needed—price action clear: volume up on rallies, RSI neutral ~50. IHS target: measure 33-point head-to-neck, add to breakout → ~173 (adjusted to 185 for prior highs). Rectangular height ~44 points → 208 target.
Key Levels:
Support: 107 (IHS head, historical low—break invalidates bull case).
Resistance: 151.5 (rectangular top, past peaks—break above 155 confirms momentum).
These are significant due to repeated price reactions, providing high-probability zones.
Prediction: Consolidation now, but bullish breakout likely if 140 clears on volume, driven by pattern resolution and fundamentals. Without it, range-bound neutrality persists.
Fundamentals Supporting Thesis:
US steel outlook for 2025 shows moderate growth: CAGR ~2.4% through 2030, driven by automotive and construction demand. Economic moderation but robust drivers like infrastructure spending position the sector. For NASDAQ:STLD STLD, Q2 2025 EPS $2.01 missed estimates but operating income rose 39% despite challenges; revenue $4.57B, EBITDA $533M. Management eyes profitability acceleration into 2026 via efficiencies and demand While global capacity rises ~6.7%,US protections and STLD's strong balance sheet support upside.

BREAKING – US to Unveil Key Crypto Report: Crucial Moment for BiIn what could be a watershed moment for the digital asset industry, the U.S. government is expected to release a major crypto policy report in the coming days. Sources suggest the report will outline a framework for regulating digital assets, including Bitcoin, stablecoins, and DeFi—potentially defining how crypto will be governed in the world's largest economy.
Why This Report Matters Now
Amid rising political and economic pressure, the U.S. is being forced to take a firmer stance on crypto. With the 2024 elections behind and growing institutional participation, Washington is no longer able to delay key decisions.
Expected highlights of the report include:
Clarification on whether certain crypto assets are securities
Guidelines for stablecoin regulation
A potential roadmap for central bank digital currency (CBDC) development
Recommendations on DeFi and wallet service compliance
The report comes at a time when market volatility and fragmented oversight have led to investor uncertainty and inconsistent enforcement across states and agencies.
Possible Scenarios: Boom or Bust
Pro-Bitcoin Outlook
If the report favors clear rules, supports innovation, and endorses Bitcoin as a commodity (as the CFTC suggests), it could trigger a strong market rally. Institutional players sitting on the sidelines may finally enter.
Harsh Regulation
On the other hand, if the report leans toward heavy-handed enforcement—especially targeting self-custody, privacy, or DeFi—it could stifle innovation and lead to capital flight to offshore markets.
Neutral-but-Positive
A middle-ground report offering regulatory clarity without immediate enforcement could calm markets and lay the foundation for measured growth.
What’s at Stake for Bitcoin?
Bitcoin’s status in U.S. law remains technically undefined, though it’s generally viewed as a commodity. A clear statement reaffirming this status could fuel renewed institutional demand, ETF expansions, and deeper integration with traditional finance.
Conversely, if Bitcoin is lumped into broader regulatory restrictions, especially around AML or taxation, it could face new compliance burdens—dampening short-term momentum.
How the Market Is Reacting
Ahead of the report, Bitcoin has shown elevated volatility. Whales appear to be repositioning, with increased activity across derivatives markets and stablecoin inflows—indicating expectation of major movement.
Traders are watching key support at $56,000 and resistance near $60,000. A clear policy win could break this ceiling fast.
Conclusion
The upcoming U.S. crypto report could mark a historic regulatory pivot. For Bitcoin and the broader industry, the stakes are high: legitimacy, liquidity, and long-term growth—or repression and stagnation. One thing is certain—the days of regulatory limbo in the U.S. are numbered.

GRTHO - 3 months HEADS & SHOULDERS══════════════════════════════
Since 2014, my markets approach is to spot
trading opportunities based solely on the
development of
CLASSICAL CHART PATTERNS
🤝Let’s learn and grow together 🤝
══════════════════════════════
Hello Traders ✌
After a careful consideration I came to the conclusion that:
- it is crucial to be quick in alerting you with all the opportunities I spot and often I don't post a good pattern because I don't have the opportunity to write down a proper didactical comment;
- since my parameters to identify a Classical Pattern and its scenario are very well defined, many of my comments were and would be redundant;
- the information that I think is important is very simple and can easily be understood just by looking at charts;
For these reasons and hoping to give you a better help, I decided to write comments only when something very specific or interesting shows up, otherwise all the information is shown on the chart.
Thank you all for your support
🔎🔎🔎 ALWAYS REMEMBER
"A pattern IS NOT a Pattern until the breakout is completed. Before that moment it is just a bunch of colorful candlesticks on a chart of your watchlist"
═════════════════════════════
⚠ DISCLAIMER ⚠
The content is The Art Of Charting's personal opinion and it is posted purely for educational purpose and therefore it must not be taken as a direct or indirect investing recommendations or advices. Any action taken upon these information is at your own risk.

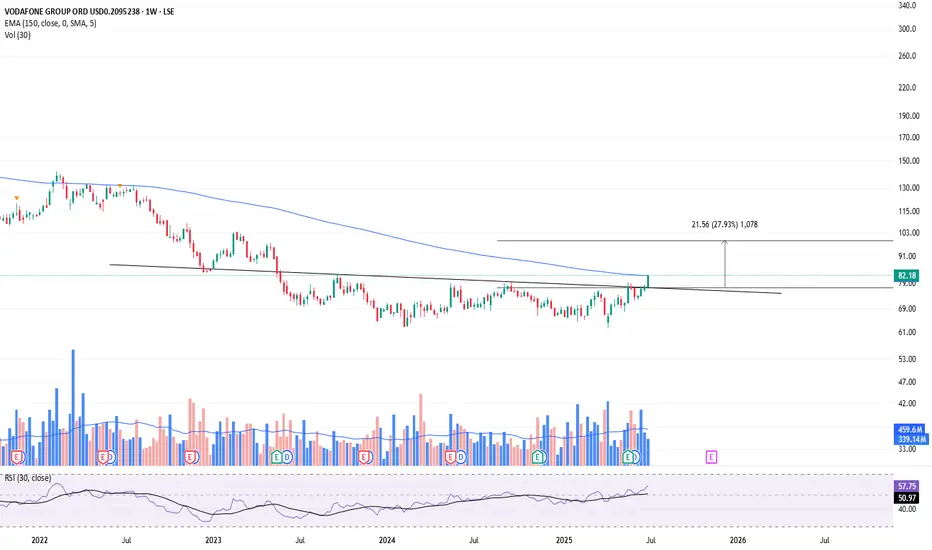
Breakout on Vodafone?Looks like a Head and shoulders reversal, plus breakout this week. Too early to say though as it still needs confirmation. Could still be a fake-out?
This is not a solicitation to trade in Vodafone shares.
NASDAQ (CASH100) SHORT - Head and shoulders H1Risk/reward = 3.8
Entry price = 23 167.9
Stop loss price = 23 232.8
Take profit level 1 (50%) = 22 943
Take profit level 2 (50%) = 22 878
Still waiting on confirmation on some variables in checklist

EYE inverted H&STA: I could see a pull back around to around the $17 level. Ultimately I see this going as high as $38.
F: Our eyes are just getting worse, we will only be sitting in front of more screens, and taking more harmful medicines that could damage eyes. I'm long eye care.

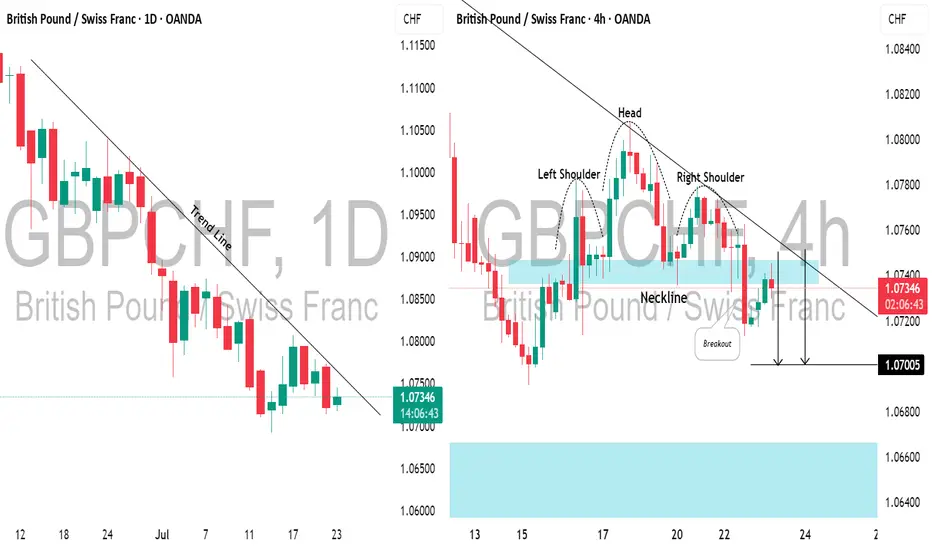
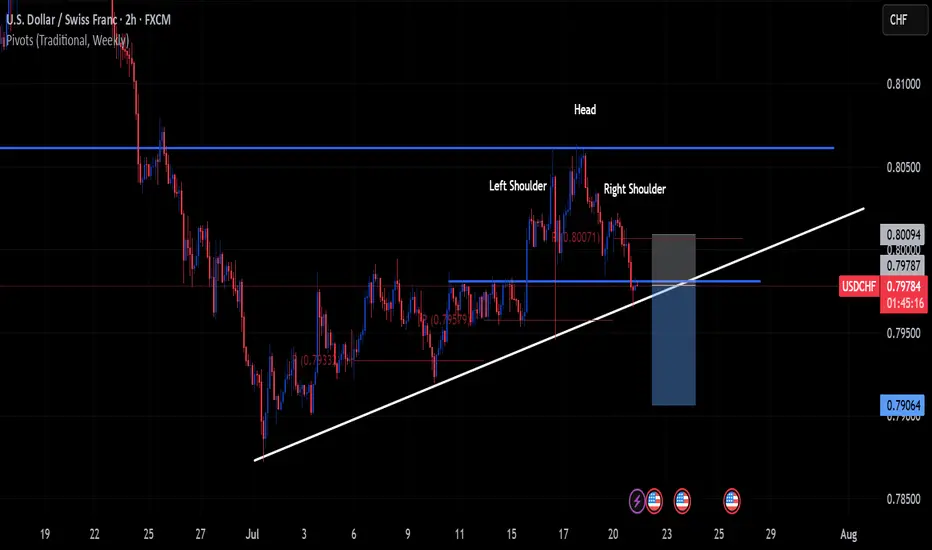
GBPCHF: Bearish Move From Trend LineI spotted a strong descending trend line on 📉GBPCHF, with the price rising to that last week on a daily.
As it tested this level, the pair formed an inverted head and shoulders pattern on a 4-hour time frame.
The neckline has recently been broken and retested.
I anticipate a bearish move towards the 1.0700 level now.
S&P500 (CASH500) SHORT - Head and shoulders Risk/reward = 5.8
Entry price = 6321.1
Stop loss price = 6333.5
Take profit level 1 (50%) = 6257.3
Take profit level 2 (50%) = 6234.9
Still waiting for confirmation on a few variables before I enter the trade.

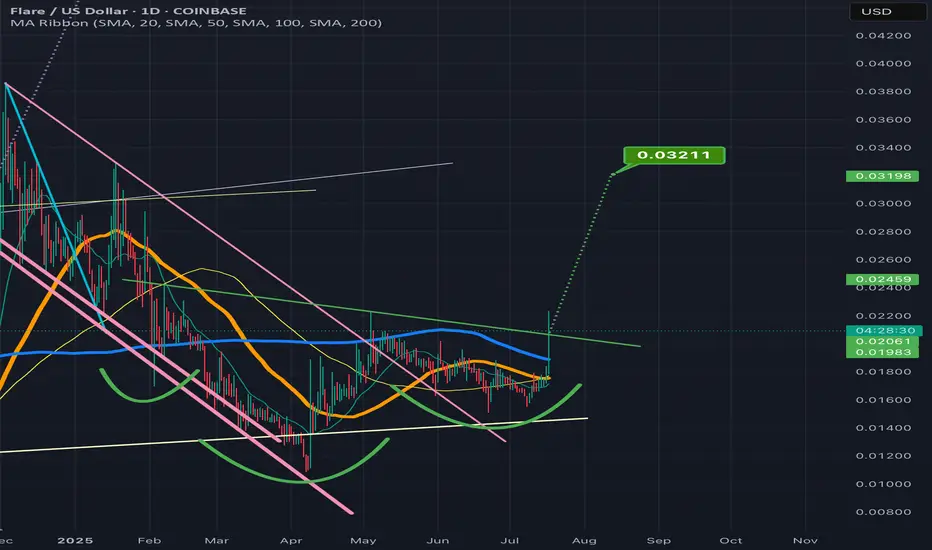
FLRUS breaking above the invh&s necklineNice it confirms the breakout the target is around 3 cents. Could always dip back below the neckline a time or two before that happens, but considering how it feels lke we are finally confirming an altseason here with bitcoin dominance taking a big dump probability highly favors an eventually validation of this breakout on flr. *not financial advice*
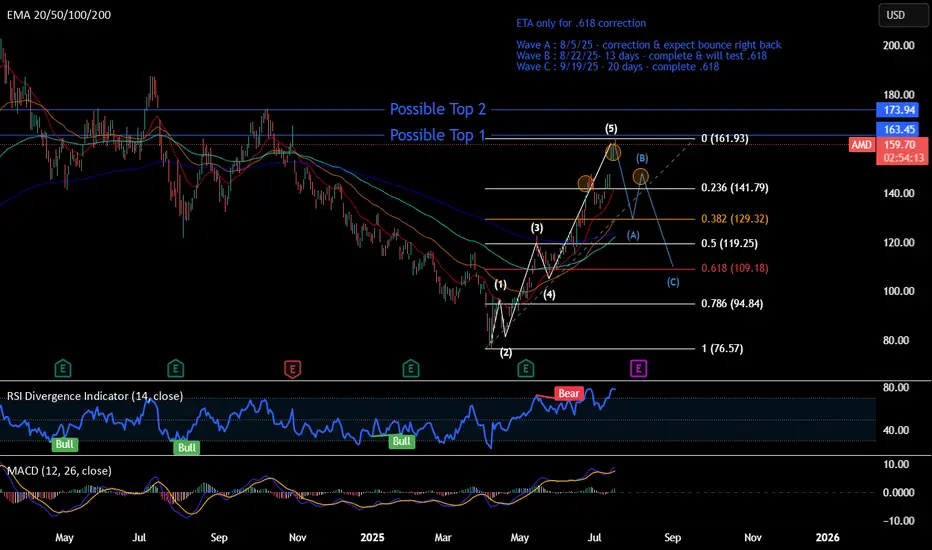
Short - AMDTime period for this play : week to months
Analysis : Elliot wave 12345 ABC. Expect hitting .618 and bounce back up to go higher.
Pattern if wave B completed : Head & Shoulder
Price Target: Wave ABC
ETA Timeline for correction. Please refer to the chart.
Upcoming events:
Tariff active on 8/1/25 - Friday
Earning on 8/5/25 - Tuesday
Top is not in yet, so 2 Possible top-in levels:
Top 1 - $163.45 : Retesting to hit 163.45, rejected, and break $158
Top 2 - $173.94 : Breaking 163.45 and reject at 173.94
=> Overall, It begins trading side way and show some weakness now.
The correction may not pull back to .618, which is the best level. Other scenarios:
- 0.5 fib, where it test wave 3
- 0.328 fib, strong bullish level if it doesn't break & go to the upside faster
China A50 Breakout: 14% Opportunity Amid Summer Lull?Markets are quiet, but the China A50 is heating up. A bullish inverse head and shoulders pattern has formed, backed by stimulus hopes. Target upside is 14% with a strong risk-reward setup. Are you ready to trade it, or still on holiday?
This content is not directed to residents of the EU or UK. Any opinions, news, research, analyses, prices or other information contained on this website is provided as general market commentary and does not constitute investment advice. ThinkMarkets will not accept liability for any loss or damage including, without limitation, to any loss of profit which may arise directly or indirectly from use of or reliance on such information.

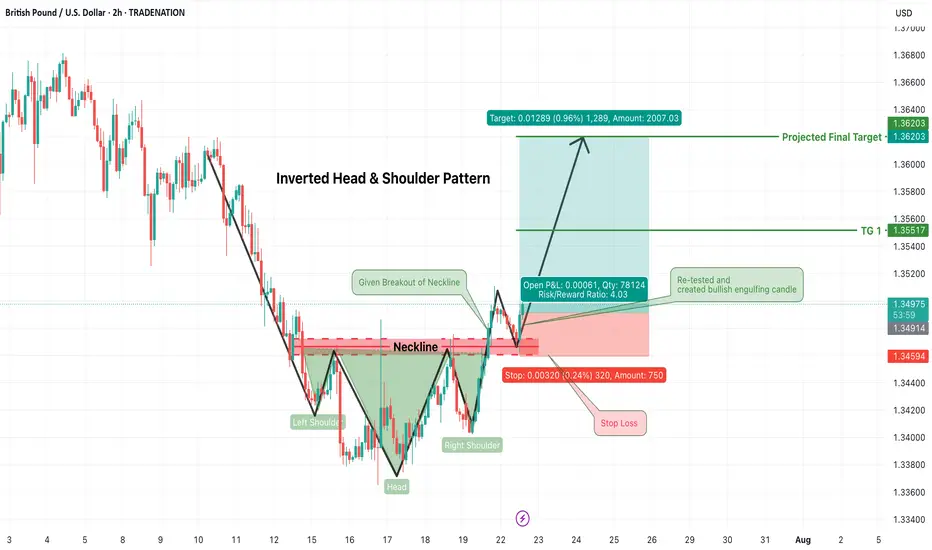
GBPUSD Long Trade Alert – Inverted Head & Shoulders BreakoutGBPUSD has confirmed a classic Inverted Head & Shoulders pattern, signaling a strong bullish reversal opportunity on the 2-hour chart. Price has successfully broken above the neckline resistance zone (~1.3490) and has now retested that zone, forming a bullish engulfing candle — an ideal confirmation for long entries.
🟢 Trade Plan:
Entry: After bullish engulfing candle formed on neckline retest (~1.3490–1.3500)
Stop Loss: Just below the right shoulder low / retest swing low (~1.3455)
Risk/Reward Ratio: ~4:1 (High reward with tightly controlled risk)
🎯 Target Levels:
Target 1: 1.3555
Final Target (Projected): 1.3620
These levels align with structure resistance and measured move of the pattern
📌 Why This Trade Matters:
Pattern confirmed ✅
Retest successful ✅
Bullish confirmation candle ✅
Clean invalidation and upside potential ✅
This is a textbook reversal play, offering solid structure, clear stop placement, and attractive upside. Perfect for swing traders or short-term position setups.
📉 Trade what you see, not what you think. Let price action lead your execution.
=================================================================
Disclosure: I am part of Trade Nation's Influencer program and receive a monthly fee for using their TradingView charts in my analysis.
=================================================================

NZDUSD Buy C setupHello traders this is a nice setup but it doesn't have that much confluence!!
Clear!!
Not sweet because of how far the pivot point is from my Sl.
we aslo have a weak Head and Shoulders at the bottom I hope you can see it.

Selling USDCHFHello traders Hope you are having a wonderful week!!
Clear downtrend!!
We can say about 4 touch trendline but technically its 3.
You can see it!!
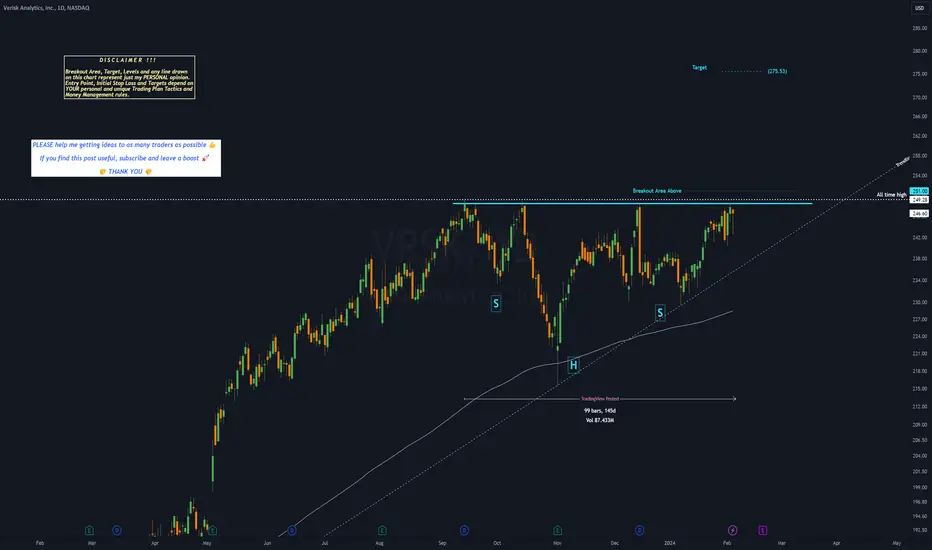
VRSK - 5 months HEAD & SHOULDERS══════════════════════════════
Since 2014, my markets approach is to spot
trading opportunities based solely on the
development of
CLASSICAL CHART PATTERNS
🤝Let’s learn and grow together 🤝
══════════════════════════════
Hello Traders ✌
After a careful consideration I came to the conclusion that:
- it is crucial to be quick in alerting you with all the opportunities I spot and often I don't post a good pattern because I don't have the opportunity to write down a proper didactical comment;
- since my parameters to identify a Classical Pattern and its scenario are very well defined, many of my comments were and would be redundant;
- the information that I think is important is very simple and can easily be understood just by looking at charts;
For these reasons and hoping to give you a better help, I decided to write comments only when something very specific or interesting shows up, otherwise all the information is shown on the chart.
Thank you all for your support
🔎🔎🔎 ALWAYS REMEMBER
"A pattern IS NOT a Pattern until the breakout is completed. Before that moment it is just a bunch of colorful candlesticks on a chart of your watchlist"
═════════════════════════════
⚠ DISCLAIMER ⚠
The content is The Art Of Charting's personal opinion and it is posted purely for educational purpose and therefore it must not be taken as a direct or indirect investing recommendations or advices. Any action taken upon these information is at your own risk.
Natural gas spotHead and shoulder pattern observed and neo wave wise also appear either neutral triangle , if break neck line good fall and then near another bigger head and shoulder neckline. Let see

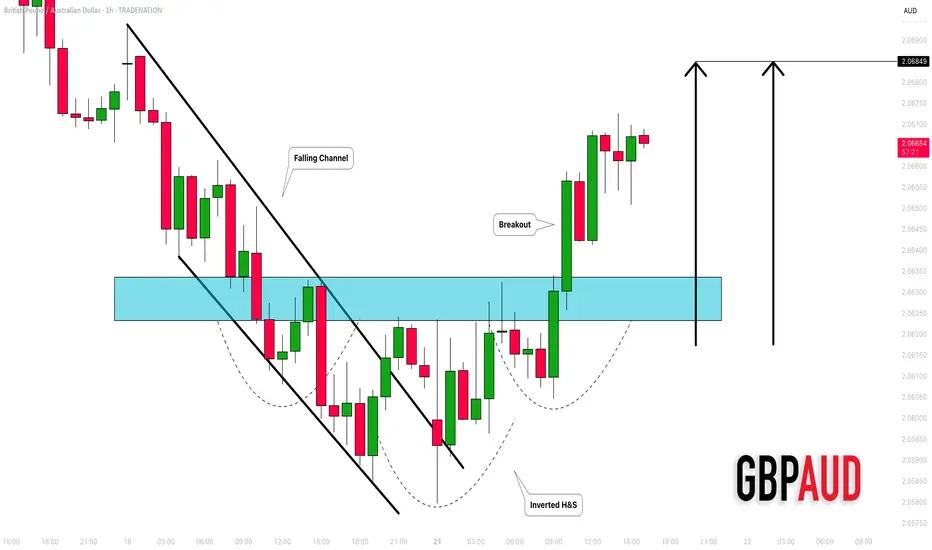
GBPAUD: Bullish Movement Continues 🇬🇧🇦🇺
GBPAUD is going to rise more, following a confirmed intraday bullish reversal:
first, the price violated a resistance line of a falling channel.
It started to consolidate within an inverted head & shoulders pattern then.
Its neckline violation is another strong bullish signal.
Next resistance - 2.0685
❤️Please, support my work with like, thank you!❤️
I am part of Trade Nation's Influencer program and receive a monthly fee for using their TradingView charts in my analysis.
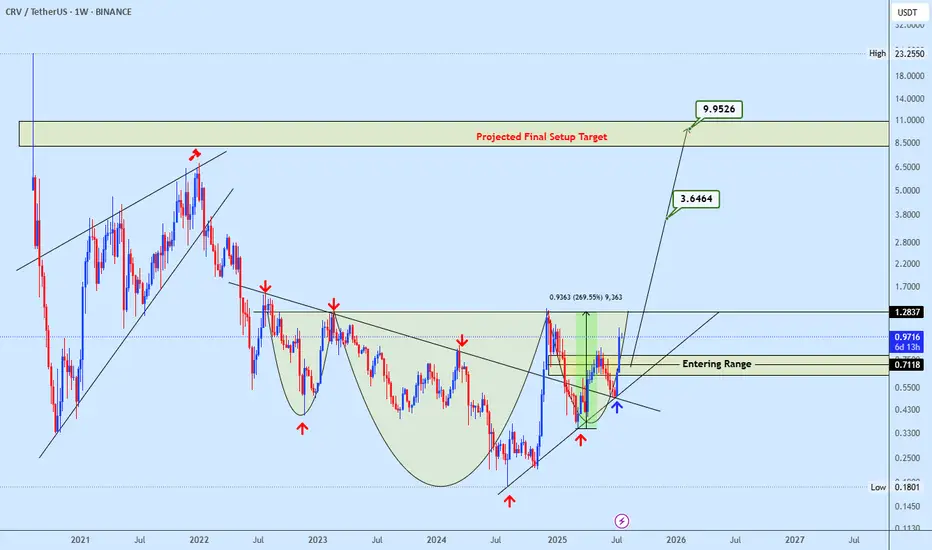
Crvusdt buy opportunityCRVUSDT is forming a potential inverse head and shoulders pattern, with price approaching the neckline zone. The marked entry range offers a strategic buy opportunity for early positioning. A confirmed breakout above the neckline would signal strong bullish continuation, with the final target outlined on the chart. Let us know your thoughts on CRV.