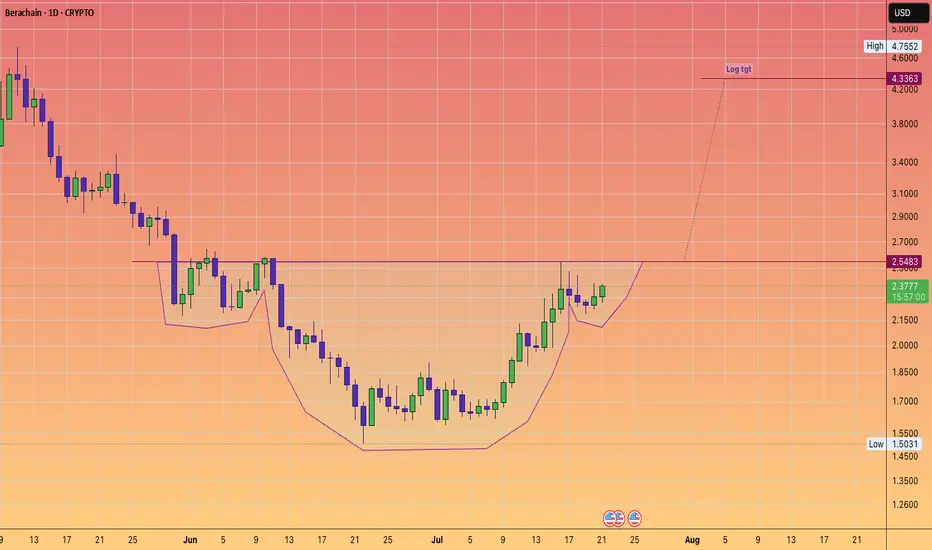
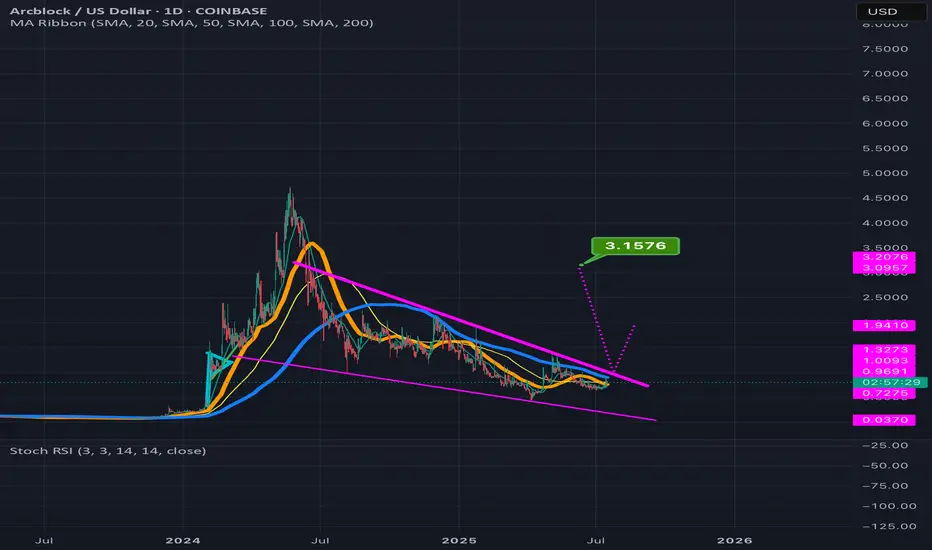
Berachain MOGGING the bears! Back to over $4#InverseHead&Shoulders
clean setup
log tgt provided.
sorry its altseason 100 things going on
no lengthy description needed :)
Head and Shoulders
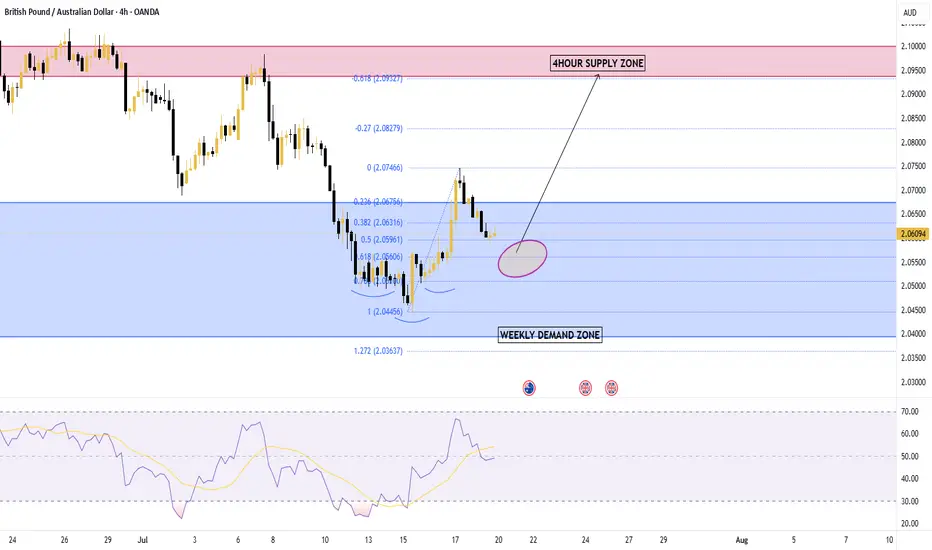
GBPAUD Bullish BiasPrice has entered the weekly demand zone and formed an inverse head and shoulders.
Price also shows bullish divergence on the RSI indicator.
Recent fundamental news of AUD showed increase in unemployment and father rate cuts are expected in the near future.
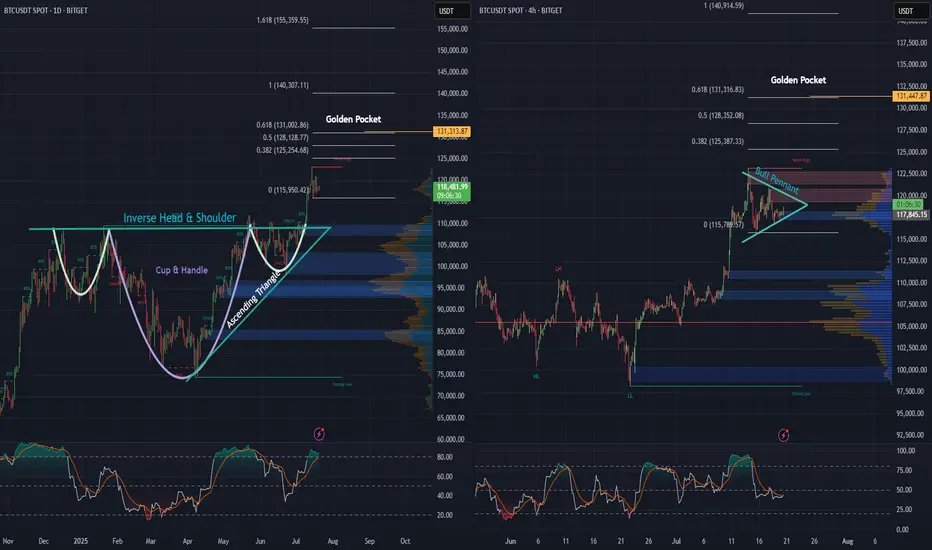
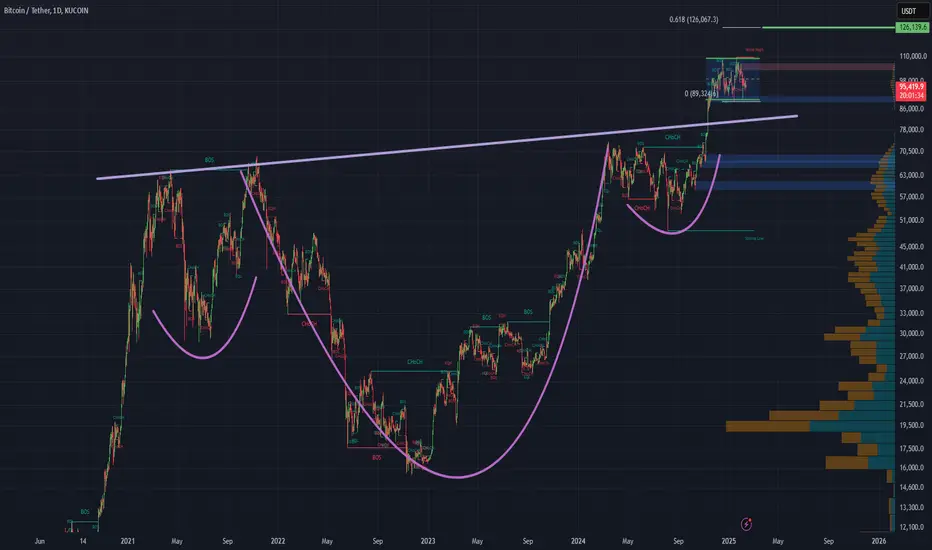
BTC daily, and 4 hr. Bullish Patterns Stack Up!Looking at the Daily and 4-hour charts for BTC, we can see multiple bullish formations unfolding.
An inverse head and shoulders - daily
A cup and handle - daily
An ascending triangle - daily
Price action looks strong, as we’ve begun the breakout from the neckline on the inverse H&S, as well as the cup and handle and ascending triangle simultaneously, and momentum is building fast.
Also, on the 4-hour chart, there’s a pretty substantial bull pennant taking shape. A breakout here could be the next leg up, and the push needed to keep momentum alive.
Zooming out, when we apply the trend-based Fibonacci extension, it reveals a $131,000 golden pocket, on both the the daily as well as the 4 hr. And that could be a major upside target if these bullish structures hold.
Stay tuned to see if BTC continues its move and sets a new all-time high.
Bitcoin: Promising Patterns and Potential BreakoutBitcoin's recent price action has been nothing short of captivating for traders and analysts alike. On the daily chart, we've observed the formation of an Inverse Head & Shoulders and a Cup & Handle pattern, both of which have now transitioned into a Bull Flag. These bullish signals suggest a strong potential for upward movement.
Zooming into the 4-hour and 1-hour charts, we can see prominent Ascending Triangles taking shape. These patterns are often harbingers of significant breakouts, and it appears that Bitcoin is winding up for a substantial move.
Moreover, when utilizing a Trend-based Fibonacci Extension on the daily timeframe, the golden pocket points to a target of $126k, with the next pocket at $185k. This aligns with historical data and technical indicators, suggesting that Bitcoin might be poised to rewrite history once again.
Stay tuned as we monitor these developments and anticipate what could be a historic breakout for Bitcoin!
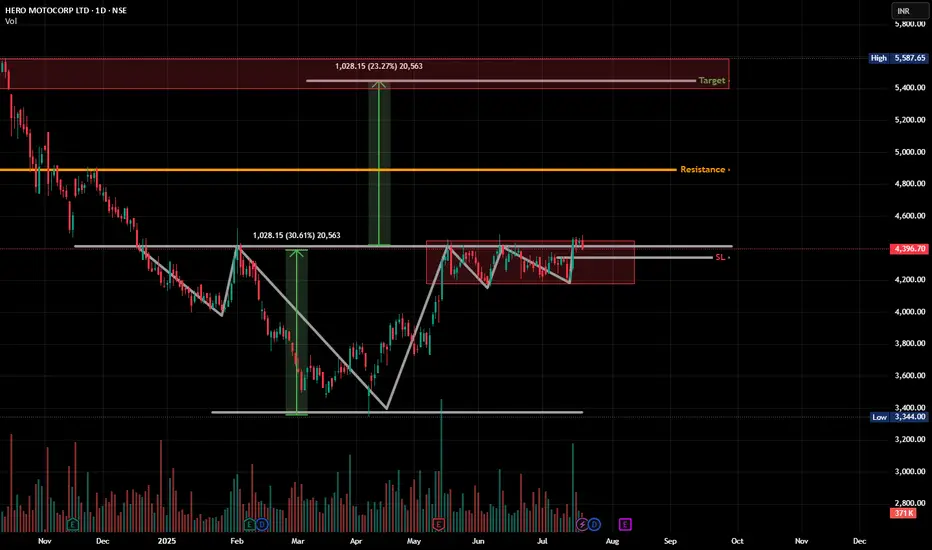
HEROMOTOCO - Multi-Right Shoulder H&S (it works out too much)Pattern Watchers!👀
We usually get one head, one left shoulder, and one right shoulder, right?
But this chart said: "Why stop at one? Let’s bulk up the right side!" 😂
🧠 Head & Shoulders spotted –
✔️ Classic neckline around ₹4390
✔️ Multiple failed breakouts but price holding above range
✔️ Right shoulder has been gymming, forming a clean range
📏 Potential breakout target = ~₹5400
🧱 Resistance zone above (highlighted in red) may act as the next boss level
🎯 Watch for:
Break and hold above ₹4450–₹4480
Volume confirmation
Avoid fakeouts — price needs to STAY above neckline
💡 Bonus thought: This could also be interpreted as an Inverse H&S breakout from March, and this range is just a healthy consolidation.
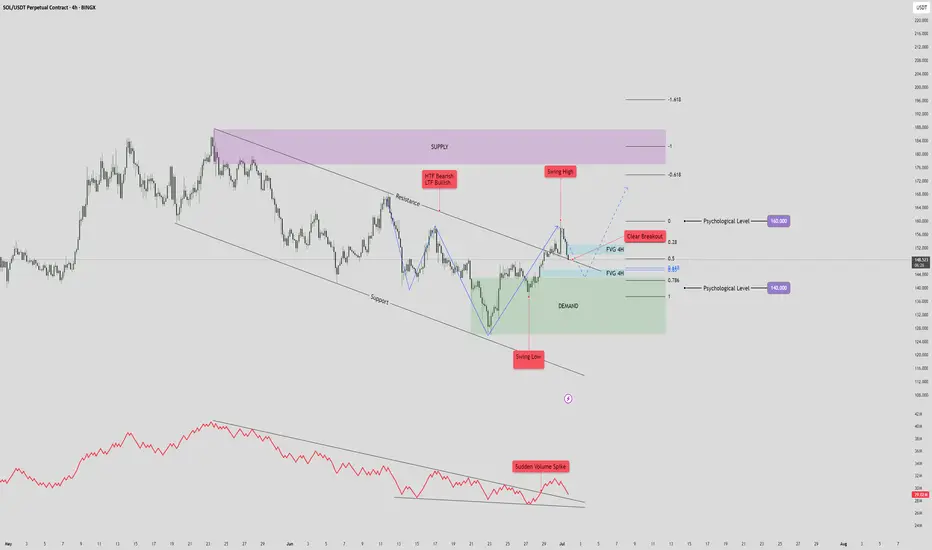
Solana (SOL/USDT) 4H Reverse H&S PatternSolana (SOL/USDT) – 4H Market Outlook | July 1, 2025
Introduction
SOL has formed a reverse head and shoulders pattern, followed by a clean breakout above resistance. While the lower time frame is bullish, the higher time frame remains bearish, creating a short-term opportunity within a broader downtrend.
Context 1: Key Zones
Supply Zone: 176 – 187
Demand Zone: 126 – 143
Psychological Levels: 140 and 160
Context 2: Technical Structure
Pattern: Reverse Head & Shoulders
Breakout: Confirmed above neckline/resistance
FVGs:
One below price (within demand)
One above price (potential target)
Golden Pocket: Sits just above lower FVG and inside demand — strong confluence support
Context 3: Volume Insight
OBV Indicator: Shows a sudden volume spike, adding strength to the breakout and the bullish pattern confirmation.
Bullish Scenario
Price pulls back into the golden pocket + FVG + demand zone
Finds support → bounces to form higher low
Second leg of the move breaks swing high → targets upper FVG and 160 psychological level
Bearish Scenario
Price breaks back below demand zone and invalidates the golden pocket
Fails to hold structure → reverts to macro bearish trend
Potential retest of previous swing low below 126
Summary
SOL is showing bullish momentum on the 4H after completing a reversal pattern and spiking in volume. A pullback into the demand zone confluence may offer a strong long setup — but failure to hold could revalidate the higher timeframe downtrend.
TRB : FREE SIGNALHello friends🙌
📈Given the price reaching its bottom and the buyers supporting it, you can see that a classic head and shoulders pattern has formed and buyers have entered. For this reason, you can buy with capital and risk management and move with it to the specified targets.
🔥Follow us for more signals🔥
*Trade safely with us*

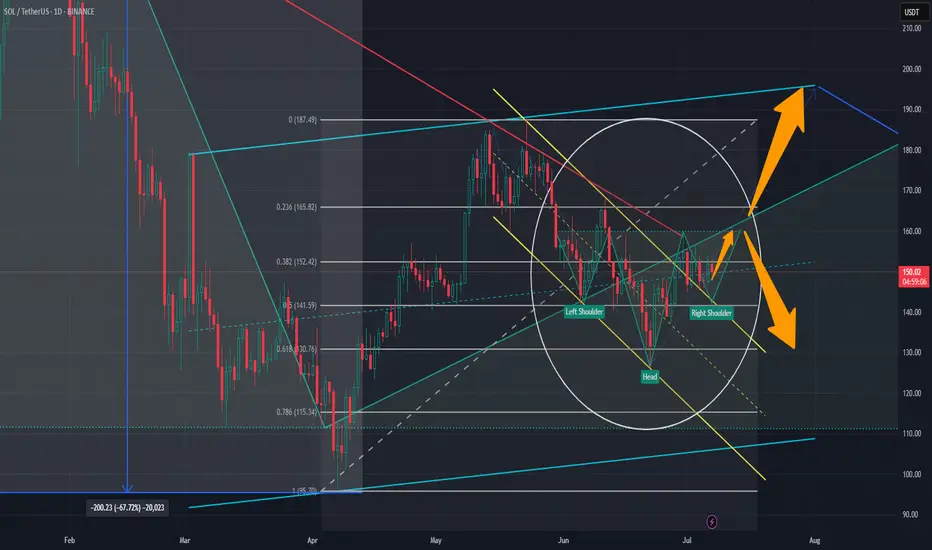
Inverted head and shoulder suspected ..keep an eye on necklineHi dear friends and followers, I suspect this inverted head and shoulders pattern with a neckline around 160 usd. If it breaks in, it can go down toward the inferior support level around 130 usd and the 0.618 Fibo. If it breaks out it can go up until the next resistance and psychological level of 200 usd. As you can see, this 200usd resistance level does match with a large ascending channel.
You all need to DYOR and keep an eye on RSI and volume to confirm the movement and take a trade.
Wishing you the best and success on your decision.
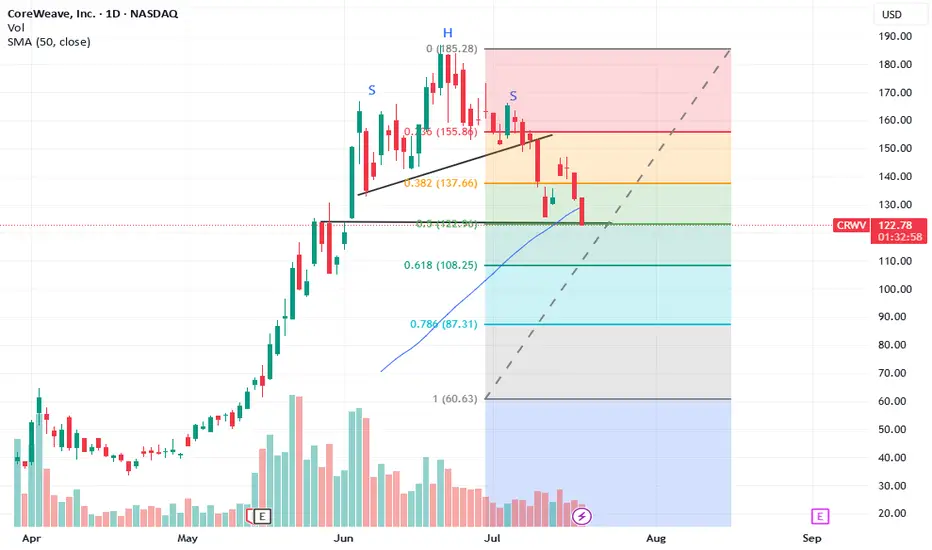
Coreweave retesting supportAfter a recent pop off the support line, it looks like the stock will retest these levels. Also, note the clear H&S pattern over the last several months. I'm expecting a breakdown below support in the next week or two.
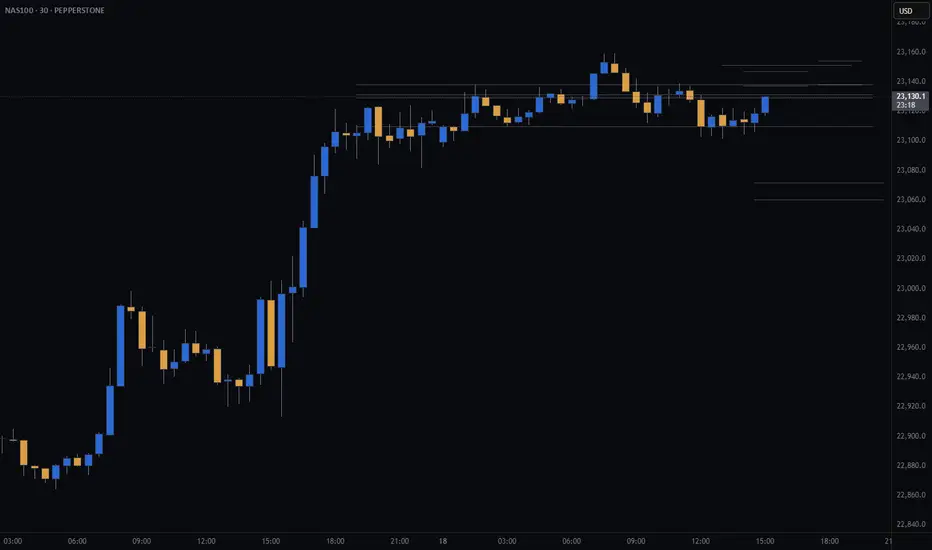
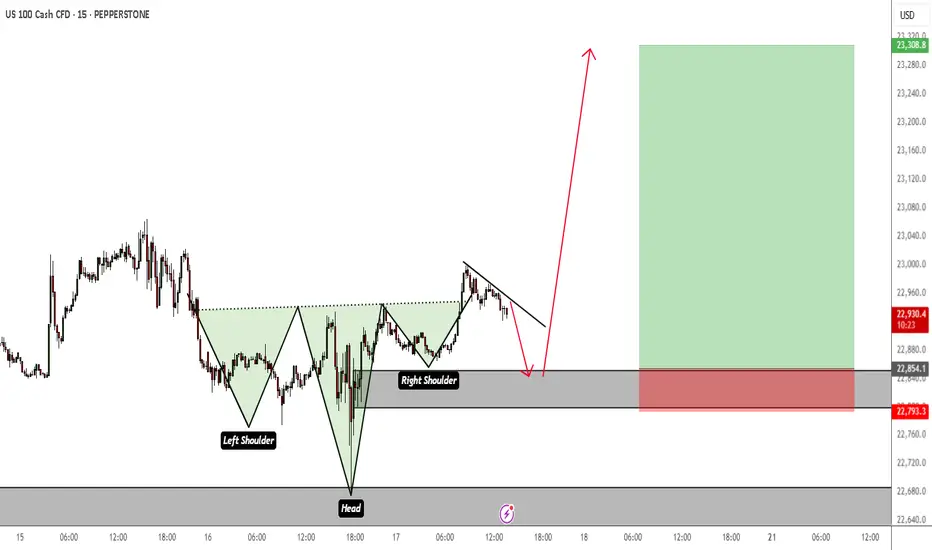
NAS100 (CASH100) SHORT - head and shoulders 30minRisk/reward = 3.9
Entry price = 23 137.9
Stop loss price = 23 153.9
Take profit level 1 (50%) = 23 071
Take profit level 2 (50%) = 23 060
Still need to validate a few variables.
Lets goooooo
S&P500 (CASH500) (SPX500) SHORT - Head and shoulders 30minRisk/reward = 3.3
Entry price = 6314.8
Stop loss price = 6318.4
Take profit level 1 (50%) = 6301.3
Take profit level 2 (50%) = 6297.5
Waiting on validation from a few other variables.
For example, waiting for the current 30min candle to close in range.
Letssss goooooo

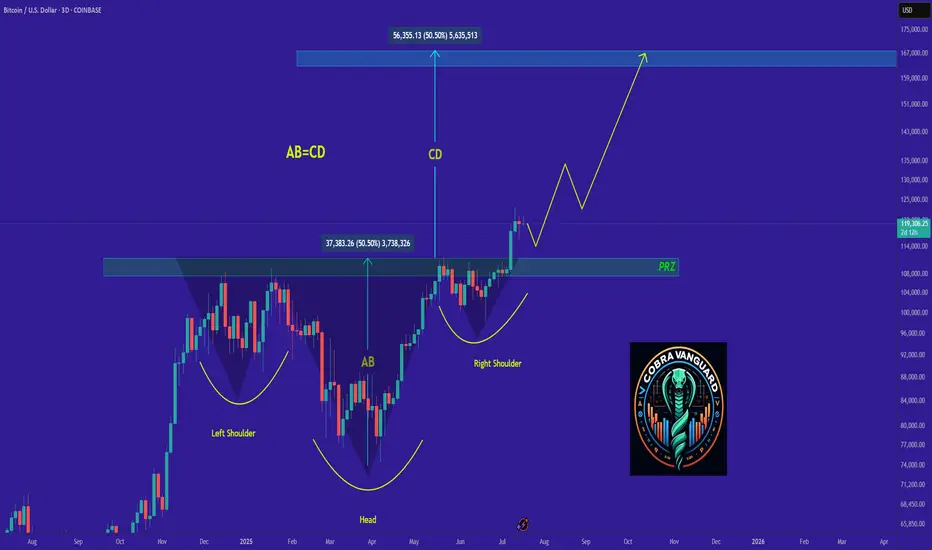
Bitcoin is bullish now & many Traders don't see it !!!I might be wrong and this might never happen, but it might come true From a technical perspective!!!
Remmember
Stay Awesome , CobraVanguard.
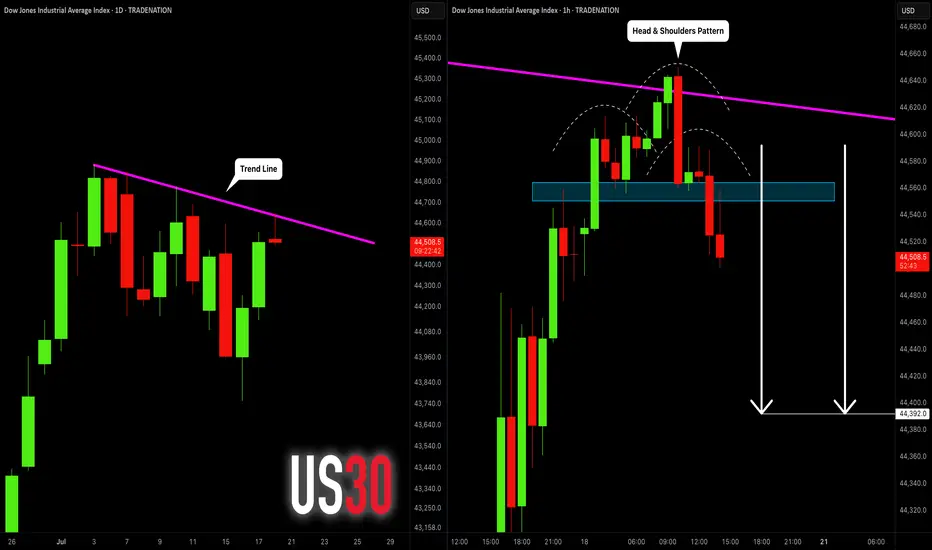
DOW JONES INDEX (US30): Bearish Move From Trend Line
I see a test of a strong trend line on US30.
The price formed a head & shoulders pattern on that
and a breakout of its neckline on an hourly time frame.
I expect a retracement to 48390
❤️Please, support my work with like, thank you!❤️
I am part of Trade Nation's Influencer program and receive a monthly fee for using their TradingView charts in my analysis.
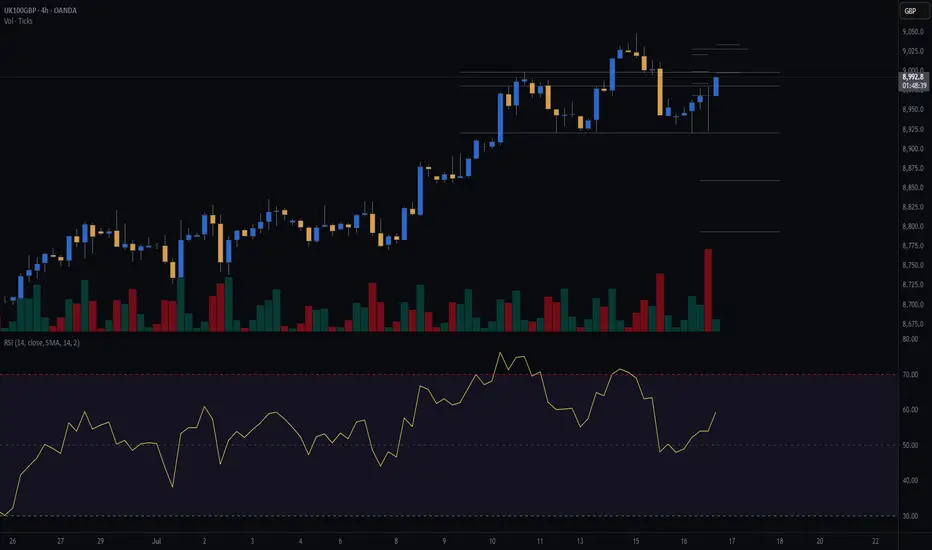
UK100 short - head and shoulders H4Risk/ reward = 4.6
Entry = 8 998.5
Stop loss = 9 034.2
Take profit level 1 = 8 859.8
Take profit level 2 = 8 794
Still need confirmation,
Waiting for H4 candle to close at 23.00 and will need to validate volume.
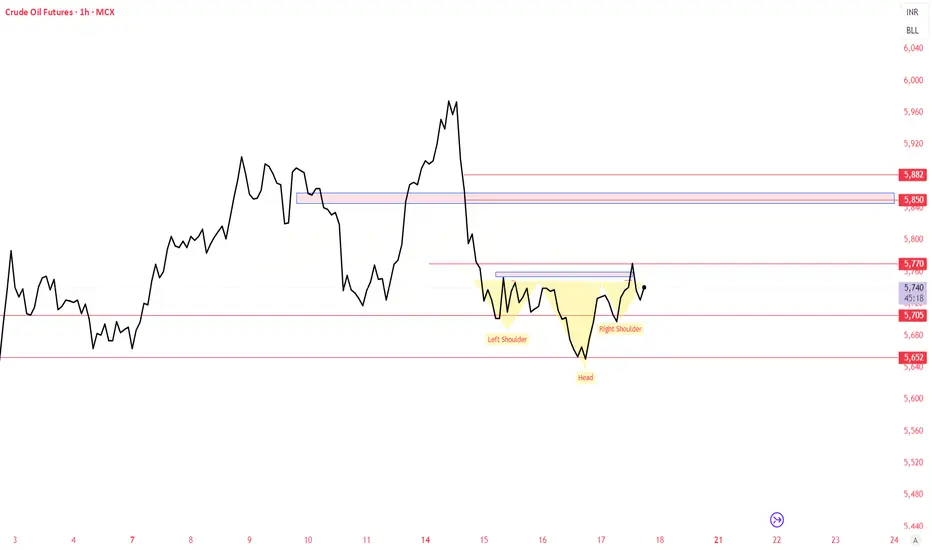
CRUDEOIL - MCX INVERTED HEAD AND SHOULDERCrudeoil on 1 hour time frame forming Inverted head shoulder which is consider as bullish Pattern. Strong Support of 5680 , crudeoil may do 5826-5820-5850
Please do your own research before taking any trading decisions
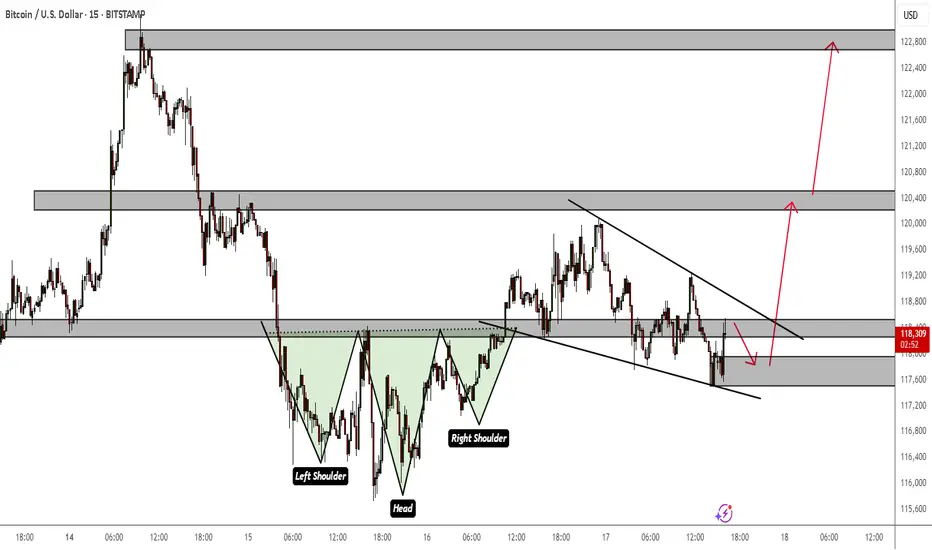
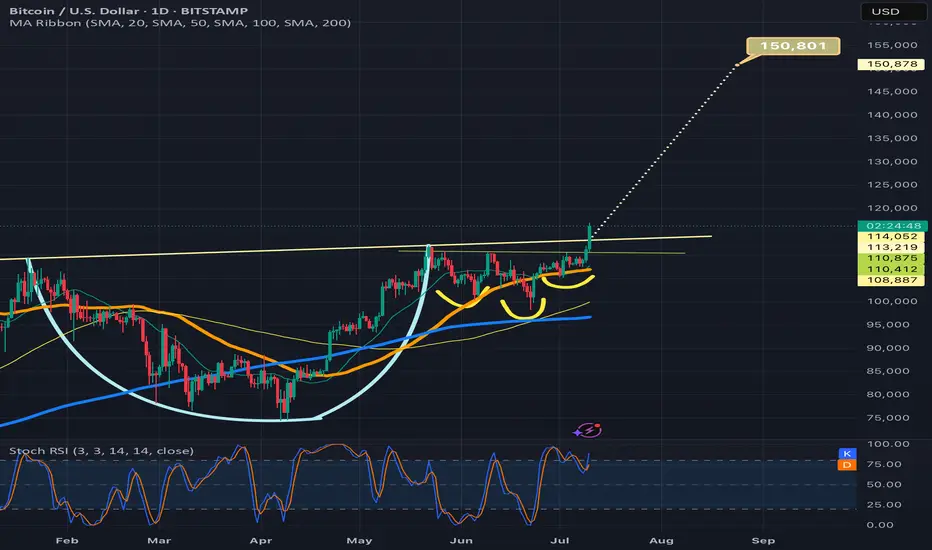
BTCUSD Bullish Continuation Patterns on LTFThe trend is still bullish and the daily bull flag I posted is still at play. This is just a lower TF perspective within the bigger overacharching view.
Inverse head and shoulders and a bullish flag all indicate continuation to the upside. You can use market structure to confirm your entries and your target profit zones if you do not plan on holding until $150k
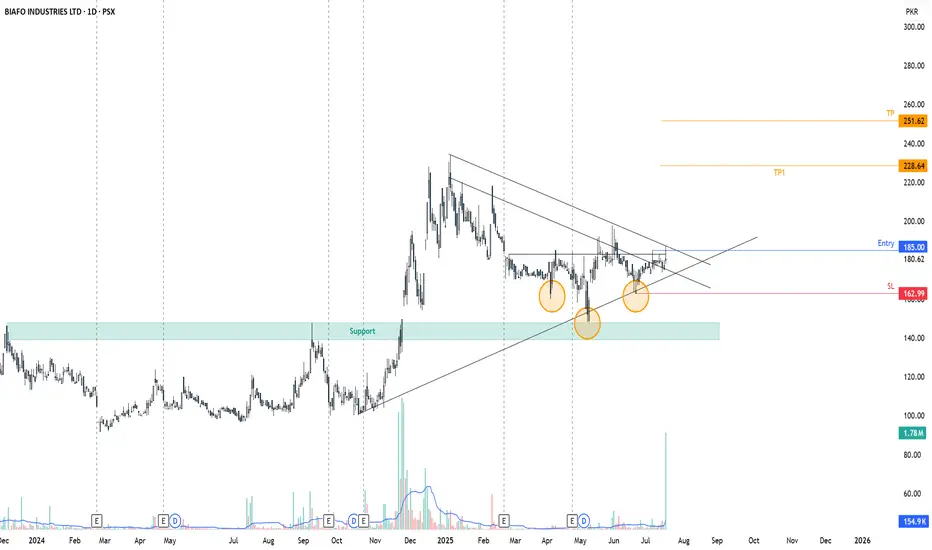
Are you seeing BIFO next Upper cap?BIFO has already shown bullish divergence and formed an Inverted Head and shoulder pattern. On the breakout of Resistance, it can make a fine move.
Are you seeing it next Upper cap?
NASDAQ Inverted Head & Shoulders Retest Before Bullish MomentumI see a possible retest of an Inverted Head and Shoulders on M15 TF before the bullish momentum resumes. The SL and TP are just a rough estimation. Price could dip a bit lower than that.
But my overall bias is bullish.
ABT can potentially 4x in value reading up from the wedge its inThe smaller pink dotted measured move line is for the inv h&s pattern its formed inside the wedge with the top trendline of the wedge doubling as the invh&s pattern’s neckline. Hitting that smaller target is more or less a 2x from current price action. If we hit the full falling wedge target that’s a 4x from where it is currently. *not financial advice*
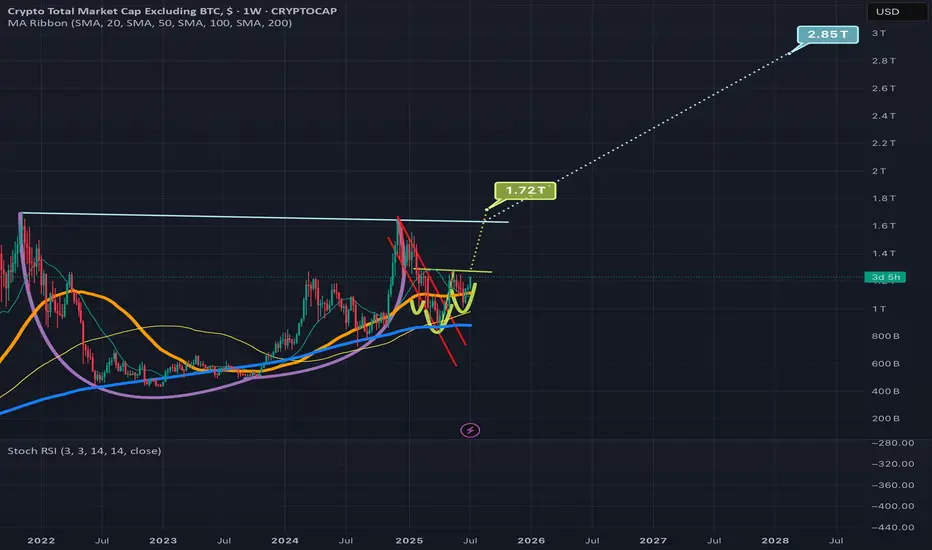
Total2 wants to inv h&s its way into completing its cup’s handleShould break above the neckline of this lemon lime colored inverse head and shoulder pattern in the upcoming 1-3 weekly candles here, and we are likely less than a week a way from the daily chart golden cross (not shown here). The breakout target from this inverse head and shoulder pattern will take price above the rimline of the larger cup and handle pattern and upon triggering the breakout from that we head to the light blue erasure move target which fro where price action currently is is about a 100% gain for the alt racket which should confirm alt season. *not financial advice*
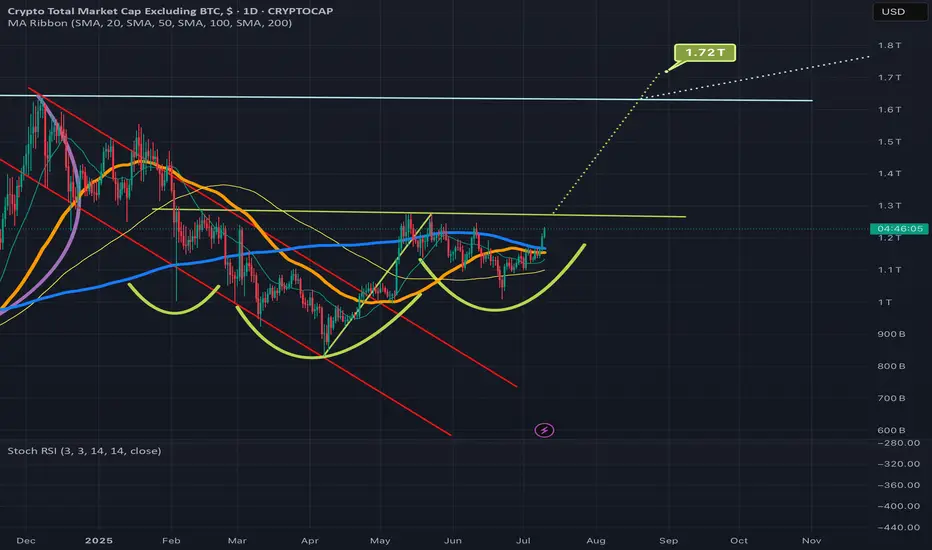
The daily chart for total2 to look at the impending golden crossWanted to also post a daily chart tie frame of my previous idea. I first posted it in weekly to fit the entire cup and handle breakout target in the frame, but wanted to also post the daily time frame to provide both a close up of the inverse head and shoulders pattern as well as the impending golden cross on the daily time frame. Loos very likely that alt season may finally be approaching here. Gonna pay close attention to both this chart and the bitcoin dominance chart btc.d to know for sure. *not financial advice*
Btcusd breaking above cup and handle necklineIf it confirms the bullish breakout the target is 150k. Also by breaking above 116k and solidifying that level as strong support, we will trigger an even bigger inverse head and shoulders pattern (not shown here) with a breakout target around 208k! I will provide a link below to the chart I posted of that pattern. Thanks for reading, liking, and following. *not financial advice*
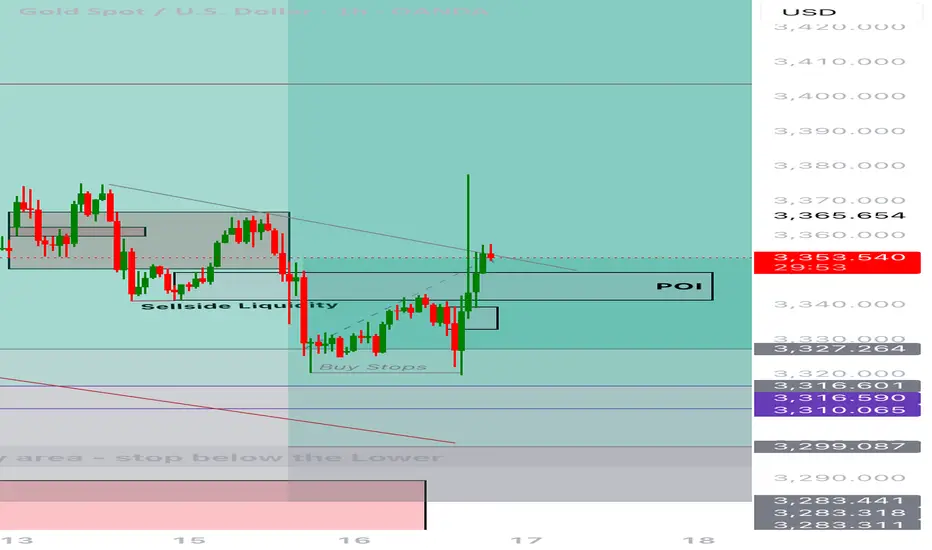
Current XAUUSD TradeDate: July 16, 2025
Platform: TradingView (Demo Account)
Timeframe: 15M (Entry), 4H (Bias/Context)
Direction: Long
Status: Entry zone identified, waiting for confirmation
Strategy Type: POI Re-entry after BOS (Break of Structure)
⸻
🔍 Market Context
• On the 4H, bullish BMS is confirmed after sweeping sell-side liquidity.
• Price has aggressively moved upward, showing intent to continue bullish.
• 15M structure now shows break of previous SND zone, shifting lower-timeframe flow to bullish.
• POI zone identified — price likely to return here for a mitigation tap before full continuation.
⸻
🧠 Trade Rationale
• POI marked as a mitigation zone for re-entry after BOS on 15M.
• Confirmation will be valid only after price closes above the wick (shows strength).
• Expecting return to POI to mitigate imbalance or unfilled orders.
⸻
📍 Entry Criteria
• POI zone: between ~3,327 and 3,316
• Watch for:
• Bullish SFP (swing failure pattern)
• Bullish engulfing candle
• 15M BOS + higher low confirmation inside POI
• Entry trigger: Price must close above the wick, then return to POI with bullish reaction
⸻
🧾 Management Plan
• Stop Loss: Below POI (~3,316 or slightly lower)
• Take Profit: 3,492 (upper 4H imbalance zone)
• Trail stop based on 15M structure if price accelerates
⸻
😌 Emotional Reflection
Comfortable identifying refined entry after HTF structure shift. No FOMO — POI must react cleanly and respect my conditions.
⸻
✅ Reflection Questions
• Did I wait for the proper 15M BOS before marking my POI?
• Did I define my confirmation model clearly?
• Will I enter only if the wick is closed above and POI is respected?