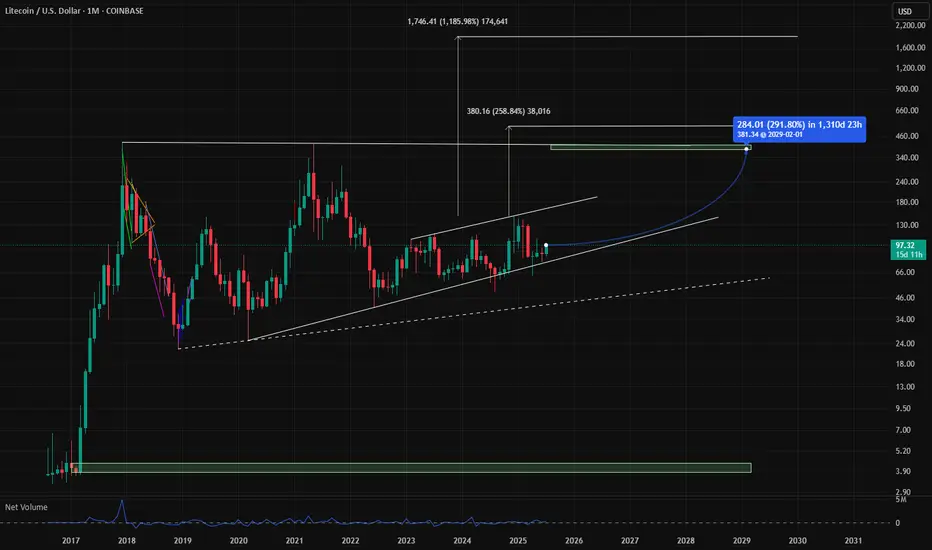
LTC Targets 400$ + 1900$ Litcoin LTC Targets for the next run are atm +290% is a realistic szenario. The addvanced targets at 1900$ are very impressiv but remember there are only 21 Mio. Coins too, like BTC because it is the fork and think about an alternative payment methode like btc, would be a reason for 1900$ pro LTC. So in Crypto is nothing unreal if you could imagine, but first of all approx. 400$ are a good direction. GM
Head and Shoulders
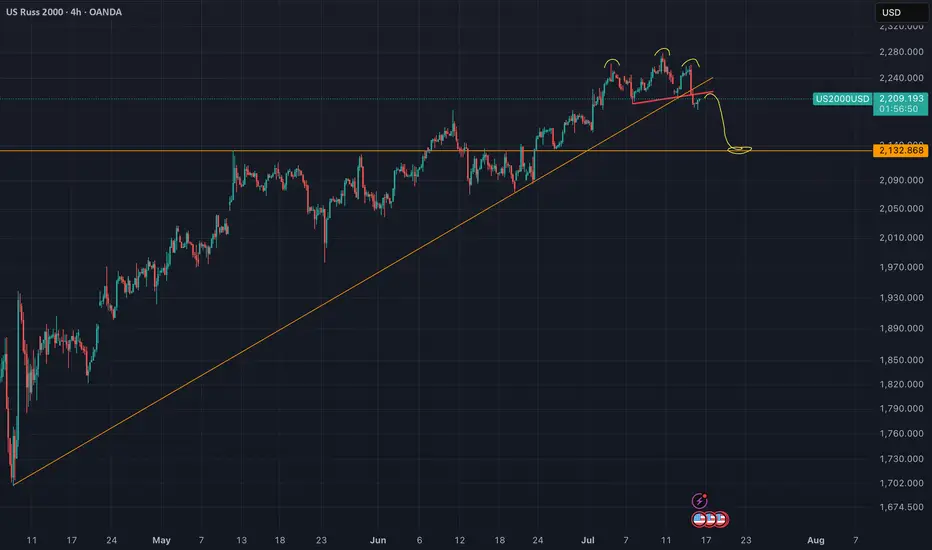
US2000 - Head And Shoulders (Top signal)Reversal in play. The neckline of the H&S got validated yesterday.
Nothing here should be interpreted as financial advise. Always do your own research and decisions.
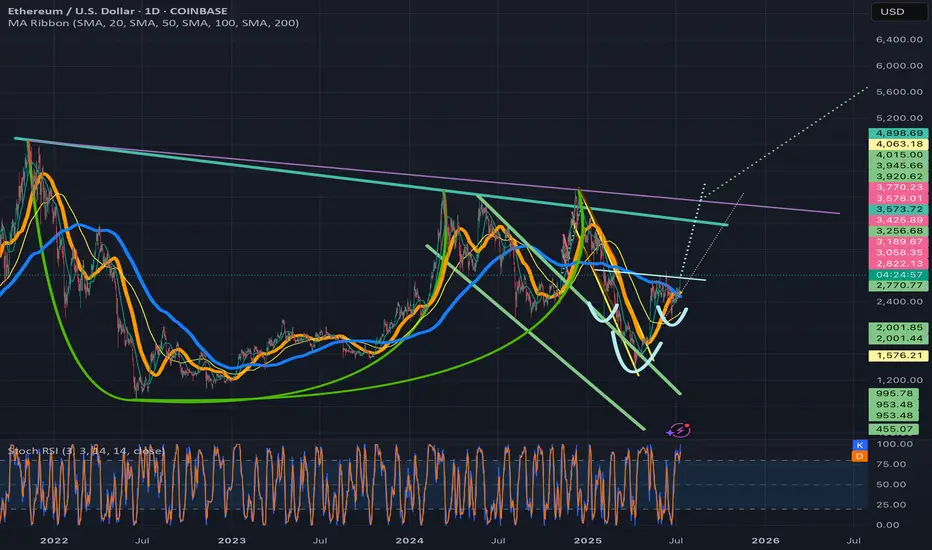
Ethusd breaking above invh&sEthusd chart has a similar set upas the total2 chart, a cup and handle that is breaking up from a smaller inverse head and shoulders that will complete the handle to the cup. Ethereum actually has two potential to trendlines for its cup and handle and I wouldn’t be surprised if both are valid. The breakout target for the inverse head and shoulder pattern will take price action above both of them. Once we solidify the top trendline for the cup and handle patterns as support the breakout target for it is $7161. Ethereum just recently had a golden cross on the daily which adds to the probability the inverse head and shoulder pattern breakout will be validated. *not financial advice*
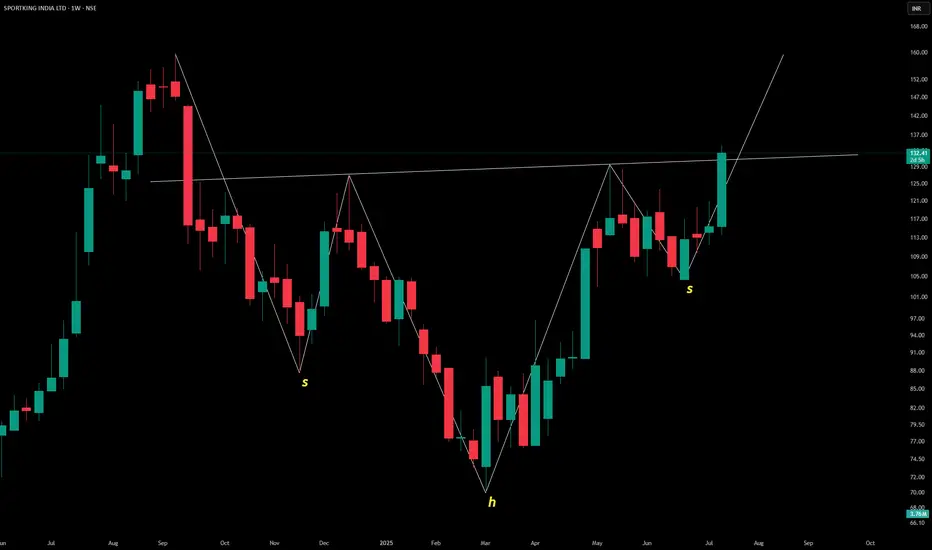
SPORTKING INDIA LTD – Inverted Head & Shoulders Pattern
The weekly chart shows a classic **inverted head and shoulders** formation:
- 👈 **Left Shoulder**: Shallow trough
- 🔽 **Head**: Deep central low
- 👉 **Right Shoulder**: Higher trough mirroring the left
Price action around ₹132.48 suggests a potential **bullish reversal**, indicating that the prior downtrend may be bottoming out. A breakout above the neckline would typically confirm upward momentum—worth watching for volume confirmation and resistance levels.
Let me know if you’d like projected targets or neckline levels next!
Last resort buy’s concept ?Trade Journal Entry – XAUUSD (Gold Spot)
Date: July 15, 2025
Platform: TradingView (Demo Account)
Timeframe: 4H
Direction: Long
Status: Active trade under review / possible re-entry
Key Levels
- Sell-side liquidity tapped: ~3,340–3,345
- Support zone (mitigation block): ~3,316–3,310
- Last resort buy area: ~3,283
Market Context
Clear Break of Market Structure (BMS) confirming bullish bias.
Price swept recent sell-side liquidity above 3,360, failed to hold, and sharply pulled back.
Price is now entering a mitigation zone, sitting above the major buy-side liquidity zone and last resort demand.
Multiple liquidity layers marked below current price — good confluence for a reaction if structure holds.
Trade Rationale
Scenario A: If price respects ~3,316–3,310 zone and forms bullish engulfing/reversal, consider re-entry.
Scenario B: If price breaks deeper into 3,283 zone with SFP (swing failure pattern) or V-reversal, it's a last-chance long from premium demand.
Trade Plan
Watch for bullish reversal candle or lower timeframe BOS (M15) inside 3,316–3,310 zone.
If entered, SL below 3,283. TP remains at prior high ~3,492.
Manage risk carefully — only one more key demand zone below.
Emotional Reflection
Felt confident on initial entry, but market invalidated short-term structure. Now reassessing calmly — waiting for re-entry confirmation without chasing.
Reflection Questions
- Did I exit early enough once price showed failure to hold above 3,360?
- Will I maintain composure and wait for structure confirmation in the new zone?
- Is my risk sized properly for this secondary attempt?

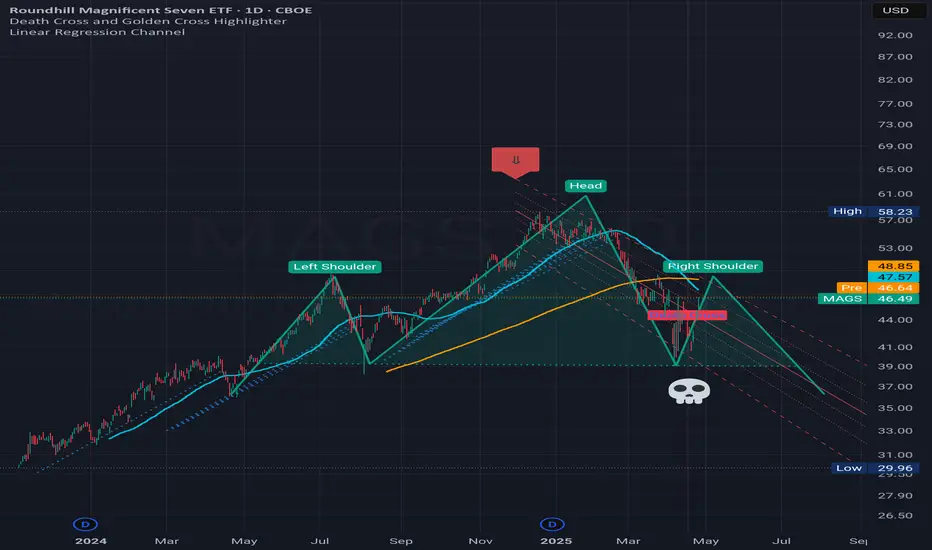
Massive Head & Shoulders + Death Cross on Big 7A massive head and shoulders pattern is forming on the Big 7 tech stocks (AAPL, MSFT, NVDA, GOOGL, AMZN, META, TSLA). After a strong rally, a death cross (50 EMA crossing below 200 EMA) has appeared, pointing to possible weakness ahead.
Short-term concerns: right shoulder is forming now. If it holds, we could see a bounce. If the right shoulder fails, expect sharp drops and potential broader market reversals.
Long-term view: markets could still move higher over time, but short-term risks are rising. This setup resembles the 1999-2000 period before the dot-com crash. The AI bubble could be nearing its peak, with current leaders losing strength and new players stepping in.
Key to watch: neckline of the head and shoulders and how the market reacts to the death cross.
disclaimer: this is not financial advice. for informational purposes only. trading involves risk and past patterns do not predict future results. always do your own research and consult a licensed financial advisor before making decisions.
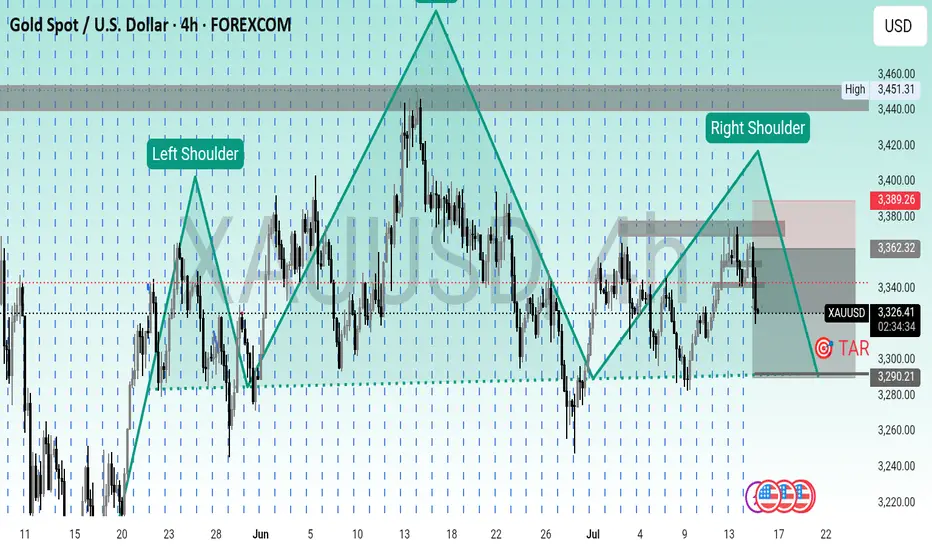
XAUUSD HEAD AND SHOULDER CHAAT PATTERN BEARISH ⏱ 4H Timeframe | Bearish Bias | Precision Setup
💡 Pattern Formed: Head & Shoulders
🔻 Market rejecting at right shoulder zone with bearish confirmation
---
🔽 Entry Level (Sell):
🟤 3,360 – 3,365 (Right shoulder rejection zone / supply area)
🛑 Stop-Loss (SL):
🔴 3,390 (Above the right shoulder + structure invalidation)
🎯 Take-Profit (TP):
🟢 3,210 – 3,200 (Measured move target + POI support zone)
📊 Risk:Reward Ratio:
✅ Approx. 1:4 — High probability setup
OndoBullish Reversal in Play – ONDO/USDT Weekly Chart
A clear Inverse Head and Shoulders pattern is forming on the weekly timeframe.
Price is currently breaking out of the neckline with strong momentum.
🔹 Left Shoulder: Formed with consistent volume support
🔹 Head: Deep correction followed by strong recovery
🔹 Right Shoulder: Higher low formation with bullish pressure
📈 Potential Target: $2.51 (+247%)
🛡️ Support Zone: ~$0.58
If this breakout confirms with weekly close above the neckline (~$0.90–$1.00),
we could be seeing the start of a major bull wave.
#ONDO #CryptoAnalysis #InverseHeadAndShoulders #Altseason #Breakout

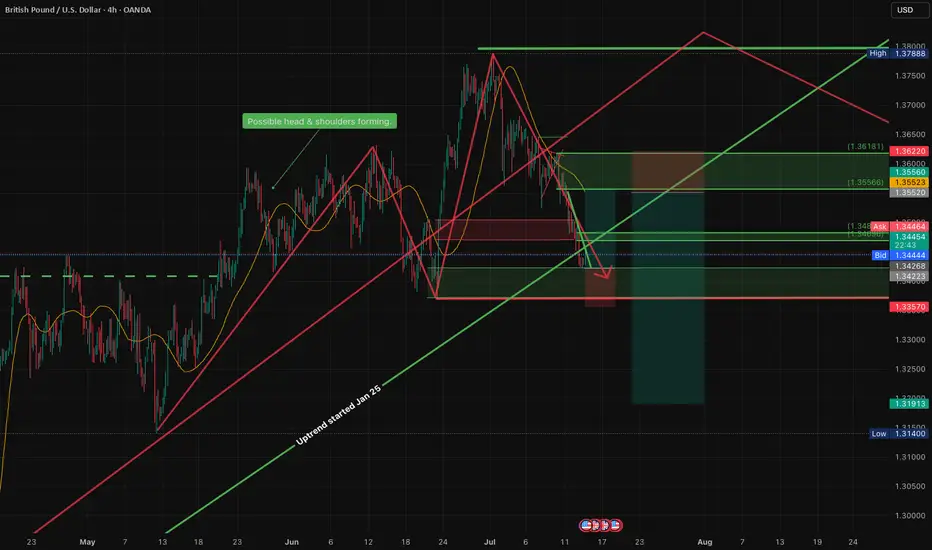
End of trend with Head & Shoulders forming. On the monthly chart the pair has been ranging between 1.2 and 1.43 since 2016 with resistance established 2018. Currently on up leg of third cycle. Ignoring the Liz Truss blip.
Daily chart uptrend established Jan 25 and should continue up to resistance. However possible head & shoulders forming, which would indicate change of character, at most recent cycle but a good trade up to right shoulder still possible and then it will change to down trend to trend line
4H - Price at good quality demand with 4 basing candles. Ready for reversal and long to potential right shoulder at 1.355 or higher all the way to multiyear resistance.
COT Non-com and retail are increasing positions and commercials are reducing. Valuation is cheap.
Plan: waiting for US CPI data and confirmation of direction change and then long with stop at 1.33570 and TP at 1.355 to right shoulder. (I like these as worst that can happen, after up move is confirmed, is H&S doesnt form and it continues to upside increasing R:R). Followed by good short.
Let me know what you think
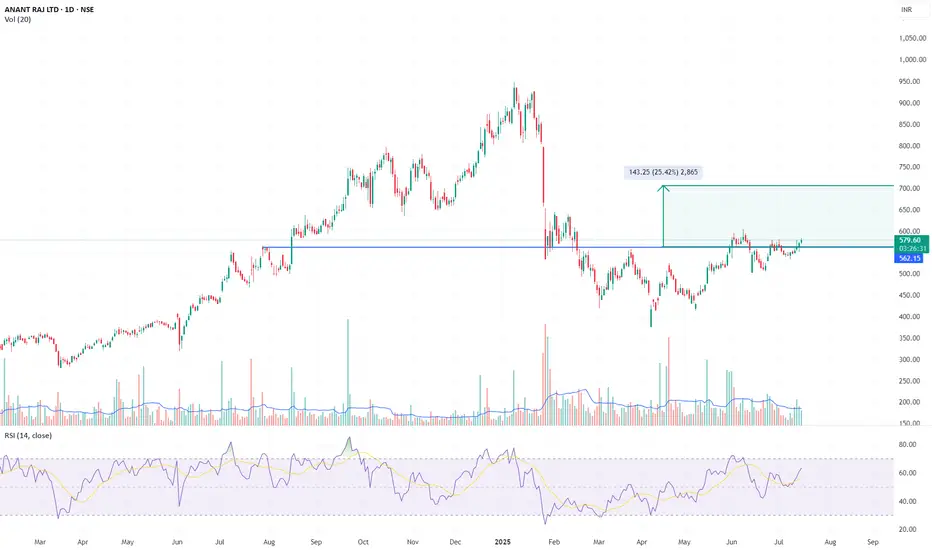
ANANT RAJ – Breakout From Rounded Base | ₹700+ Swing PossibleANANT RAJ has triggered a fresh breakout above the ₹580 zone – reclaiming its prior breakdown level from Feb 2025. This comes after a rounded base formation lasting 4+ months.
Breakout 1: June 2, on volume, cleared the March–May base
Breakout 2: Now taking out neckline of broader inverse H&S
Volume: Expanding again
RSI: Bullish, no divergence
Structure: Clean higher highs and lows post-Feb low
Measured Move Target: ₹700
Stop-Loss: ₹558
Fundamentals Support Swing Bias:
Low debt, strong solvency
Net profit margin ~21%
FY26 profit growth estimate ~32%
Valuation expensive (P/E ~46), but growth supports it short term
Not a long-term compounding candidate yet – monitor execution
Positioning:
Swing trade, not an investment. Ride momentum. Trail stops. No averaging up. Exit if ₹558 breaks on closing basis.
Disclaimer:
This analysis is for educational purposes only. It is not investment advice. Do your own due diligence. Trade at your own risk.
WIF/USDT: Dog back on track?WIF is building a "Cup And Handle" pattern alongside a (hopefully) last trendline, Trendline 1.
That breakout would lead back to the main keylevel, which is also the neckline of a H&S formation on a higher timeframe. To make it even more funny, that H&S is "the handle" of a even bigger cup n handle pattern on the next HTF.
So the break of trendline 1 might bring us to the keylevel, and that might start the H&S being "priced".

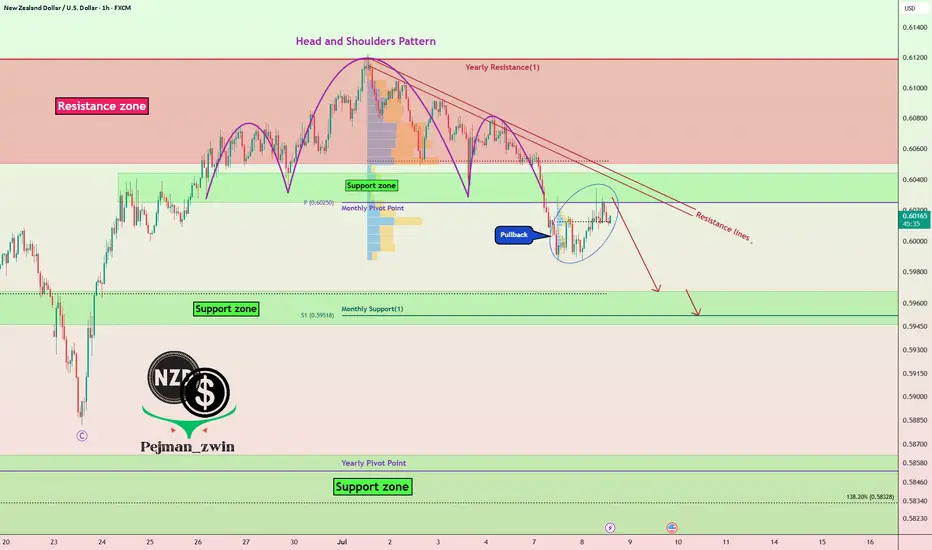
NZDUSD Pullback in Play – Head & Shoulders Signals More DownsideNZDUSD ( OANDA:NZDUSD ) is currently trading near the Resistance zone($0.612-$0.605) and has also managed to break the Support zone($0.604-$0.602) . We consider the Support zone as the neckline of the Head and Shoulders Pattern .
In terms of classic technical analysis , NZDUSD has managed to form a Head and Shoulders Pattern .
I expect NZDUSD to decline towards the Support zone($0.5968-$0.5946) after completing the pullback .
Note: Stop Loss(SL): $0.6062
Please respect each other's ideas and express them politely if you agree or disagree.
New Zealand Dollar/ U.S. Dollar Analyze (NZDUSD), 1-hour time frame.
Be sure to follow the updated ideas.
Do not forget to put a Stop loss for your positions (For every position you want to open).
Please follow your strategy and updates; this is just my Idea, and I will gladly see your ideas in this post.
Please do not forget the ✅' like '✅ button 🙏😊 & Share it with your friends; thanks, and Trade safe.
FET/USDT – Head & Shoulders Breakout!Hey Traders — if you're into high-conviction setups with real momentum, this one’s for you.
ONDO is trading inside a falling wedge on the daily chart — a classic bullish structure that often leads to explosive breakouts. 📈
FET just broke out of a classic inverse head & shoulders pattern — a strong bullish reversal structure! The breakout looks clean with a confirmed close above the neckline and volume starting to pick up.
💼 Entry: CMP ($0.75)
🎯 Targets: $0.85 / $0.95 / $1.09
🛑 Stop-loss: $0.705
📈 Risk-Reward: Favorable
🧠 Why it matters:
Clean breakout above resistance
Strong trend reversal structure
Potential for 40%+ move ahead.
💬 Are you in this breakout play or watching from the sidelines? Let’s talk below!
👉 Smash that LIKE and FOLLOW for more real-time setups!

POSSIBLE PLAY FOR THE WEEKHTF KEY LEVEL
1. Premium gap/volume imbalance (DAILY TF)
2. monthly inverted fvg premium marked in Blue lines
I'd be watching the hourly time frame to get a setup as marked in red to engage for the week.
NOTE: CPI Tuesday
Bitcoin Hits First Target: What I Traded and What Comes NextBitcoin just hit my first target. I went long on BTC, XRP, Chainlink, and more. Booked profits and jumped into two new breakouts with better risk-reward. In this video, I break down my trades, the setup, and why I’m still bullish between 116K and 120K. I also explain how crypto deregulation and the Genius Act could fuel the next move.
Let me know in the comments how you traded this breakout.
This content is not directed to residents of the EU or UK. Any opinions, news, research, analyses, prices or other information contained on this website is provided as general market commentary and does not constitute investment advice. ThinkMarkets will not accept liability for any loss or damage including, without limitation, to any loss of profit which may arise directly or indirectly from use of or reliance on such information.

Ascending Inverse H&S on the BTC weekly chartThe longer it takes to break above this neckline the higher the breakout target will be. I have arbitrarily placed the measured move line at July 18th 2025. If the breakout were to happen on that day the measured move target is around 208k, which could take quite awhile to reach or if we entered a truly hyperparabolic blow off top we could reach such a target way quicker than when the dotted measured move line reaches it. *not financial advice*

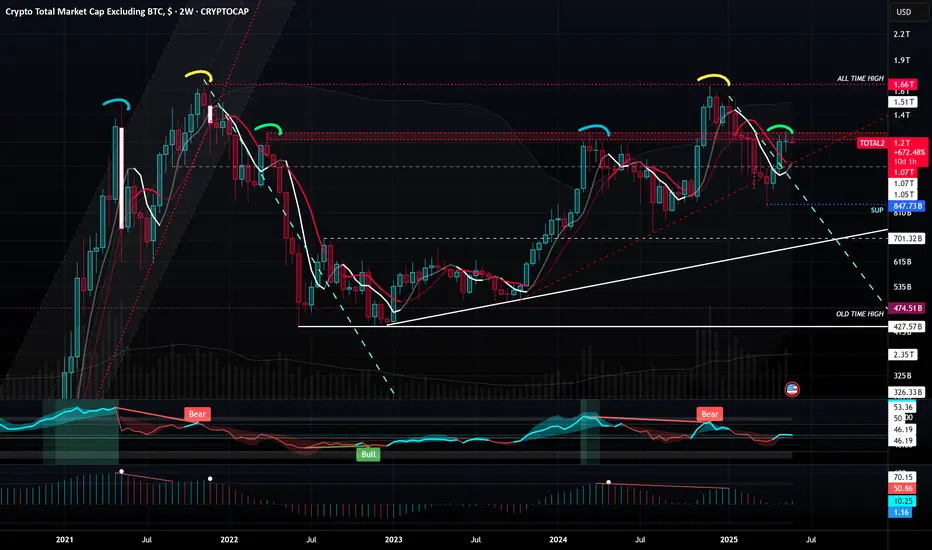
Crypto 2021-22 Rerun?Crypto ex-BTC looks like an identical setup with high, divergent higher high, dead cat bounce, with the same level of resistance in play (both double top and 'right shoulders')
Shitcoins and crypto are much less popular among retail this time around, which has me thinking a FOMO surge to new highs is off the table this time.
I think there's a short setup here, but posting before a break confirmation has occurred anyway (so technically still neutral today). I dont trade crypto, but follow the trends and this just stood out to me enough to share.
Crypto in July 2025: A Financial Reset from Macromics GroupThe world of cryptocurrencies in July 2025 is experiencing more than just another growth cycle — it’s undergoing a fundamental transformation of the global financial system. Amid geopolitical instability, tighter control over digital assets, and growing interest from institutional investors, digital currencies are once again in the spotlight. Macromics Group shares its latest analytical insights on the key events and trends.
A New Bull Run: Ethereum 3.0 and Bitcoin Network Upgrade
Since the start of summer 2025, Ethereum has shown strong growth, largely due to the launch of Ethereum 3.0, which reduced transaction fees and made the network more scalable. Bitcoin, in turn, has undergone another major security upgrade, attracting new institutional investors, including funds from Japan and Saudi Arabia.
CBDCs and Regulation: Governments Shift Approach
Central banks are actively rolling out central bank digital currencies (CBDCs). China, India, Brazil, and the EU have expanded pilot programs for their national digital currencies. This has led to increased interest in stablecoins backed by fiat currencies and greater demands for transparency on DeFi platforms.
Macromics Group helps clients navigate these new dynamics, offering up-to-date analytical resources and capital protection strategies across both regulated and unregulated sectors of the crypto market.
NFTs Make a Comeback — In the Corporate World
A new wave of interest in NFTs is emerging, not from artists, but from the corporate sector. Companies are using tokens for intellectual property, document verification, and digital rights management. Macromics Group is investing in startups building infrastructure for business-focused NFTs — a clear sign of the technology’s long-term potential.
AI + Blockchain: A Union of Future Technologies
In 2025, two mega-trends are converging: artificial intelligence and blockchain. AI-powered protocols are automating trading, cybersecurity, and even smart contract audits. Macromics Group is already implementing these technologies into its analytical tools and services.
What’s Next? Macromics Group Forecast
According to our data, the crypto market has entered a phase of "conscious growth" — where technology, regulation, and real-world utility are evolving in harmony. In the coming months, we anticipate increased attention toward:
DePIN projects (decentralized physical infrastructure)
Tokenized real-world assets (real estate, gold)
ESG-focused cryptocurrencies
Conclusion: Don’t Just Invest — Understand
Macromics Group urges investors to go beyond participation — to become informed decision-makers. We provide deep analytics, access to unique tools, and expert support at every stage of crypto investing. July 2025 is the perfect time to rethink your strategy and take a step into the future.
Macromics Group — your expert in the world of digital assets.

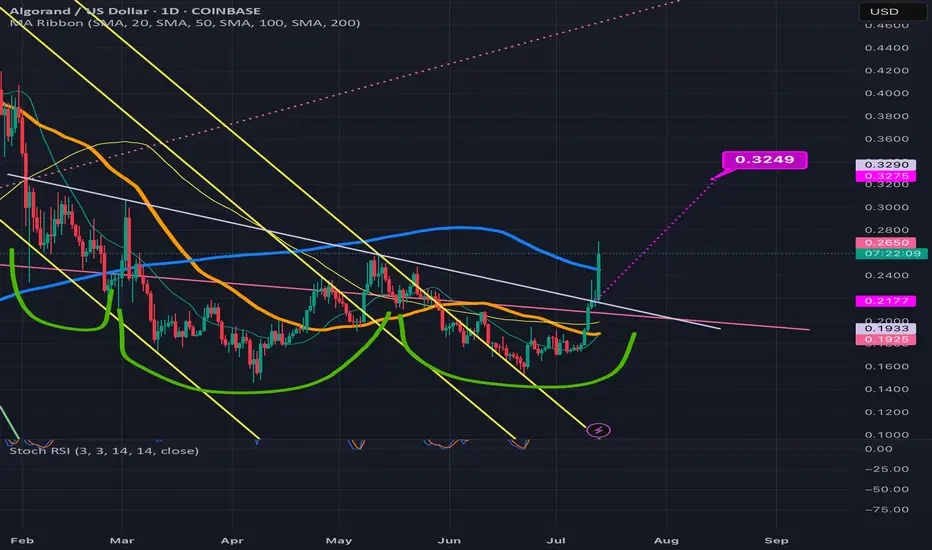
Algorand breaking up from inverse head and shouldersSeems like most of the cryptos from the iso20022 compliant chains are breaking out right now and algorand is no exception. Most likely in anticipation of Fednow’s migration to it tomorrow. *not financial advice*
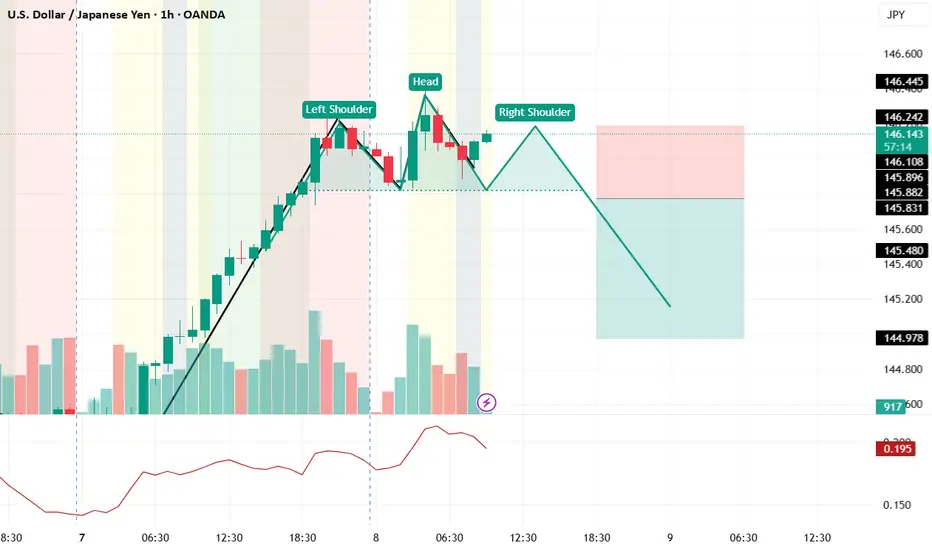
usdjpy head and shoulder emergingexperimental !!! it can be a possible scenario , pls feel free to coment and share your ideas with me hop you have green portfolio!!!
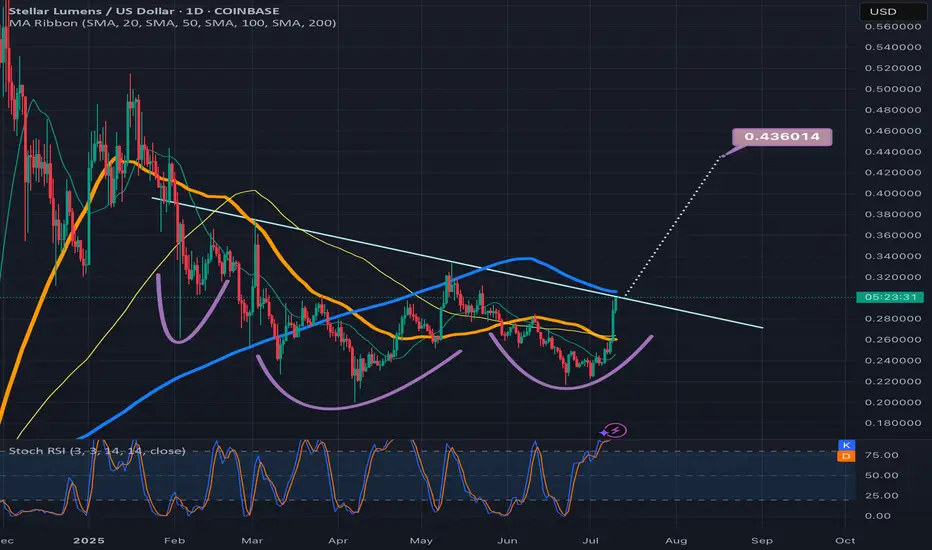
XLMUSD inv h&s at the threshold of the necklineNo confirmation yet but market currently feeling very bullish here. Likely to breach this neckline in the next few candles. *not financial advice*
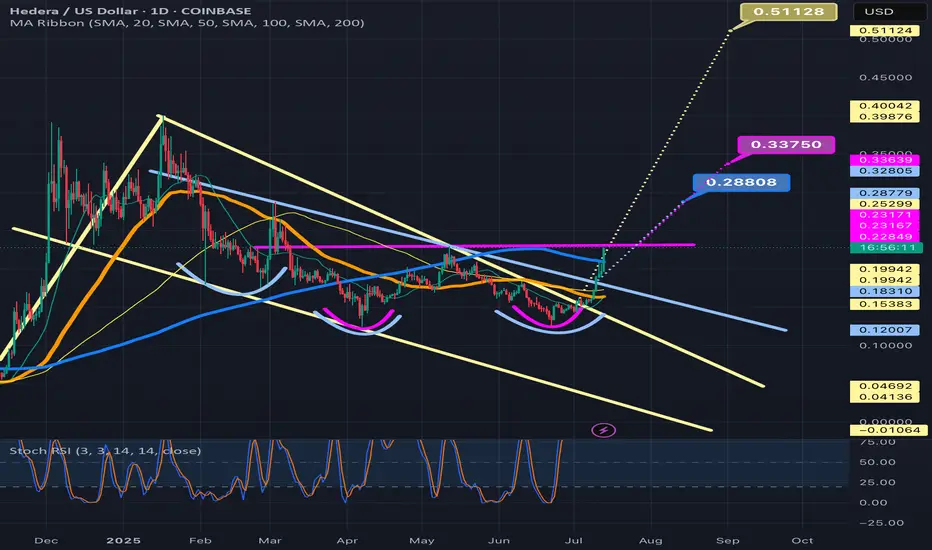
A linear Chart version of the current HBAR bull patternsIt just dawned on me that I had my chart on logarithmic for the previous 2 posts I amde about HBARUSD. As usual, the chart patterns on the log chart tend to have much higher breakout targets than the version of the chart patterns that appear on the linear chart. As soon as I realized this I went back in and adjusted the patterns to their linear chart erosions. The inverse head and shoulders remained mostly the same but the bullflag/desceding channel has now morphed into a falling wedge/bullish pennant. As you can see the breakout target for all 3 patterns is a much lower price than what the price targets were on the logarithmic chart. That’s not to say that the logarithmic targets are invalid, I think what will most likely occur Ike usually is both chart’s targets will be validated, it will likely just take much longer for the logarithmic chart’s targets to be reached as is how things usually pan out. *not financial advice*