Can Gold Really Drop 10% in a Day?📘 EDUCATIONAL POST: Can Gold Really Drop 10% in a Day? Let’s Break It Down
Alright, traders—before you start thinking the sky is falling, let’s look this chart straight in the face and get real.
⸻
🔍 The Setup Right Now
Here’s what’s showing up:
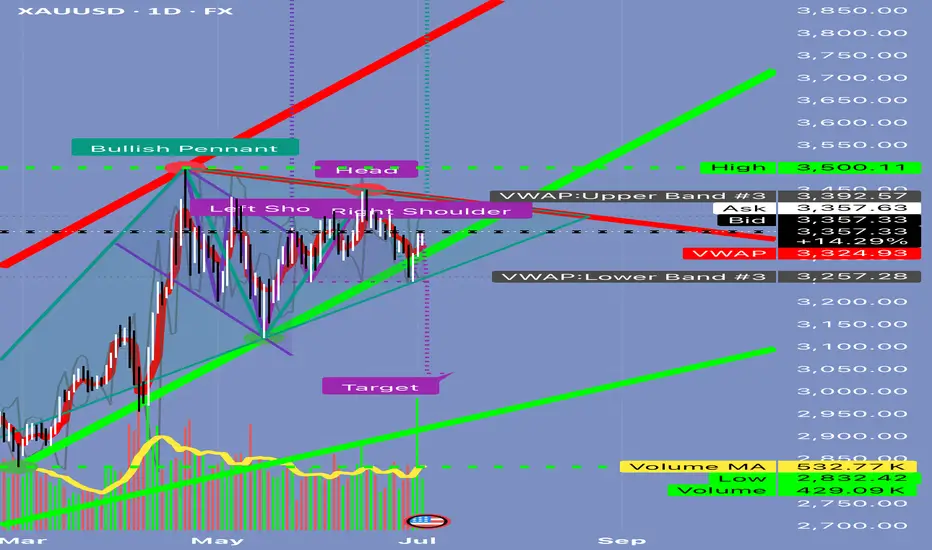
✅ A bullish pennant forming up top (potential continuation higher).
✅ A big head and shoulders pattern in the middle (bearish).
✅ VWAP bands ranging from ~3,257 to ~3,392.
✅ Volume is underwhelming—426k vs 582k average.
✅ A big target line all the way down near 3,000.
This mix of signals can be confusing. Let’s separate the hype from what’s actually possible.
⸻
🎯 Q: Can the market collapse to 3,000 tomorrow?
Short Answer:
No.
Here’s Why:
1️⃣ Move Size:
• Current price is ~3,357.
• Target is ~3,000.
• That’s a -357 point drop (~10.6%) in one session.
• For gold CFDs, this would be an extreme event only seen in major crises (think 2008 or March 2020).
2️⃣ Volume Context:
• Today’s volume is below average.
• Big crashes are usually preceded by heavy distribution—this isn’t showing yet.
3️⃣ VWAP Anchors:
• The lower VWAP band sits at 3,257.
• Reaching 3,000 would require breaking through 3,257 support, 3,100, and months of prior buying interest.
4️⃣ Market Environment:
• It’s the July 4th holiday in the U.S.—liquidity is thin.
• Thin markets can gap lower but rarely hold a massive drop without a big catalyst (e.g., credit crisis, war headlines).
5️⃣ Pattern Confirmation:
• Yes, the head and shoulders pattern is visible.
• But to confirm it, you need:
🔹 A clear break of the neckline with double average volume.
🔹 Follow-through that pushes below 3,257.
• None of this has happened yet.
⸻
✅ What’s Realistically Possible Tomorrow?
If sellers show up, here’s what a big bearish day might look like:
1️⃣ First Move:
• Rejection at 3,357–3,392 resistance.
• Pullback toward ~3,324 (mid VWAP).
2️⃣ Continuation:
• Drop down to ~3,257 (VWAP lower band).
3️⃣ Extreme Scenario:
• Retest of 3,200–3,150 zone.
But a flush all the way to 3,000?
👉 Highly unlikely unless there’s a major global shock.
⸻
💡 Trading Tip: Stay Tactical
If you want to position short:
✅ Wait for rejection at 3,357–3,392.
✅ Short targeting 3,324 first.
✅ Scale profits there.
✅ Only hold runners for 3,200–3,150 if momentum accelerates.
⸻
🔑 Key Takeaway
3,000 is a structural target—this means it’s a price objective that might play out over weeks, not hours.
Trying to catch that in one day is chasing a black swan.
Stay patient. Trade levels, not headlines.
⸻
⚠️ Disclaimer:
This post is for educational purposes only. Always do your own research before trading.
⸻
✅ If you found this helpful, share it with someone who panics every time a red candle shows up.
Head and Shoulders
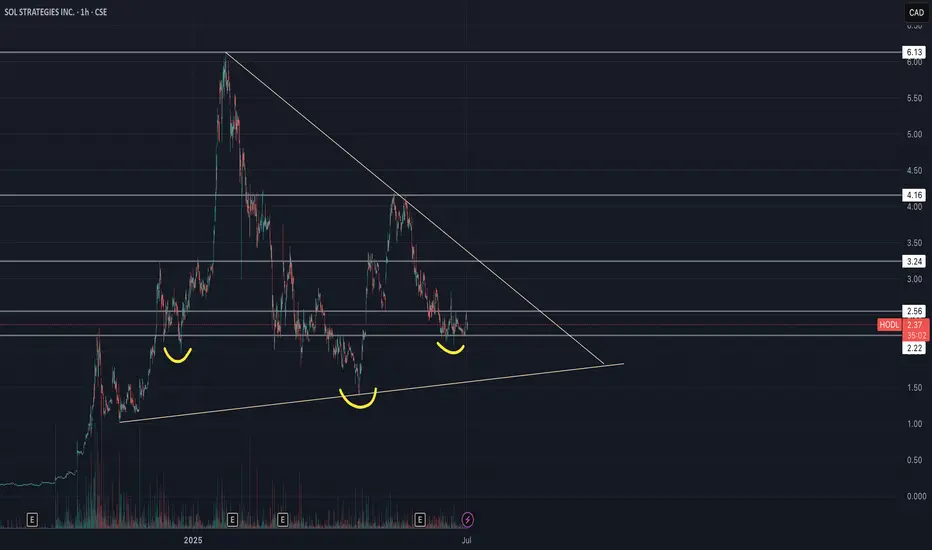
Sol Strategies Inc (HODL) - Inverse H&S🚀 SOL Strategies (HODL) – Public Market Gateway to Solana Yield
SOL Strategies (CSE: HODL) is a publicly traded company laser-focused on the Solana ecosystem. With nearly 395,000 SOL held (most of it staked) and over 3.7 million SOL delegated to their validators, they generate consistent income through staking rewards and validator commissions.
Their business model is simple:
📌 Accumulate SOL → Stake it → Run institutional-grade validators → Earn yield
📌 Expand through partnerships (3iQ, Neptune, BitGo, Pudgy Penguins)
📌 Hold strategic Solana ecosystem tokens like JTO and jitoSOL
📌 Operate with SOC 2-certified infrastructure and pursue a Nasdaq listing
SOL Strategies is not just holding crypto – they are building core infrastructure for Solana, giving equity investors direct exposure to staking economics in one of the fastest-growing blockchain networks.
📊 For traders: HODL stock offers a pure-play vehicle for Solana exposure, with an income-generating twist.
⚠️ Always do your own investment research and make your own decisions before investing.
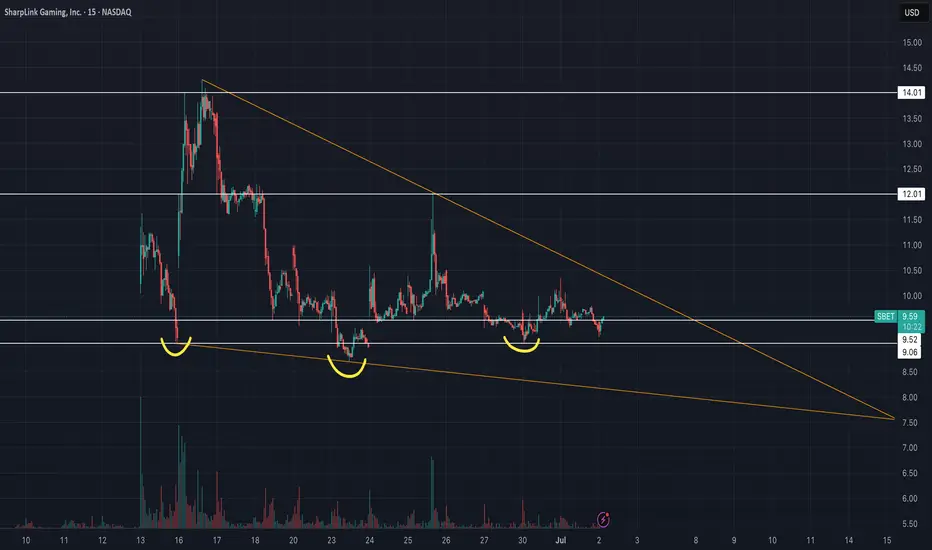
SharpLink Gaming Inc (SBET) - Falling Wedge & Inverse H&S🚀 SharpLink Gaming ( NASDAQ:SBET ) – Ethereum, Joe Lubin & a Bullish Setup
SharpLink Gaming has undergone a bold transformation: the company is now the largest public holder of Ethereum (ETH), with ~198,000 ETH acquired since June 2025. Over 95% of it is staked, already earning 200+ ETH in rewards – turning ETH into a yield-bearing treasury asset.
Driving this shift is Joe Lubin, co-founder of Ethereum and CEO of ConsenSys, who recently became Chairman of SharpLink. Under his leadership, SBET is betting big on Ethereum as “digital capital”, aiming to merge iGaming and Web3.
📊 Technical Setup:
SBET is forming a falling wedge and an inverse head and shoulders – both classic bullish reversal patterns. After a post-announcement retracement, the chart suggests growing potential for a breakout as fundamentals strengthen.
🧠 My thesis: This is MicroStrategy playbook 2.0 – but with ETH instead of BTC. SharpLink gives equity exposure to Ethereum + staking yield + visionary leadership.
🔔 Worth watching closely.
⚠️ Always do your own investment research and make your own decisions before investing.
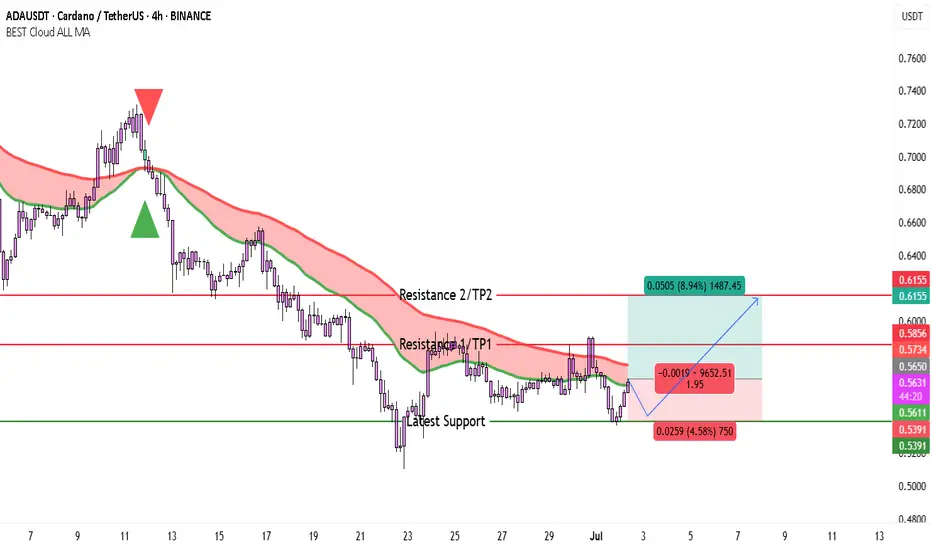
$ADA Bulls Wake Up—Potential 9% Rally If This Level HoldsCardano (ADA) appears to be attempting a short-term recovery after a prolonged decline, as shown in the 4H chart from Binance. The price recently bounced from a well-defined support level around $0.5391, which has held multiple times in recent sessions, confirming buyer interest in this zone. This support also aligns with a previous consolidation range and has proven reliable in the past.
The price is now approaching a zone of dynamic resistance marked by the BEST Cloud ALL MA indicator. This red-shaded cloud represents the bearish control zone, and ADA has repeatedly failed to break through this area in recent weeks. However, ADA is now showing early signs of upward momentum as it consolidates just beneath the first resistance at $0.5734 (also marked as TP1). This resistance corresponds with the bottom of the cloud and recent swing highs.
The broader trend is still bearish, but the structure suggests a possible reversal if bulls can reclaim levels above the cloud. A further push above $0.5734 could attract fresh buying interest and target the next resistance level near $0.6155, which also represents TP2 on the chart. This upper zone served as a breakdown point in mid-June and may now act as a key level to watch.
Meanwhile, the green moving average line (part of the cloud setup) is starting to flatten. This often signals a transition from downtrend to range or even an early reversal—especially when combined with a support bounce and higher low formation.
There’s no clear bullish breakout yet, but the setup looks favorable for a cautious long position.
Trading Idea
• Entry Zone: 0.5550 – 0.5600 (near current consolidation)
• Target 1 (TP1): 0.5734
• Target 2 (TP2): 0.6155
• Stop Loss: Below 0.5391 (e.g., 0.5320 – adjust based on your risk appetite)
• Risk/Reward to TP2: Around 2:1
If price breaks below $0.5391, the bearish structure would be confirmed, possibly leading ADA back toward the $0.50–$0.48 region. But as long as this support holds, the market favors a recovery scenario toward the resistance levels mentioned.
Overall, this is a textbook support-to-resistance play, with potential for an 8–9% upside if bullish momentum sustains. Confirmation through volume breakout above the cloud will further strengthen the case for short-term gains.
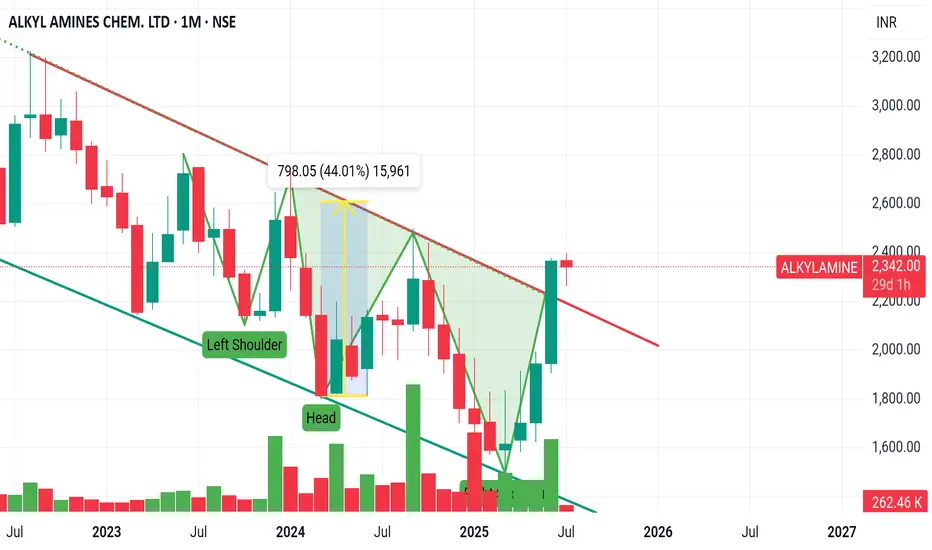
Bullish patterns & Monthly Breakouts in Alkyl AminesGood afternoon Folks, This stock has given us a breakout from falling wedge pattern and from inverse H & S pattern and with a strong green candle
- The next step is either you can enter now as a big green candle without rejection shows bulls strength.
- Next is to wait for the 2nd green candle closes around high which acts as confirmation and the classical way to trade breakouts.
- Now as per the John Murphy's book the target for Inverse H&S Breakout will be the size of head which I have marked in yellow which suggest 44% upmove or else you can use pivots which gives you support and resistance which can help you to understand from where price is taking support or where it is facing rejection.
- it will also helps you with target and stoploss.
THIS ARE MY PERSONAL VIEWS OR ANALYSIS NOT ANY RECOMMENDATIONS.
Bitcoin summer of fun...If we are in a continuation pattern, and Bitcoin breaks the neckline soon.
We could be on the cusp of a very interesting and strong few months of price action.
Continuation upward sloping #inverseheadandshoudlers

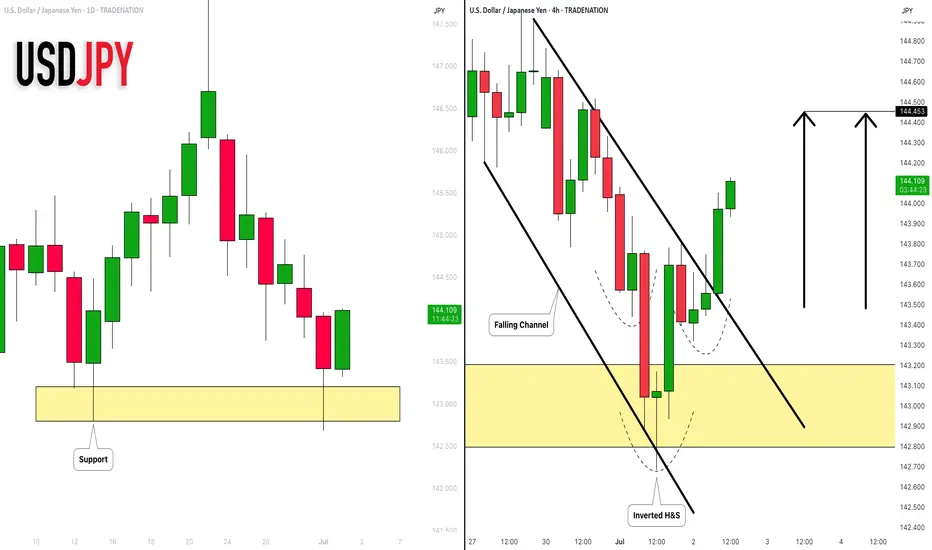
USDJPY: Strong Bullish Price Action 🇺🇸🇯🇵
I see 2 strong bullish confirmation on USDJPY after a test of a key daily
support cluster.
The price violated a trend line of a falling channel and a neckline of
an inverted head & shoulders pattern with one single strong bullish candle.
The pair may rise more and reach 144.45 level soon.
❤️Please, support my work with like, thank you!❤️
I am part of Trade Nation's Influencer program and receive a monthly fee for using their TradingView charts in my analysis.
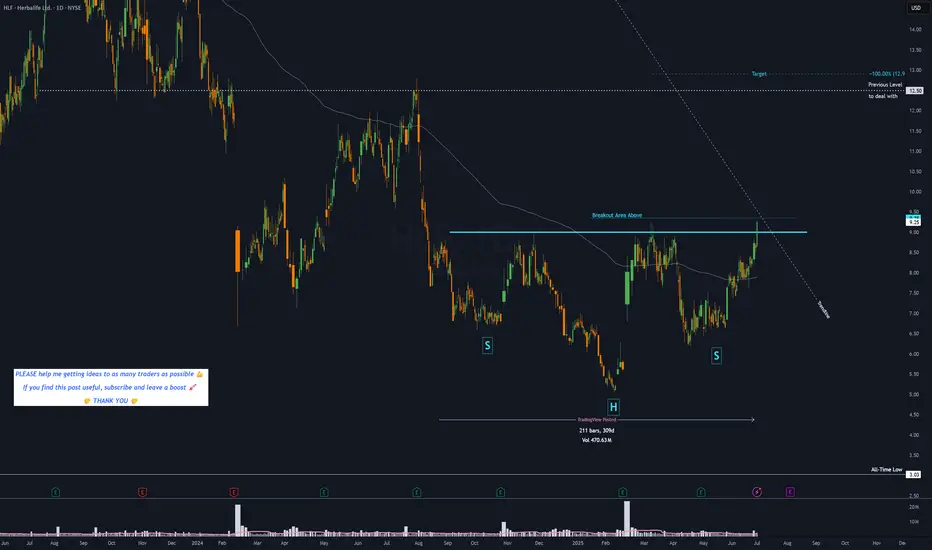
HLF - 10 months HEAD & SHOULDERS══════════════════════════════
Since 2014, my markets approach is to spot
trading opportunities based solely on the
development of
CLASSICAL CHART PATTERNS
🤝Let’s learn and grow together 🤝
══════════════════════════════
Hello Traders ✌
After a careful consideration I came to the conclusion that:
- it is crucial to be quick in alerting you with all the opportunities I spot and often I don't post a good pattern because I don't have the opportunity to write down a proper didactical comment;
- since my parameters to identify a Classical Pattern and its scenario are very well defined, many of my comments were and would be redundant;
- the information that I think is important is very simple and can easily be understood just by looking at charts;
For these reasons and hoping to give you a better help, I decided to write comments only when something very specific or interesting shows up, otherwise all the information is shown on the chart.
Thank you all for your support
🔎🔎🔎 ALWAYS REMEMBER
"A pattern IS NOT a Pattern until the breakout is completed. Before that moment it is just a bunch of colorful candlesticks on a chart of your watchlist"
═════════════════════════════
⚠ DISCLAIMER ⚠
Breakout Area, Target, Levels, each line drawn on this chart and any other content represent just The Art Of Charting’s personal opinion and it is posted purely for educational purposes. Therefore it must not be taken as a direct or indirect investing recommendations or advices. Entry Point, Initial Stop Loss and Targets depend on your personal and unique Trading Plan Tactics and Money Management rules, Any action taken upon these information is at your own risk.
═════════════════════════════
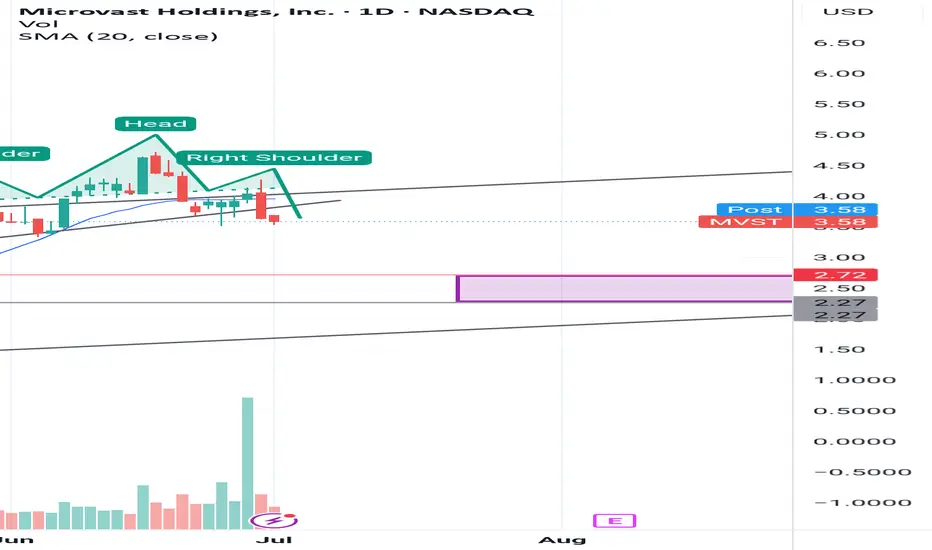
MVST - Bearish Head & Shoulders Breakdown Targeting $2.25–$2.75A classic Head and Shoulders pattern has formed on MVST's daily chart, with a clear neckline break to the downside. This technical setup suggests bearish momentum in the short term, with a likely price target between $2.25 and $2.75.
This zone also aligns with a prior consolidation area and dynamic support. I expect the stock to potentially find a bottom in this area. If MVST can deliver strong Q2 earnings in August, a bullish reversal from that demand zone could follow.
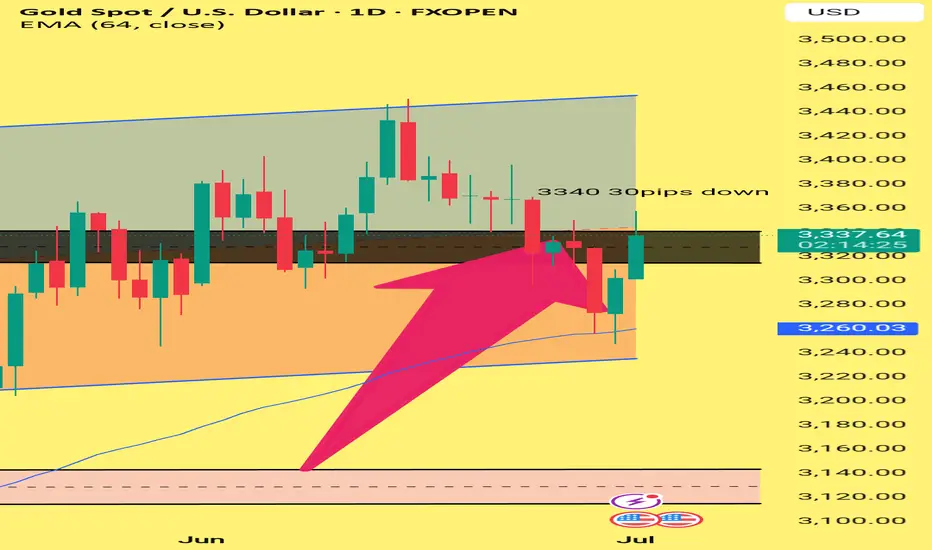
Title: Rejection at 3340 – Gold Struggles to Break ResistanceGold faced a clear rejection at the 3340 zone, dropping nearly 30 pips. This confirms that the 3335–3340 area remains a strong resistance. If price fails to break above this zone, we may see a move towards 3330 in the coming sessions. EMA 64 is now the key support to watch.
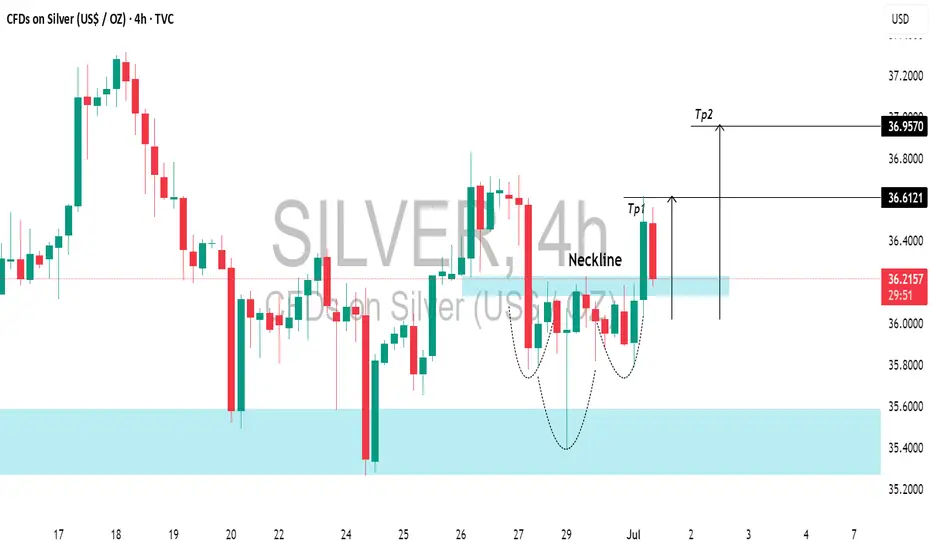
SILVER (XAGUSD): Pullback From SupportIt seems that the time has come for 📈SILVER to experience a pullback.
This morning, I've observed a solid intraday bullish signal with the emergence of a head and shoulders pattern on the 4-hour chart.
I anticipate a pullback to at least 36.61, followed by a move to 36.95.
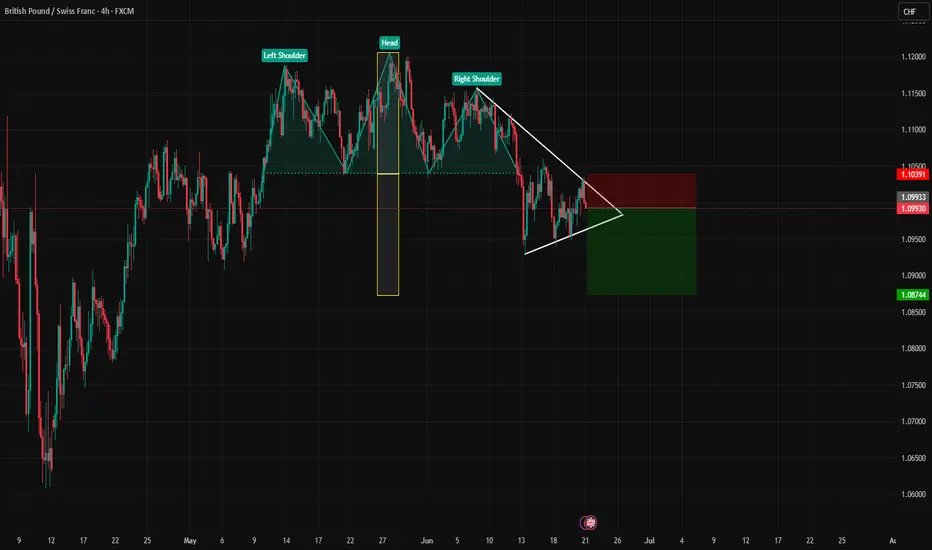
GBPCHF shortGBPCHF has formed a HNS pattern at H4. Followed by rejected price recent from a drawn trendline, I foresee price will continue dropping, broken down the lower trendline until reach the size of the HNS 1:1.
USDJPY | Massive Head & Shoulders Top – 2500+ Pips | Weekly📍 Pair: FX:USDJPY (U.S. Dollar / Japanese Yen)
📆 Timeframe: 1W (Weekly)
📉 Price: 144.22
📊 Pattern: Head & Shoulders (macro top)
🔍 Technical Setup:
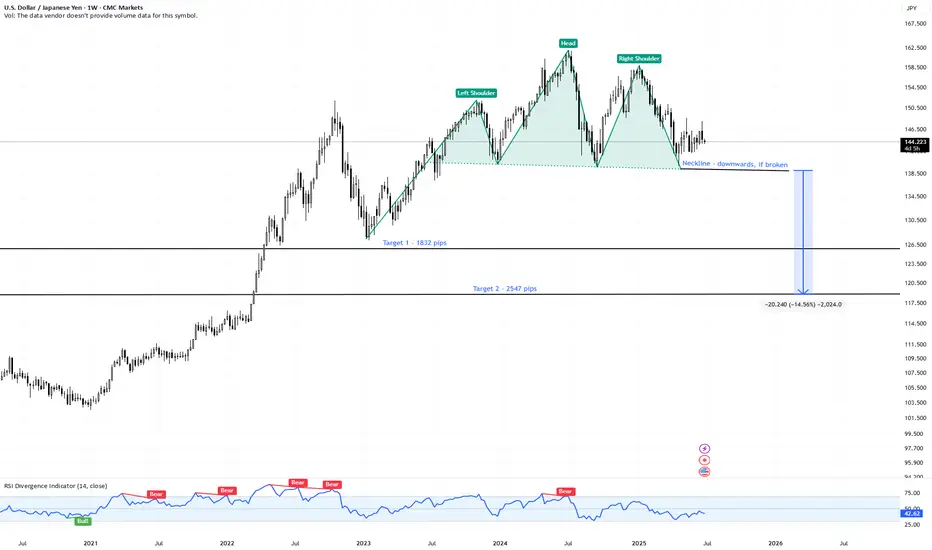
USDJPY has formed a textbook Head & Shoulders pattern on the weekly chart, suggesting a potential multi-thousand pip reversal if the neckline fails.
🟩 Left Shoulder – Head – Right Shoulder structure is clear
🔻 Neckline sits near 137.00 – a major support zone
🔺 Pattern took over a year to form — signals significant macro exhaustion
🧠 Trade Plan & Targets:
❗️ Trigger: Weekly close below 137.00 (neckline breakdown)
⛔️ Invalidation: Close back above 151.00 (right shoulder high)
🎯 Target 1: 126.90
→ 📉 Move: -1,832 pips
🎯 Target 2: 118.80
→ 📉 Move: -2,547 pips
🔭 Both targets are based on measured move logic from the height of the head to the neckline, projected downward.
⚠️ Key Observations:
Sideways price action forming the right shoulder = distribution zone
Breakdown would shift trend from bullish to bearish on a long-term scale
Potential for carry trade unwind and safe-haven yen demand if macro tensions rise
💬 Are we on the verge of a major USD reversal vs the yen?
📌 Watch for a confirmed weekly break below 137.00 — this setup could define Q3–Q4.
#USDJPY #Forex #HeadAndShoulders #JPYStrength #TrendReversal #TechnicalSetup #TargetTraders
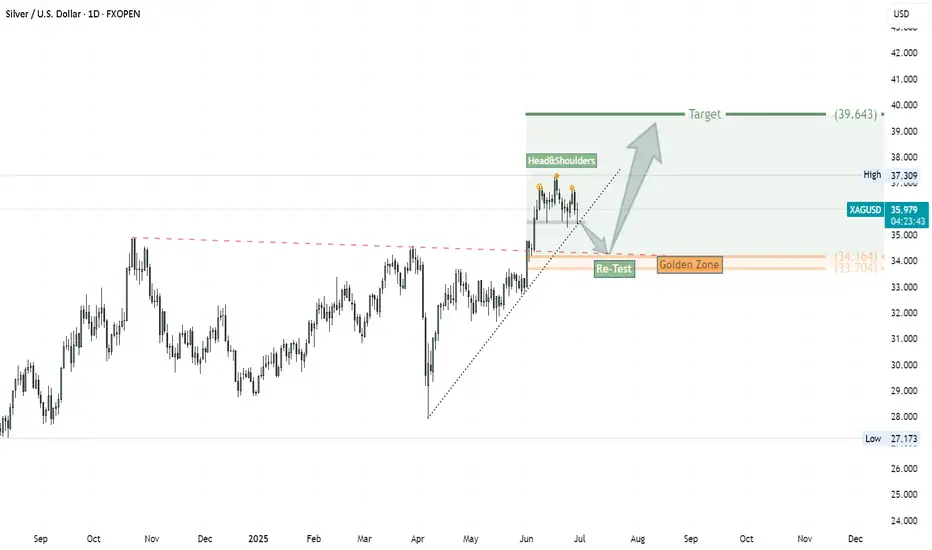
Possible Movement of Silver: Watch the Golden Zone RetestSilver has broken above a two-top downtrend with a strong bullish impulse, marked by a long white candle. Currently, it appears to be forming a Head and Shoulders pattern. A break below the neckline and the supporting uptrend could lead price back to the golden zone—around the base of the breakout candle—before resuming its upward move toward the main target near $39.
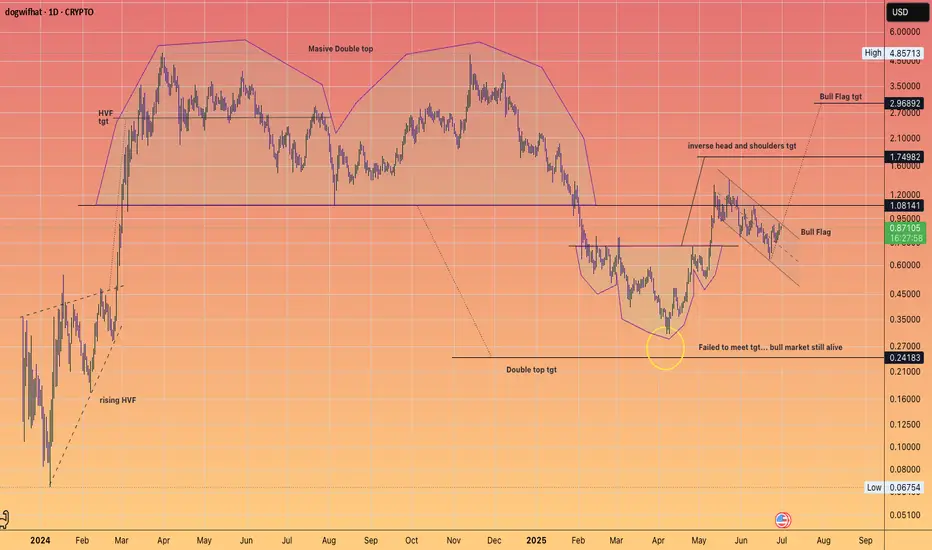
WIF back to $3Complete look at Dog WIF Hat
We had some pretty nice technical setups on this meme.
#HVF
#DoubleTop
#InverseHeadandShoulders
#BullFlag
Currently it has two active patterns ...
silver head and shoulder pattern price breakout in first week of june then sideways entire month
during same time gold was selling off below $3430 resistance and fed was very hawkish on stagflation
if buyers stopped buying and seller come in then price can breakdown then neckline of pattern

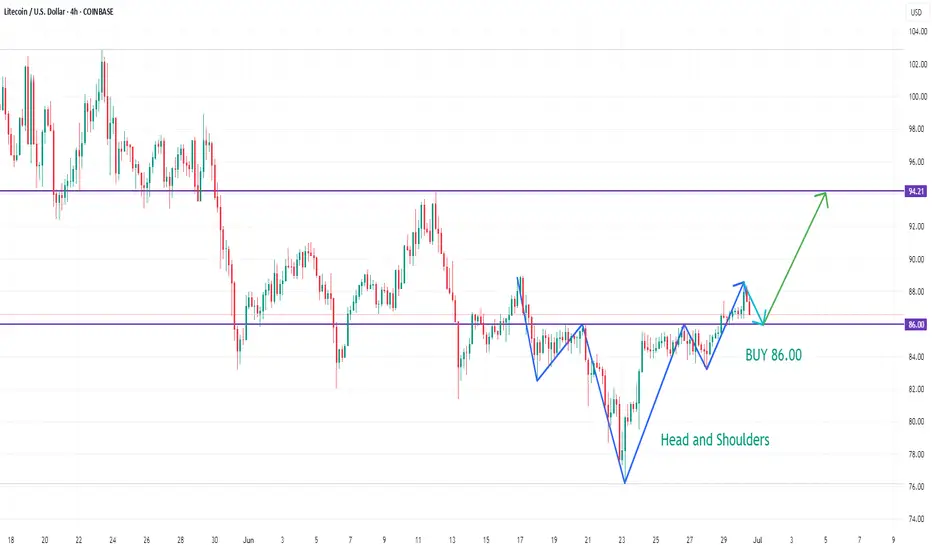
LTCUSD BUY 86.00On the 4-hour chart, LTCUSD has formed a head and shoulders bottom pattern. Currently, we can pay attention to the support near 86.00. If it falls back and stabilizes, we can consider buying. The upper resistance is around 94.20.
BTC/USD Technical Analysis – Weekly Elliott Wave StructureIn this video, we analyze the weekly chart of Bitcoin ( BYBIT:BTCUSDT ) using Elliott Wave theory.
The current structure suggests the beginning of a new bullish impulse (waves 0, 1, and 2) following a clearly completed and technically correct corrective phase.
We explore potential impulsive scenarios starting from wave 2, using Fibonacci extensions to project possible targets and identifying key support zones and invalidation levels.
This analysis aims to provide a macro perspective based on price action, helpful for traders and investors following BTC from a medium- to long-term technical view.
🛑 Disclaimer: This content is for educational and informational purposes only. It does not constitute investment advice. Each user is responsible for their own trading decisions.

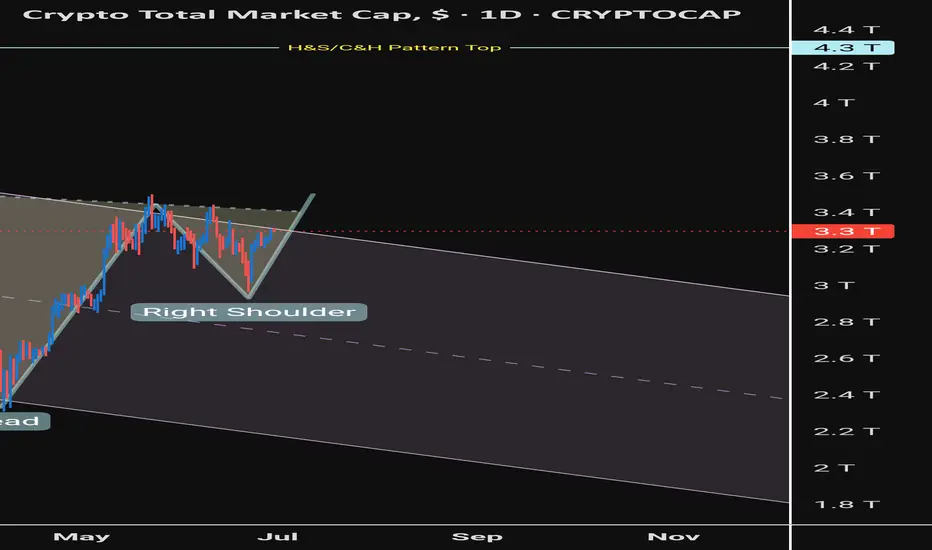
Inverse head and shoulders pattern forming on the Total Chart!This is the full chart from my previous published idea. Lol
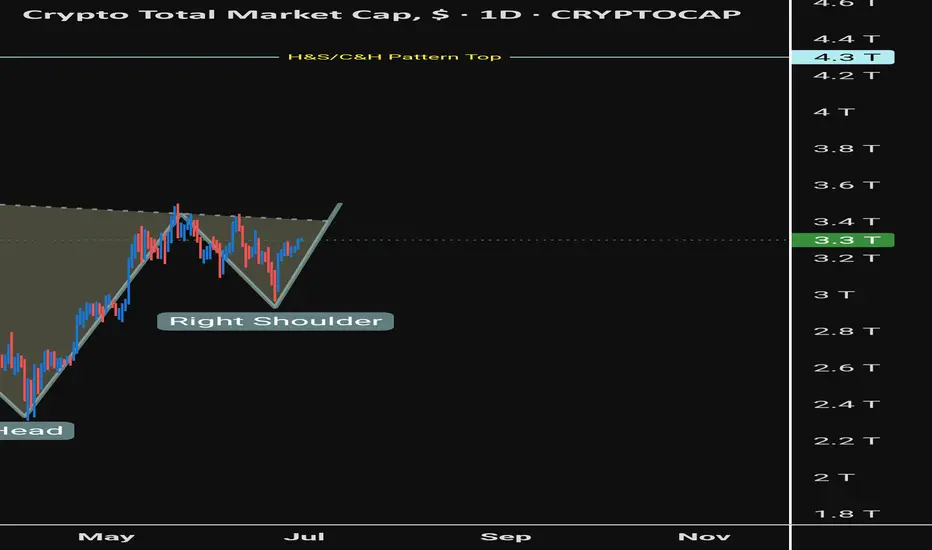
Inverse head and shoulders pattern forming on the Total Chart.There's either an inverse head and shoulders pattern forming on the Total chart or it's a cup & handle pattern. Either way they are both extremely bullish and roughly have the same price target!
What are your thoughts? Please tell me in the comments and thank you for looking at my chart! 😊
3 months holdingHINDPETRO made inverse head & shoulder pattern on WEEKLY charts with above average volume.
Could b bought in cash & hold for 2-3 months for target of 540.
Note: These are future levels,adjust it in cash levels.

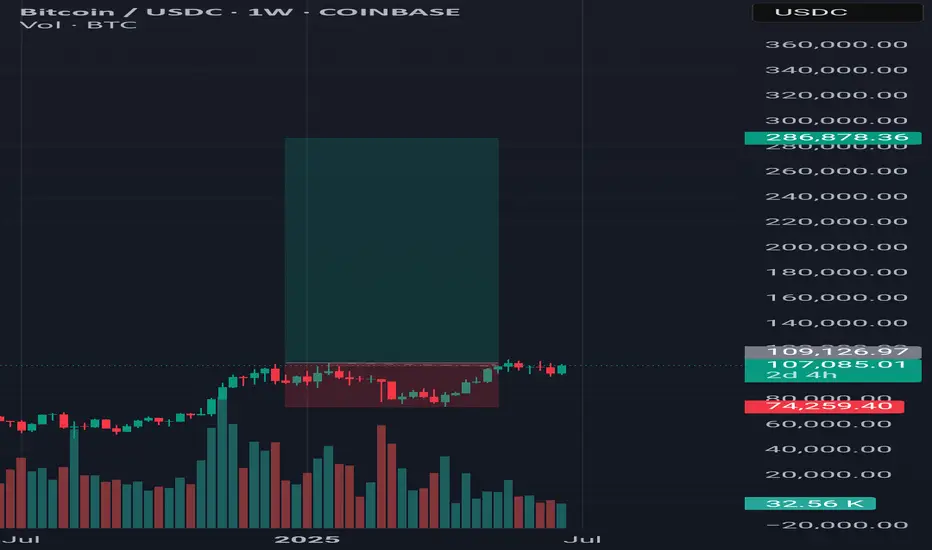
Btc have big long chanceI want to get an optimistic scenario from Bitcoin, which can increase up to five times as far as the history of Hawings.
🇮🇷Long Live Iran🇮🇷
Gold Confirms Breakdown — Eyes on $3100 TargetGold has broken below the neckline of multiple Head & Shoulders formations, signaling potential downside continuation. This technical development opens the path toward the projected target around $3100, Let’s monitor whether the pattern fulfills its full potential.
#Gold #XAUUSD #HeadAndShoulders #TechnicalAnalysis #ChartPattern #GoldForecast #TradingView #Commodities #PriceAction
