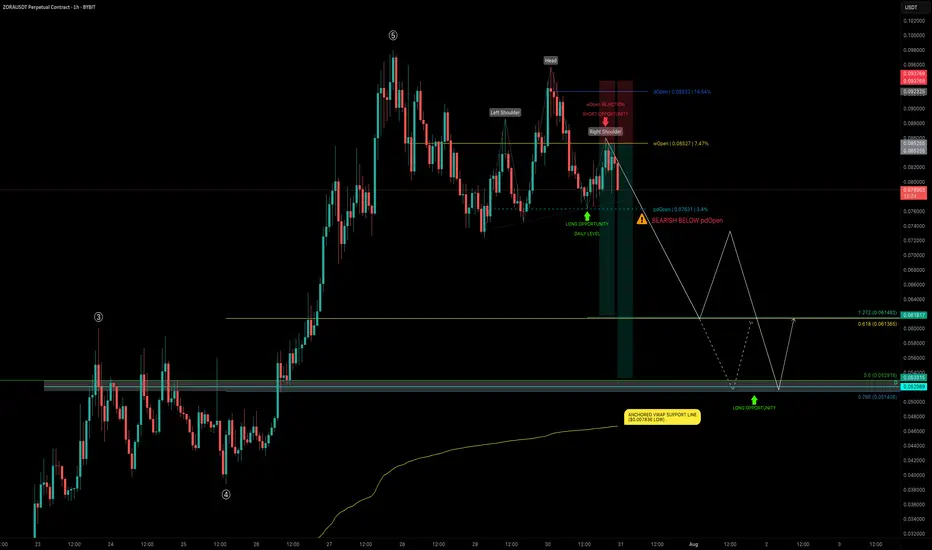
ZORA 5-Wave Completion — 30% Crash Incoming?After exploding +1150% in just 20 days and completing all 5 waves, ZORA is now consolidating — trading sideways just under the $0.10 psychological level for the past 4 days.
📉 Current Market Structure
The current structure shows signs of a developing Head & Shoulders pattern, with price:
Trading below the daily open (dOpen) and weekly open (wOpen) → Bearish signs
Hovering near the prior daily open (pdOpen) → a breakdown here would confirm bearish continuation
🔴 Short Setup - Bearish Scenario
If ZORA breaks below pdOpen, we’re likely heading for:
0.618 Fib retracement at $0.06137 of the final wave 5
Confluence with 1.272 Trend-Based Fib Extension (TBFE) at $0.06148
This zone marks the next high-probability reaction point and a potential long opportunity if price shows a bounce or reversal.
📉 Overall Short Trade Target
The full retracement target sits between $0.0529 and $0.0514, offering multiple layers of confluence:
0.5 Fib retracement of the full 1150% move
0.786 Fib retracement of the final wave 5
Aligned with an old trading range and daily level
This makes it an ideal demand zone for patient bulls but only once price confirms.
💡 Educational Insight
This setup highlights an example of Elliott Wave Theory in action — after a strong 5-wave impulse move, markets often enter a corrective phase. The completion of wave 5, especially near key psychological levels like $0.10, often marks a local top, where price corrects toward key Fibonacci retracement zones.
Combining wave structure with confluence factors like Fib levels, VWAP, and prior trading ranges helps traders identify high-probability reversal zones — allowing for better timing, risk management, and trade planning. Always wait for confirmation before jumping into any trades.
Summary
Bearish continuation confirmed on pdOpen breakdown
First support zone: $0.0613–$0.0614
Final downside target: $0.0529–$0.0514
Look for long opportunities only on reaction + confirmation
_________________________________
💬 If you found this helpful, drop a like and comment!
Want breakdowns of other charts? Leave your requests below.
Headandshouldersformation
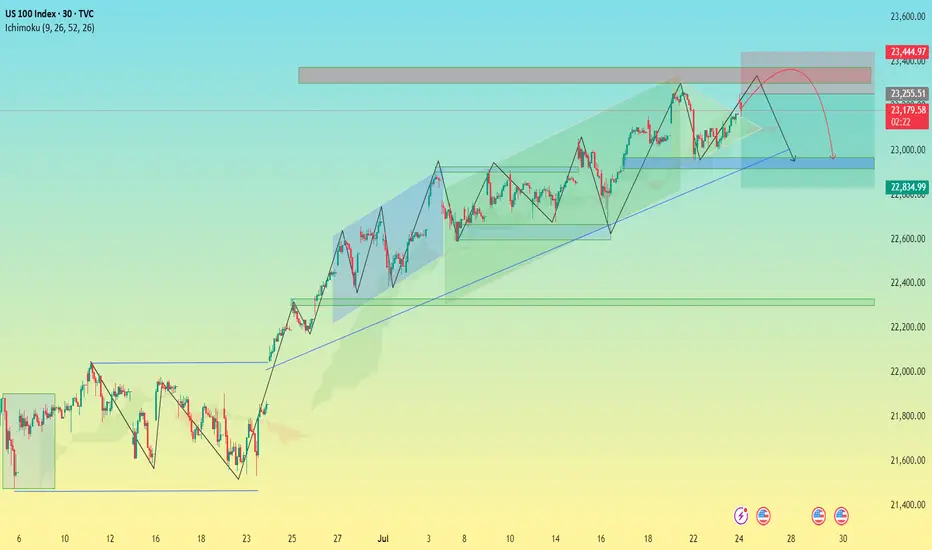
US100 Index – Potential Bearish Reversal in Key Resistance Zone🧠 US100 Index – Potential Bearish Reversal in Key Resistance Zone
Timeframe: 30-Minute | Chart Published: July 24, 2025
---
🔍 Overview
The US100 (NASDAQ) has been trading in a well-structured ascending channel, forming higher highs and higher lows. However, recent price action suggests that the index is testing a critical supply zone near 23,400, with signs of weakening bullish momentum. This may signal a potential corrective phase or bearish reversal.
---
📈 Technical Analysis Breakdown
🔵 Trend Structure:
Price is respecting a clear ascending trendline (blue), connecting multiple higher lows.
Multiple bullish flag/channel formations have been completed within the uptrend, showing healthy momentum until the current point.
🟥 Resistance Zone:
Strong supply zone marked between 23,250 – 23,450.
Price action shows stalling candles and rejection wicks within this zone, indicating buyer exhaustion.
⚠ Bearish Patterns:
The red path projection suggests a head and shoulders-like structure forming at the top of the channel.
This, along with divergence in wave strength and shrinking momentum, supports a potential reversal.
🔵 Key Support:
First support lies around 23,000 — aligning with the ascending trendline and previous consolidation.
If broken, next demand zone is around 22,835 – 22,900, where historical consolidation took place.
---
🔁 Projected Scenario (as per visual path)
1. Price may attempt one last push into the 23,400–23,450 zone (possible false breakout).
2. Rejection from this level could trigger a fall toward the ascending trendline support.
3. A confirmed break of the trendline can lead to a larger correction toward the 22,800 zone.
---
🧠 Unique Insight
This chart combines multi-timeframe structure recognition with a real-time reversal formation inside a long-standing bullish trend. The analysis doesn’t just rely on textbook patterns—it recognizes real-time price behavior shifts, which makes it valuable for proactive traders.
---
📌 Conclusion
While the trend remains bullish overall, caution is warranted as the US100 approaches a historically significant resistance zone. The setup offers a compelling risk-reward short opportunity for aggressive traders, especially if the price confirms a break below trendline support.
---
🔧 Next Steps for Viewers
> “Watch for a clean rejection candle or lower high at resistance before entering short. If trendline breaks cleanly, 22,835 could be the next target zone.”
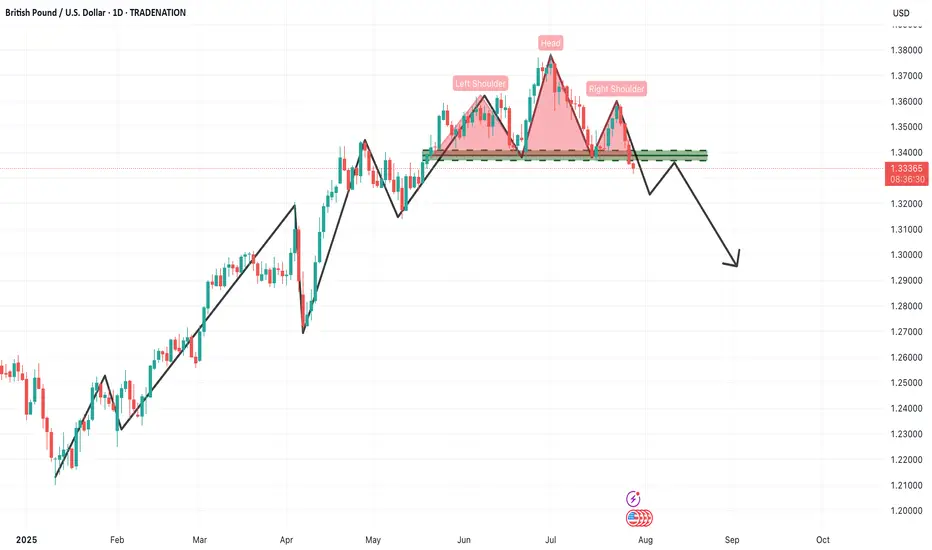
GBPUSD – Daily Timeframe Analysis: Head & Shoulders PatternThe GBPUSD daily chart is currently presenting a textbook Head & Shoulders reversal pattern, a powerful bearish signal that often marks the end of an uptrend and the beginning of a new downward cycle. This setup demands attention from swing and positional traders alike, especially considering the size and clarity of the structure.
🔍 Pattern Breakdown
Left Shoulder: Formed in late May, establishing a significant high before a corrective move.
Head: A higher peak was made in early June, which now stands as the pattern's highest point.
Right Shoulder: A lower high formed in mid-July, indicating weakening bullish momentum.
Neckline: The crucial horizontal support zone around 1.3330–1.3340 was tested multiple times and has now been decisively broken, triggering a confirmed bearish setup.
📊 Technical Significance
This Head & Shoulders pattern becomes especially meaningful due to:
Multiple rejections at the neckline, confirming its strength as support-turned-resistance.
Bearish volume expansion on the breakdown, adding weight to the selling pressure.
Formation on a daily timeframe, suggesting a long-term trend reversal rather than a short-term pullback.
📌 Trading Strategy for Traders
✅ Sell Setup (Short Position)
Entry: Around the neckline zone on retest (1.3320–1.3340)
Stop Loss: Above the right shoulder (~1.3550)
Targets:
🎯 Target 1: 1.3100 (psychological and horizontal support)
🎯 Target 2: 1.2900 (measured move from head to neckline)
🎯 Target 3: 1.2650–1.2600 (extended downside zone based on structure)
⚠️ Risk Management Tips:
Don’t chase the breakdown — wait for a pullback/retest of the neckline to get a better risk/reward entry.
Ensure position sizing is appropriate based on the stop loss distance.
If price reclaims the neckline with strong bullish momentum and closes above 1.3350, exit short and reevaluate.
🧠 What Traders Should Keep in Mind
Macro Fundamentals: Watch upcoming economic events like BoE rate decisions, US NFP, and inflation data, which can cause volatility and impact the technical scenario.
Dollar Index (DXY) trend should also be monitored closely. If DXY rallies, GBPUSD breakdown can accelerate.
Trendline Confirmation: Align this with any break of rising trendlines drawn from previous lows.
📌 Final Thought
This pattern marks a crucial turning point in GBPUSD. The momentum has clearly shifted from buyers to sellers, and the breakdown opens up significant downside room. As a swing or position trader, this is a high-probability setup with a clear invalidation point (above the right shoulder) and a favorable risk-reward ratio.
📉 Patience and precision are key here. Let price come to you at the neckline, confirm rejection, and then take the trade with confidence.
=================================================================
Disclosure: I am part of Trade Nation's Influencer program and receive a monthly fee for using their TradingView charts in my analysis.
=================================================================
USDJPY Forming Bullish Reversal | MMC Analysis + Target🧠 Chart Overview (2H Timeframe)
🔸 1. Head and Shoulders Inverse Pattern – MMC Bullish Blueprint
The chart beautifully shows an Inverse Head & Shoulders pattern, one of the most powerful reversal signals under MMC logic:
Left Shoulder: Formed after the initial drop and quick recovery.
Head : Deep liquidity grab and reversal from the lowest point (demand zone).
Right Shoulder: Higher low structure, indicating reduced selling pressure and shift in momentum.
This pattern is forming around a previous liquidity zone, which makes it more valid and aligned with smart money behavior.
🔸 2. Retesting Zone – Critical MMC Demand Area
Price is now retesting a highlighted demand zone, which acted as the springboard for the previous bullish move:
Bullish Pattern marked aligns with MMC’s concept of “Return to Origin”.
This zone also sits just above the right shoulder, confirming that buyers are defending aggressively.
If this level holds, we may see a strong continuation move to the upside.
🔸 3. Previous Reversal Zone (Supply) – Next Target Area
Marked in light green, this area is the next critical resistance:
Acts as liquidity target for institutions if price rallies.
Historically acted as a major reversal point.
Price is likely to show reactions or profit-taking behavior here.
Once broken and retested, it becomes a new support for further upside continuation (as marked on the chart).
🔸 4. Dual Scenarios – Bullish vs Bearish Pathways
Your chart correctly outlines two strategic possibilities:
✅ Bullish Scenario:
Price respects demand zone.
Breaks above previous reversal zone (149.000+).
Bullish continuation toward 149.800–150.500 range.
MMC tip: “If it goes bullish, use previous demand or double it” = Add confluence or stack demand zones for scale-in entries.
❌ Bearish Scenario:
If price breaks below retesting zone, bullish invalidation triggers.
Look to the previous all supply zone (Zone Pattern Must) for next reaction.
This scenario reflects smart money rejection of upside continuation.
🗂️ MMC Structural Elements Identified:
Zone/Pattern Role in Analysis
Inverse H&S Trend reversal signal
Retesting Zone Demand/entry area
Previous Reversal Zone First key resistance / next liquidity pool
Supply Zone Below Target in case of downside breakdown
MMC Logic Follow price structure, fakeouts, demand/supply traps
📈 Summary Outlook:
USDJPY is showing a technical bullish structure backed by MMC-based price psychology. The current pullback into a demand zone gives traders an excellent R:R opportunity for long positions, targeting higher zones upon breakout confirmation.
🟩 If bullish, breakout >149.000 will likely lead toward 150.000+
🟥 If bearish, breakdown <147.600 opens doors to deeper drop toward 146.000 zone (watch for reversal pattern).
🔑 Key Levels to Watch:
Type Level Range Notes
Support 147.600–147.800 Current retesting demand
Resistance 148.800–149.300 Previous Reversal Zone (Profit booking area)
Higher Resistance 150.500+ Final upside objective
Breakdown Zone <147.500 Flip to bearish scenario

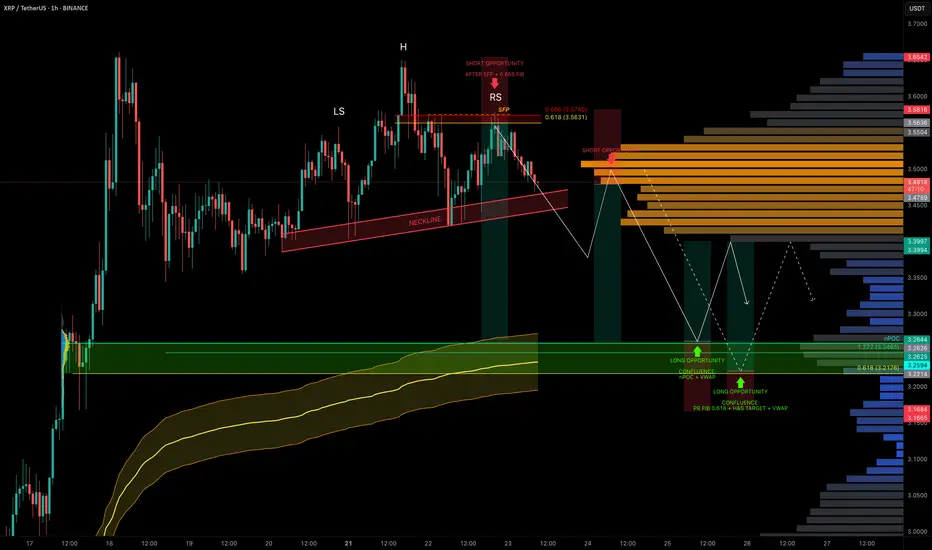
XRP Coiled in Range — Liquidity Below, Trade Setups AheadXRP has been stuck in a trading range around $3.50 for the past 5 days, offering multiple trade opportunities within the chop.
A notable short was triggered after a swing failure pattern (SFP) at the 0.666 fib retracement level near $3.563.
Now, with liquidity building to the downside, we’re watching closely for the next high-conviction setups.
🧩 Current Structure & Short Setup
🔴 Short Opportunity (Triggered):
SFP + 0.666 fib retracement at $3.563 led to rejection.
Market now shows a head & shoulders pattern forming.
Target: $3.2176 (0.618 fib retracement).
Trigger: Watch for a neckline break + retest for short confirmation.
Stop-loss: Above the right shoulder.
🟢 Long Setup:
Watching for a high-probability long around:
$3.26 → nPOC + 1.272 TBFE
$3.23 → anchored VWAP bands
This zone offers strong confluence and could act as the next launchpad.
Long Trade Plan:
Entry Zone: potential entries between $3.26–$3.22, price action needed for confirmation
Stop-loss: Below swing low at $3.1675
Target (TP): ~$3.40
✍️ Plan: Set alerts near the lows and react to price action at the zone — don’t front-run, let structure confirm.
💡 Pro Tip: Trade the Confluence, Not the Emotion
High-probability trades come from confluence, not guessing.
This setup combines nPOC, TBFE, VWAP, fib levels, and classical market structure (H&S) to map precise zones for both longs and shorts.
Let price come to you and wait for confirmation — especially in a rangebound environment where liquidity hunts are frequent.
Final Thoughts
We’re still rangebound, but liquidity is building below.
Keep an eye on the $3.26–$3.22 support zone for long entries and the H&S neckline for short breakdown confirmation.
_________________________________
💬 If you found this helpful, drop a like and comment!
Want breakdowns of other charts? Leave your requests below.
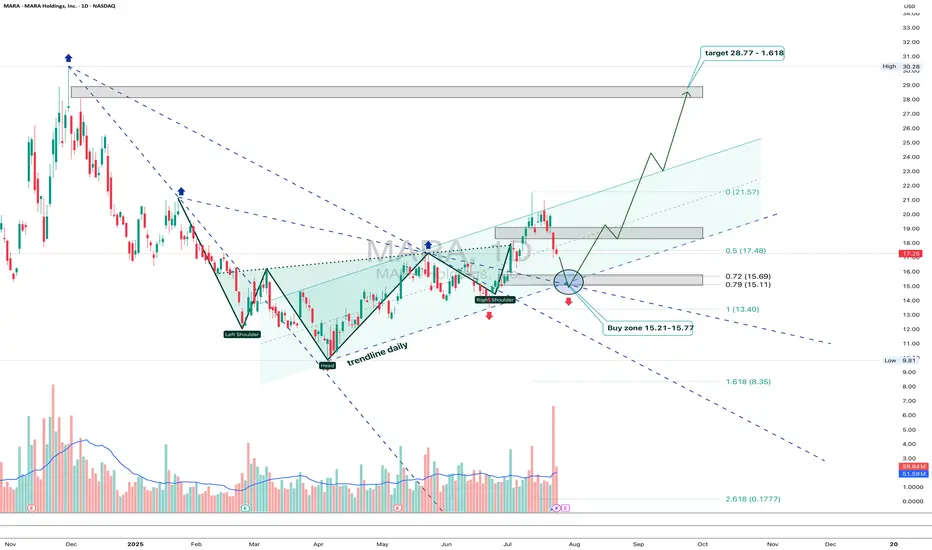
MARA: shoulders done, now walk toward the targetOn the daily chart, MARA completed a textbook inverse Head & Shoulders reversal with a clear breakout above the descending trendline. A corrective pullback followed, and the price is now heading into the key buy zone at 15.21–15.77 - aligning with the 0.72 and 0.79 Fibonacci retracements, and the upper boundary of the broken channel. This is the area to watch for a potential continuation of the bullish impulse.
Volume on the breakout was above average, confirming strong buyer interest. The EMAs are trending below the price, supporting the upward structure. The first target is located at 21.57 (previous resistance), with a potential extension to 28.77 (Fibonacci 1.618).
Fundamentally, MARA remains highly correlated with BTC and crypto sentiment. As interest returns to crypto-related assets due to ETF flows and possible Fed easing, mining stocks like MARA gain attention. Recent reports also show improved production efficiency and lowered costs - a tailwind for bulls.
Tactically, the best setup would be a confirmed reaction from the buy zone — whether a strong candlestick formation, volume surge, or reclaim of a key level. If that happens, aiming for 21.57 and 28.77 becomes a solid plan.
The pattern played out - now it's time for the market to walk the talk.
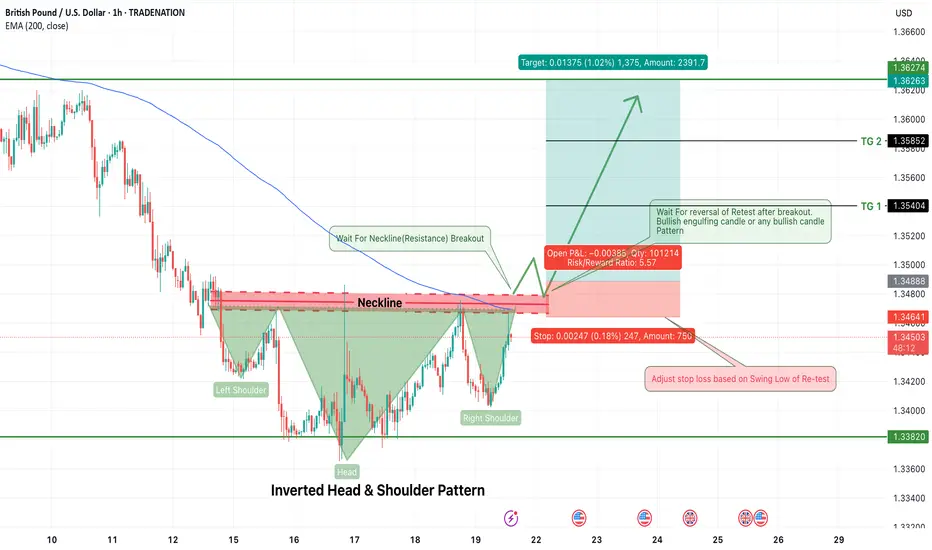
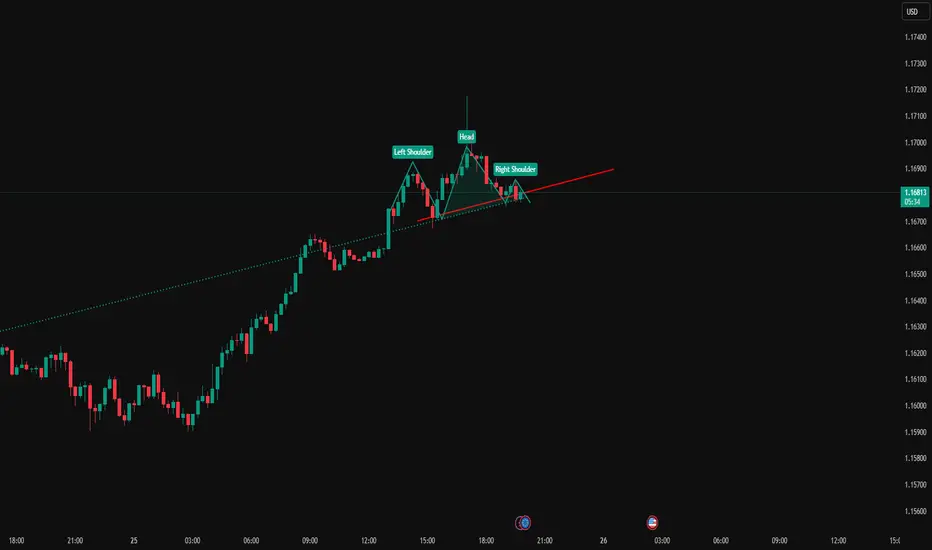
GBPUSD Long Opportunity – Inverted Head & Shoulders PatternGBPUSD is currently forming a classic Inverted Head & Shoulders pattern on the 1-hour timeframe — a powerful trend reversal signal that typically marks the shift from bearish to bullish momentum. The structure is clear, with a defined left shoulder, head, and right shoulder, and price now approaching the neckline resistance around 1.3488–1.3495.
Traders should now shift focus to two key confirmation events:
A neckline breakout
A successful retest of the neckline with a bullish reversal candle (e.g., bullish engulfing)
🔍 Trade Plan (Long Setup)
Entry: After 1H candle closes above neckline (~1.3490), wait for a retest of the breakout
Enter long on bullish confirmation candle during the retest
Stop Loss: Below the swing low of the retest (around 1.3440–1.3450)
Risk/Reward Ratio: ~5.5:1
🎯 Target Zones:
TG1: 1.3540 (Minor Resistance)
TG2: 1.3585 (Next structure zone)
Final Target: 1.3627+ (Full measured move from pattern)
📌 Confirmation Tips:
Look for bullish candlestick confirmation on neckline retest (bullish engulfing, hammer, or strong rejection wick)
Avoid entering inside the pattern – confirmation is key to reduce false breakouts
⚠️ Note to Traders:
This setup aligns with a possible shift in sentiment for GBPUSD. The pattern is developing against the larger downtrend, so discipline and stop-loss protection are crucial. A successful breakout and retest would suggest a potential short-term bullish reversal with clean upside targets.
🧠 Stay patient. Let the breakout confirm. Execute with structure.
=================================================================
Disclosure: I am part of Trade Nation's Influencer program and receive a monthly fee for using their TradingView charts in my analysis.
=================================================================
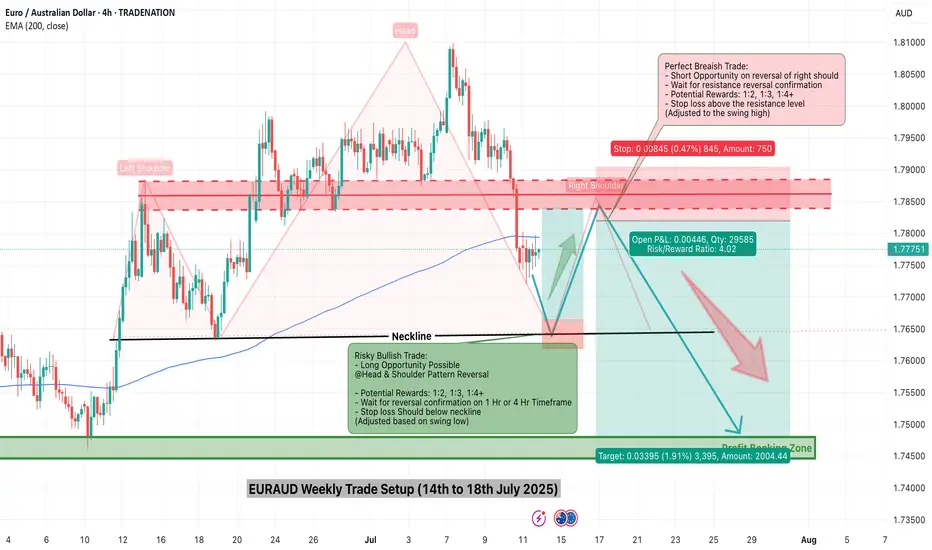
EURAUD Weekly Trade Setup(14 to 18th July 2025) - Head&ShoulderThis week, EURAUD (Euro/Australian Dollar) has entered a critical price zone, providing a textbook technical opportunity for traders. A clear Head & Shoulders pattern has formed on the 4-hour chart, pointing toward a potential trend reversal from bullish to bearish.
Let’s explore how to trade this intelligently from both bullish and bearish perspectives.
1. Bearish Setup – Head & Shoulders Pattern Breakdown
This is the primary trade idea for the week.
✅ Trade Logic:
Price has completed a classic Left Shoulder → Head → Right Shoulder formation.
The neckline (support) will be tested.
The current price is will pulling back to retest the right shoulder resistance zone, offering an ideal short opportunity.
🔻 Entry Plan:
Wait for bearish reversal confirmation (candlestick rejection or bearish engulfing) on the 1H or 4H timeframe.
Enter short once confirmation appears near 1.7850–1.7900.
📉 Stop Loss:
Place SL above the right shoulder high, adjusting for volatility and swing high (around 1.7950).
🎯 Targets:
Target zone: 1.7450–1.7500 (profit booking zone marked on the chart)
Potential Risk/Reward Ratio: 1:2, 1:3, or even 1:4+
2. Alternative Bullish Setup – Reversal at Neckline (High Risk)
This setup is for experienced or aggressive traders who spot early reversals.
✅ Trade Logic:
Price may bounce from the neckline and 200 EMA support area.
If this happens, a temporary bullish reversal may push price back toward the right shoulder zone.
🔺 Entry Plan:
Wait for bullish confirmation (reversal candle) near the neckline and EMA support (around 1.7700).
🚨 Stop Loss:
SL must be below the neckline swing low (around 1.7650).
🎯 Targets:
Resistance zone (right shoulder): 1.7850–1.7900
R:R setups of 1:2 or 1:3 possible
⚠️ This is considered a counter-trend trade and should be traded with caution.
3. Technical Confluence and Indicators
Pattern: Head & Shoulders (bearish reversal)
EMA 200: Price reacting around the long-term trend line
Support/Resistance: Cleanly defined horizontal zones
Reversal zones: Highlighted in red (supply) and green (demand)
4. Final Thoughts
This week’s EURAUD setup is a strong example of structure-based trading. With a well-formed head and shoulders pattern and a clean neckline break, the market signals a shift in momentum.
Safe Approach: Trade the short side after resistance rejection.
Risky Approach: Try a long on neckline bounce with tight SL.
Always confirm with your system and maintain strict risk management. Trade what you see, not what you feel.
Ready to trade? Save this setup, monitor price action, and execute only with confirmation.
=================================================================
Disclosure: I am part of Trade Nation's Influencer program and receive a monthly fee for using their TradingView charts in my analysis.
=================================================================
Clear breakout Clear trendline breakout and good to go long. Check volume and do your own analysis too. This is only for educational purposes.
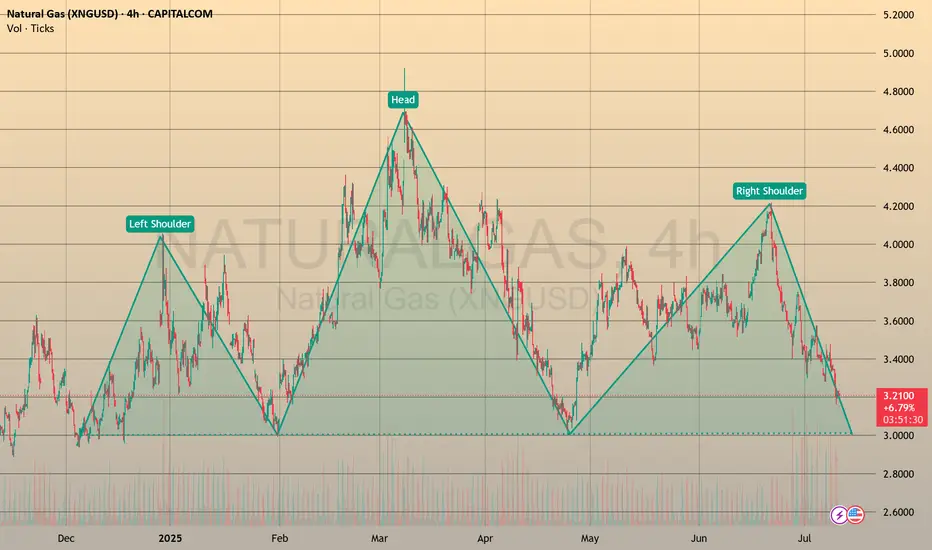
NATURAL GAS formed Head and Shoulders patternCAPITALCOM:NATURALGAS
🔍 From a longer-term perspective, I noticed that a Head and Shoulders pattern 🪖🩻 is about to form. This pattern has been forming since December 2024 and in the long term 🕰️ means no good for those who play long here 📉.
🙋♂️ Personally, I will stay aside for now and observe 👀. The asset may head towards the 3.0000 support level 🪙, where I expect a potential rebound 🔄, possibly even a retest of the trendline from below ↩️.
⏳ In the long term, the asset may even move towards the 2.0000 support level 🚨, but I will need more observation and data to be sure 🧪.
🕊️ Time will show. Thank you for the attention! 🙏
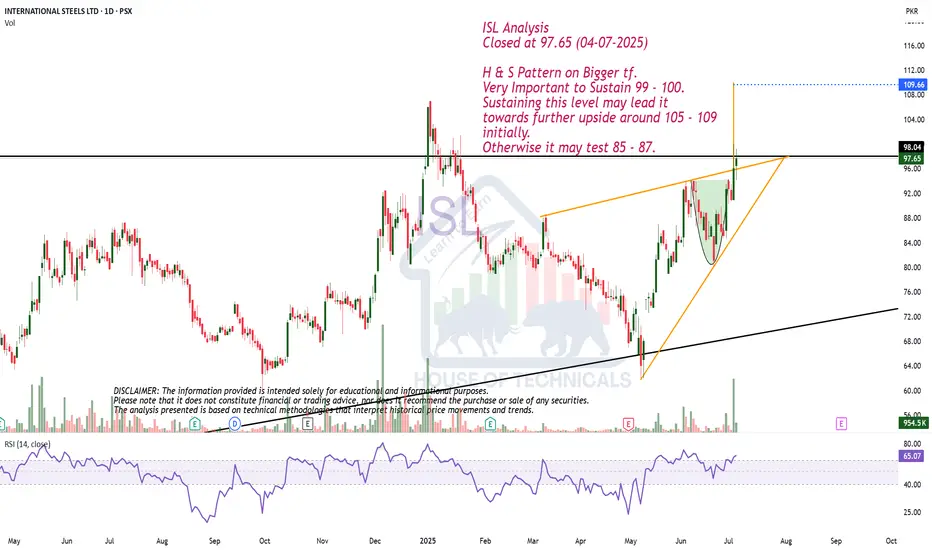
H & S Pattern on Bigger tf.ISL Analysis
Closed at 97.65 (04-07-2025)
H & S Pattern on Bigger tf.
Very Important to Sustain 99 - 100.
Sustaining this level may lead it
towards further upside around 105 - 109
initially.
Otherwise it may test 85 - 87.
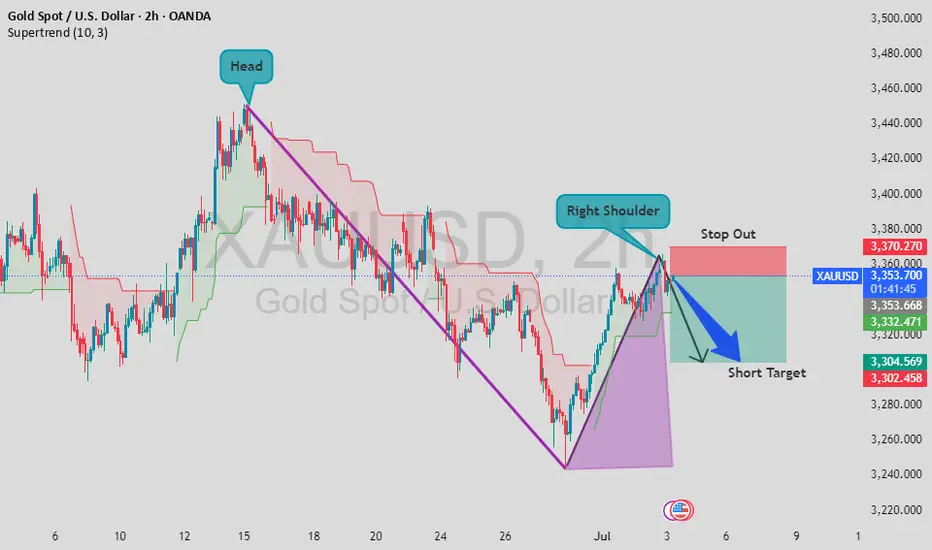
XAU/USD Potential Head & Shoulders Pattern FormingXAU/USD - Potential Head & Shoulders Pattern Forming 🔍
A possible Head and Shoulders pattern is taking shape on the 2H chart. With the right shoulder now forming and price nearing resistance, this setup could indicate a short opportunity.
🎯 Short Target: 3,304
🛑 Stop Out: 3,370
This setup offers a clean risk-to-reward ratio. Let’s see how price reacts in the coming hours!
💬 Drop your thoughts in the comments – do you agree with this setup? Let's support each other with ideas!
👍 Don’t forget to like and share if you find this helpful – your support means a lot!
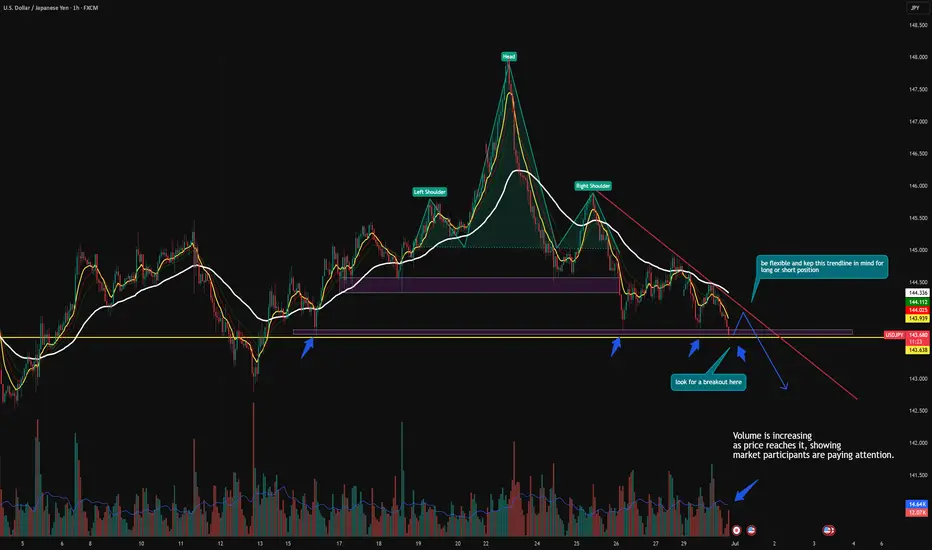
USD/JPY at a key support level tested multiple times🔻 USDJPY Sitting at Critical Support – Decision Point Ahead
USDJPY is currently hovering around the 143.60–143.65 zone — a major support level that has held multiple times in the past.
🔍 Price just completed a clean Head & Shoulders breakdown, and this zone marks the neckline retest area. We're now at a make-or-break point:
Break Below 143.60: Confirms bearish continuation, opens downside toward 143.00 → 142.20
Hold Above 143.60: Could lead to a short squeeze back to 144.20–144.50 zone
📊 Volume is rising as we test this key level — suggesting that big players are stepping in.
Trend remains bearish overall with price trading below the EMAs and rejecting trendline resistance.
⚠️ This is not the place to guess — wait for confirmation. A strong candle close below or a fakeout rejection will show the path.
Trade smart. Wait for the market to speak. No bias, just price action. 🧠
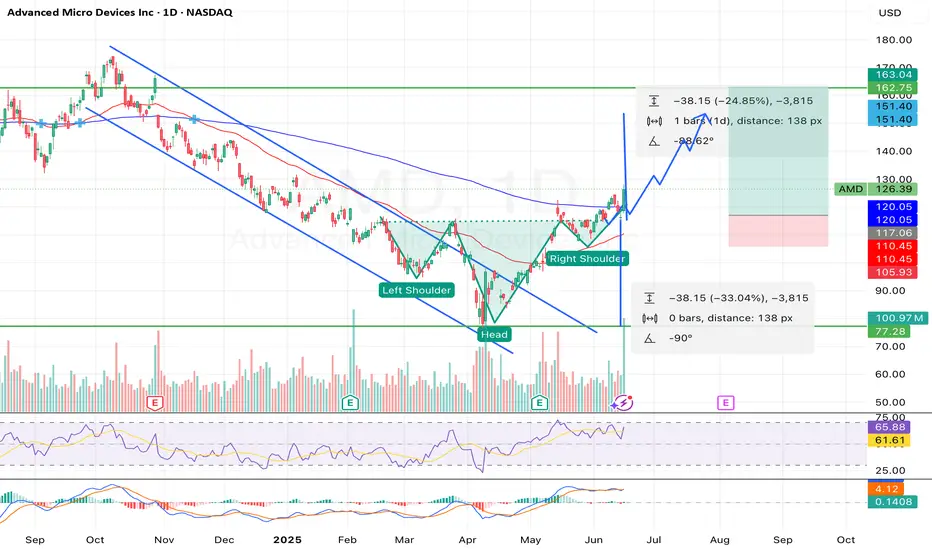
Breakout Alert: AMD Head & Shoulders Points to $160+Overview
Name: Advanced Micro Devices, Inc.
Ticker Symbol: AMD
Exchange: NASDAQ
Founded: 1969
Headquarters: Santa Clara, California, USA
CEO: Lisa Su (as of 2025)Sector: Technology / Semiconductors
About
AMD is a leading semiconductor company known for its high-performance computing and graphics solutions. It competes with Intel and NVIDIA in the CPU, GPU, and data center markets. Its product line includes Ryzen (desktop/laptop CPUs), EPYC (server CPUs), and Radeon (GPUs), with strong expansion in AI and custom silicon for next-gen applications.
Fundamentals
Earnings: AMD reported strong Q1 2025 earnings with a beat on both revenue and EPS, supported by explosive demand in the AI and data center segments.Revenue: $6.52B, up 21% YoY
Outlook: The company raised guidance for the second half of 2025 as it expects to benefit from the AI chip boom and new product rollouts.
Technicals (4H Chart)
Inverted Head and Shoulders pattern confirmed with neckline breakout around ~$117
Breakout from Falling Channel aligning with bullish reversal structure
Price surged past resistance with strong volume, currently at $126.39 (+9.71%)
RSI at 65.88, approaching overbought but not signaling weakness
MACD bullish crossover, confirming momentum
Short-term target range: $145–$150, with extended projection up to $162.75
📌 Support Levels: $117, $111.50📈 Target Price (TP): $162.75 (based on pattern breakout height projection)
💡 My Take
AMD just pulled off a textbook bullish reversal — inverted head and shoulders breakout combined with a falling channel exit. With strong macro trends in AI hardware and data center expansion, this move feels well-supported fundamentally and technically.
The clean neckline breakout and explosive candle suggest continuation. I am expecting a potential consolidation around $130–$135ish before next leg to $150+. If momentum holds, $162+ is possible before August.
💼 Position
Type: AMD 145 Call
Expiry: July 03, 2025
Quantity: 15
Average Cost Basis: $.038
Date Purchased: June 12, 2025
Last Price: $0.47
Total % Gain/Loss: +23.4%
I entered after the neckline break and riding the wave. AMD’s setup is too clean to ignore — high conviction play.
EURUSD Head And ShouldersEURUSD has created a normal head and shoulders pattern while reaching a HTF resistance on the weekly/daily. I expect this pattern to be a catalyst to a bearish movement.
How to Spot Head & Shoulders Patterns in TradingViewDiscover how to identify and validate Head & Shoulders patterns using TradingView's built-in pattern recognition tools in this detailed tutorial from Optimus Futures. Chart patterns are essential tools for many futures traders, and the Head & Shoulders formation is among the most recognized reversal patterns in technical analysis.
What You'll Learn:
• Understanding the Head & Shoulders pattern: a key reversal formation in technical analysis
• How to access and use TradingView's pattern drawing tools and objects
• Step-by-step process for identifying potential Head & Shoulders formations on any timeframe
• Techniques for spotting the "head" by locating the highest high or lowest low pivot points
• How to identify matching "shoulders" on either side of the head formation
• Validating your pattern identification using TradingView's drawing tools
• Real-world example using crude oil futures on an hourly chart from October 2024
• Key characteristics that distinguish bearish Head & Shoulders reversal patterns
• Best practices for using pivot points and swing analysis in pattern recognition
This tutorial may benefit futures traders, swing traders, and technical analysts who want to improve their chart pattern recognition skills in TradingView. The techniques demonstrated could help you identify potential reversal opportunities and make more informed trading decisions when these classic formations appear on your charts.
Keywords: Head and Shoulders pattern, TradingView tutorial, chart patterns, technical analysis, reversal patterns, futures trading, pivot points, swing analysis, pattern recognition, trading education
Visit Optimus Futures to learn more about trading futures with TradingView:
optimusfutures.com
Disclaimer:
There is a substantial risk of loss in futures trading. Past performance is not indicative of future results. Please trade only with risk capital. We are not responsible for any third-party links, comments, or content shared on TradingView. Any opinions, links, or messages posted by users on TradingView do not represent our views or recommendations. Please exercise your own judgment and due diligence when engaging with any external content or user commentary.
This video represents the opinion of Optimus Futures and is intended for educational purposes only. Chart interpretations are presented solely to illustrate objective technical concepts and should not be viewed as predictive of future market behavior. In our opinion, charts are analytical tools—not forecasting instruments. Market conditions are constantly evolving, and all trading decisions should be made independently, with careful consideration of individual risk tolerance and financial objectives.

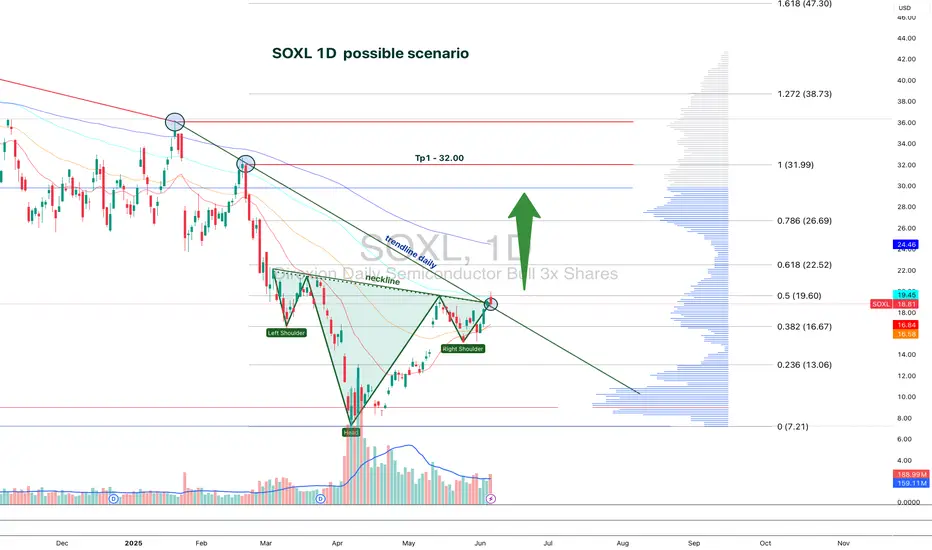
SOXL 1D — With a base like this, the ride’s worth itOn the daily chart of SOXL, since early March, a textbook inverse head and shoulders pattern has formed and is now in its activation phase. The left shoulder sits at $16.67, the head at $7.21, and the right shoulder at $15.11. The symmetry is classic, with volume stabilization and a narrowing range — all the elements are in place.
The key moment was the breakout through the descending daily trendline around $19.00. Price didn’t just pierce the level — it held above it, signaling a phase shift. There was an attempt to break through the 0.5 Fibonacci level at $19.60, which led to a pullback — not on heavy selling, but on decreasing volume. This wasn’t a rejection, it was a pause.
This pullback serves as a retest of the breakout zone and the 20-day moving average. The overall structure remains bullish: price stays above all key EMAs and MAs, RSI climbs past 60, and the candlestick structure is stable. Volume rises during up moves and fades during pullbacks — classic signs of reaccumulation.
The measured target from the pattern is $32.00, calculated from the head-to-neckline height projected from the breakout point. As long as price holds above $18.40, the setup remains intact. A break above $19.60 with confirmation would open the door to acceleration.
This isn’t a momentum play — it’s a setup months in the making. The structure is there, the confirmation is there, and most importantly — the price behavior makes sense. With a base like this, the ride ahead looks worth taking.
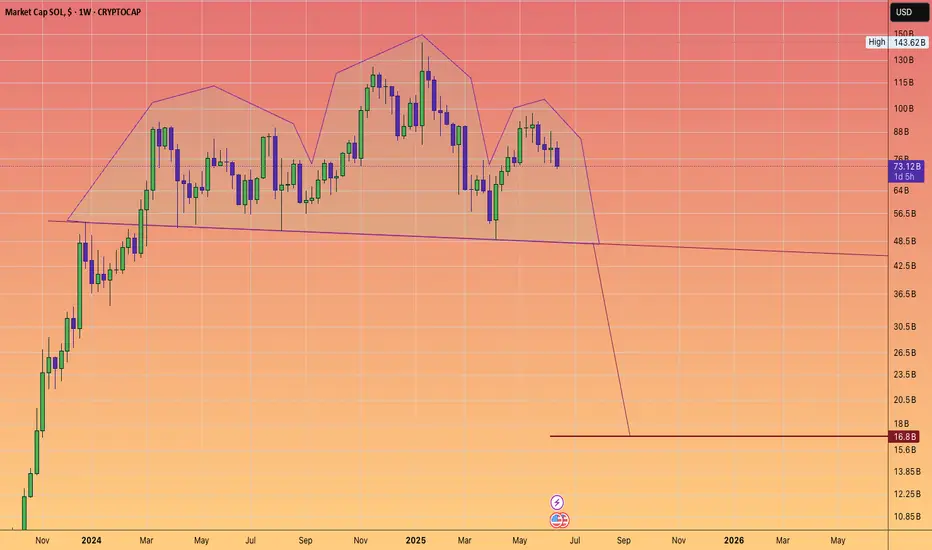
SOLANA MARKETCAP LOOKS COOKEDIs that a Head and Shoulder's top?
Is #crypto about to endure a Iron dome penetration event?
Shoulders to the Sky: Amazon’s Breakout Journey BeginsOverview
Name: Amazon.com, Inc
Ticker Symbol: AMZN
Exchange: NASDAQ
Founded: 1994
Headquarters: Seattle, Washington, USA
CEO: Andy Jassy (as of 2025)
Sector: Consumer Discretionary / E-commerce & Cloud Computing
About
Amazon is a global e-commerce and cloud services powerhouse. It dominates online retail while also operating AWS (Amazon Web Services), one of the world’s leading cloud computing platforms. Other segments include advertising, logistics, streaming, AI hardware (Alexa), and physical retail.
Fundamentals
Earnings: Amazon has consistently beaten revenue expectations with strong growth in AWS and advertising segments.Revenue: Q1 2025 revenue topped $154.8B, up 13% YoY, with solid margins.Outlook: Management has raised guidance for Q2 citing AI integration in AWS and retail efficiency gains.
Technicals
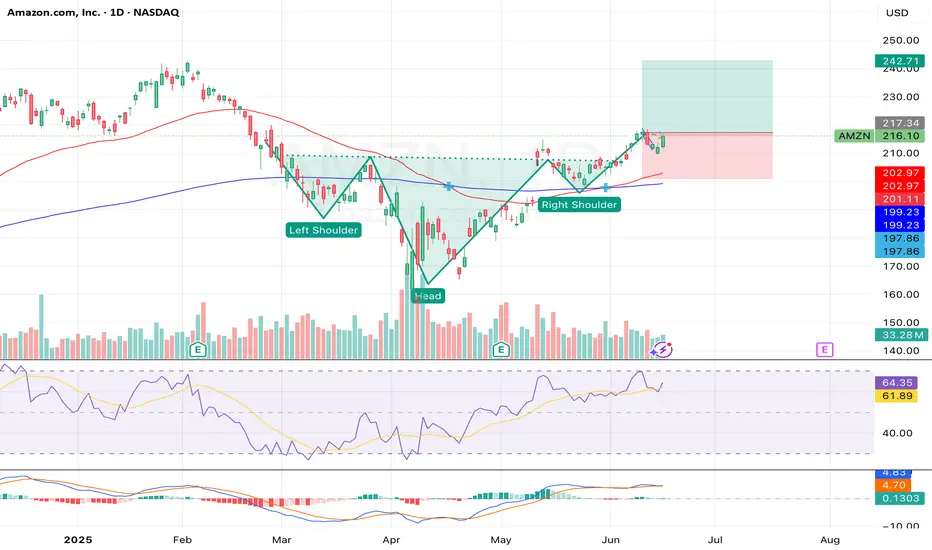
Inverted Head and Shoulders Pattern confirmed on the daily chart — a strong bullish reversal signal.
Price has broken above the neckline (~$213–$215) with volume confirmation.
Golden Cross forming on short-term MAs — bullish signal.
RSI is around 64, suggesting momentum remains but is nearing overbought.
MACD is bullish with widening divergence — supports potential continuation.
📌 Support Zones: $202, $199
📈 Resistance / Target Zones: $217 (short-term), $235 (TP), $242 (extension)
💡 My Take
AMZN is showing bullish continuation out of a textbook inverted head and shoulders — typically a strong reversal setup after a downtrend. We’ve seen the neckline break with follow-through, and volume patterns support the move.
While the RSI shows slight overbought conditions, this could lead to a short consolidation before another leg up toward $235–$242. With macro tailwinds from cloud and advertising sectors, AMZN is positioned well for a strong Q3 rally.
Position
Type: AMZN 235 Call
Expiry: July 11, 2025
Quantity: 7
Average Cost Basis: $1.00
Last Price: $0.69
Purchase Date: June 12, 2025
Total % Gain/Loss: –30%
Despite current drawdown, I remain optimistic about AMZN's momentum. The technical setup is strong, and short-term weakness is likely just healthy consolidation. I'm holding through July with my eyes on the $235 target.
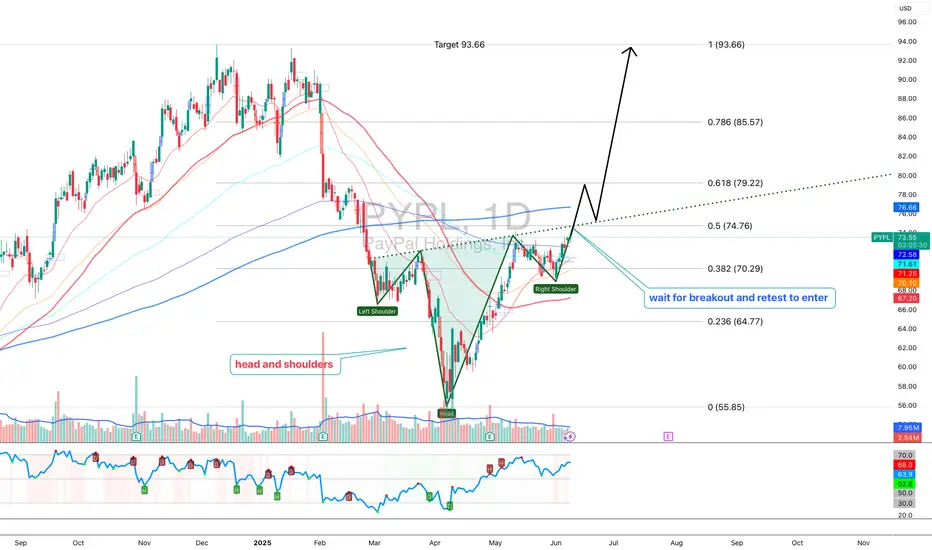
PayPal: Rebound or Rerun?PayPal in 2025: A breakout with backbone or just another spineless fintech?
PayPal is still in the rehabilitation ward after its fall from grace in 2021. Management drama, growth slowdown — the full fintech fatigue package. But something has shifted behind the scenes. A new CEO is cutting costs, AI integration is being whispered about, and earnings have started to surprise again. Wall Street pretends not to notice — but volume tells a different story.
Technically, we’re looking at a well-formed inverse head and shoulders. The neckline stretches from $72.00 to $74.76, aligning with the 0.5 Fibonacci level. A confirmed breakout above this zone opens the path to a clear target at $93.66 — the 1.0 Fibonacci extension. Multiple EMA clusters and strong pattern symmetry reinforce the setup. But no fairy tales here: the real entry comes after a retest. Without confirmation, it’s just another pretty formation for chart enthusiasts.
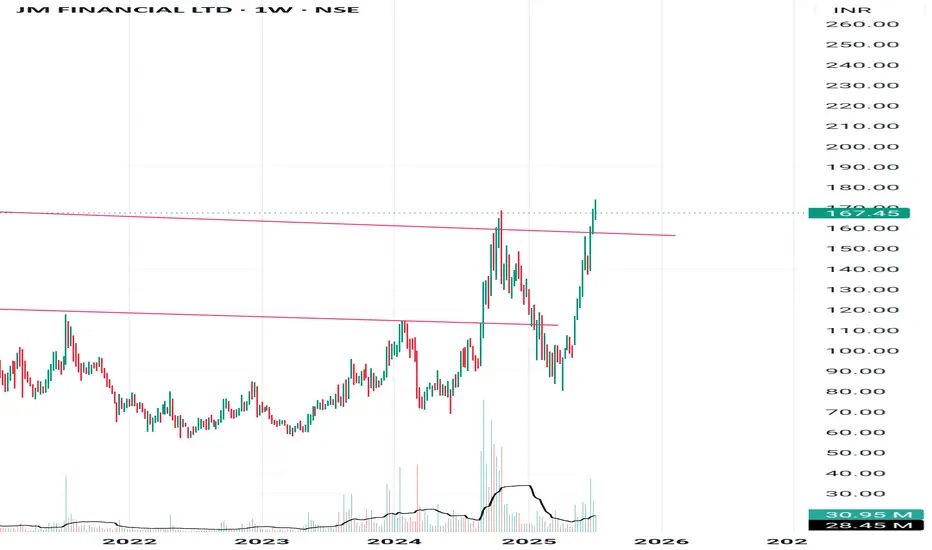
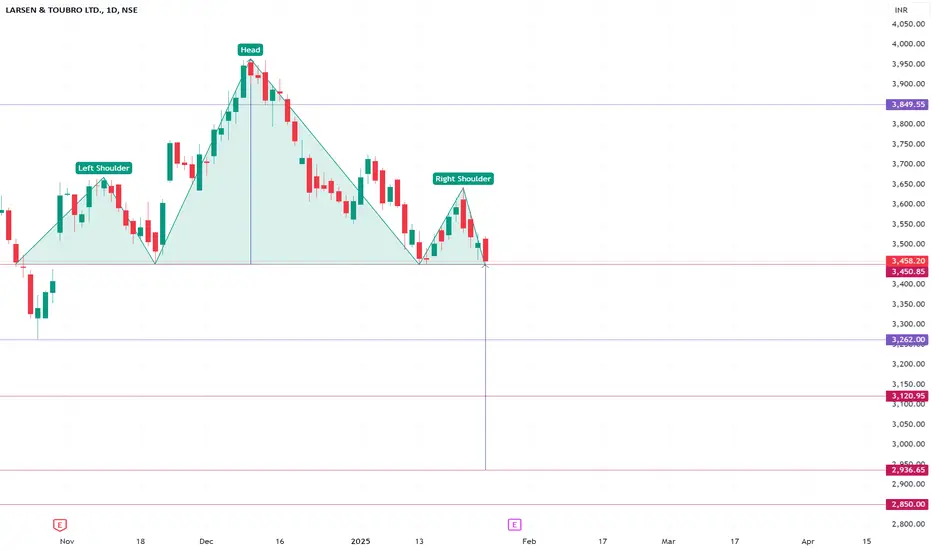
LT possible to touch 2850 for 15 to 17% correctionLT has shown Head & Shoulder pattern formation, it there is a breakdown then it has possibility to have following targets;
3260 / 3100 / 2930 / 2850
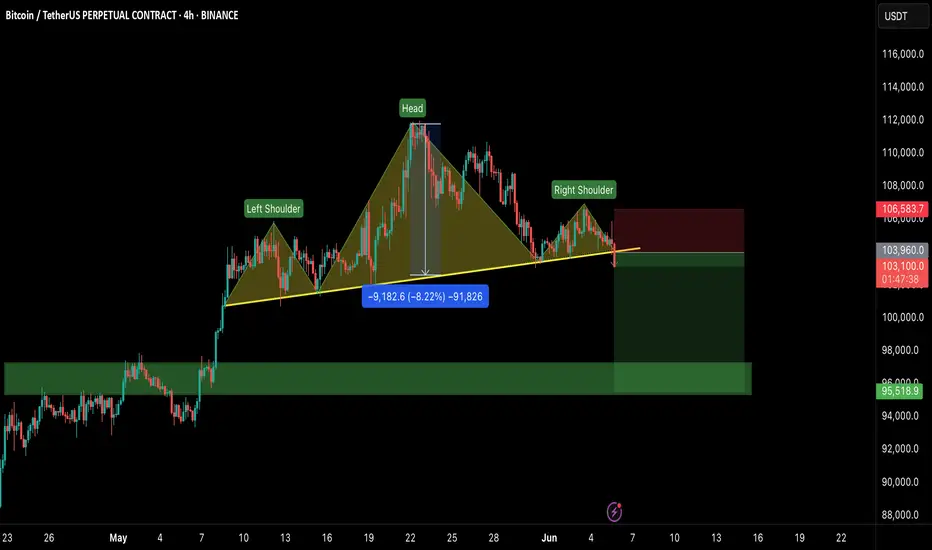
#BTC/USDT: Head & Shoulders Breakdown – $95K Incoming?Hey Traders!
If you’re finding value in this analysis, smash that 👍 and hit Follow for high-accuracy trade setups that actually deliver!
Bitcoin just broke below the neckline of a clear Head & Shoulders pattern on the 4H timeframe — a classic bearish signal.
As long as price stays below the neckline and fails to reclaim the $106.5K zone, we could be heading for a deeper correction toward the $95K–$98K support range.
Key Levels:
Breakdown Zone: ~$103.9K
Downside Target: $95K–$98K
Invalidation: Reclaim above $106.5K
Market is showing consistent weakness — small bounces are quickly sold off.
Let the pattern play out and manage your risk accordingly.
What do you think — short-term dip or deeper breakdown loading?
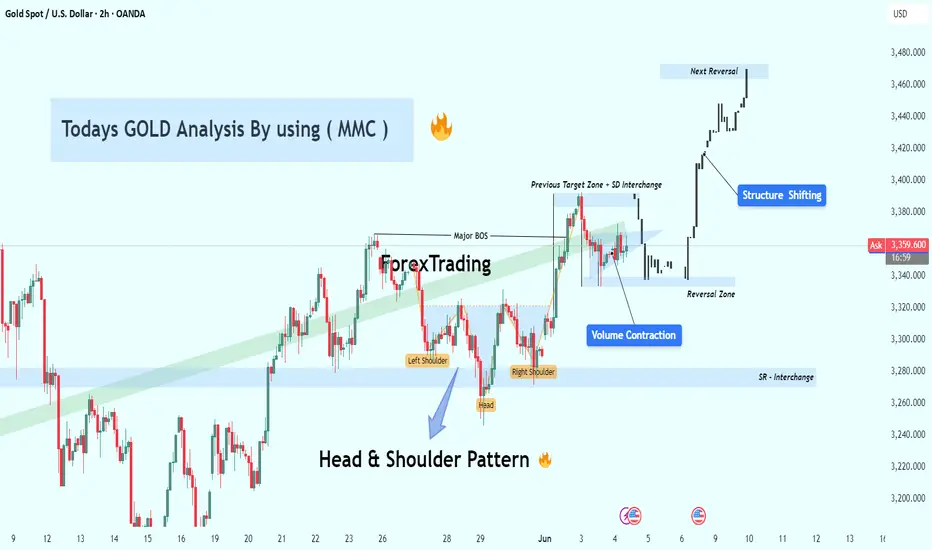
GOLD (XAU/USD) Analysis – Head & Shoulders & Target📌 Overview:
Today’s GOLD market presented an excellent educational setup using the MMC (Market Maker Cycle) methodology. We identified a Head & Shoulder reversal pattern, volume contraction at a key zone, a Major Break of Structure (BOS), and finally, a clear shift in market structure leading to a strong bullish move.
Let’s break it down step-by-step:
🧠 1. Head & Shoulders Pattern – The Early Reversal Signal
The pattern started forming around May 26–28, a classic Head & Shoulders that signaled potential exhaustion of the downtrend:
Left Shoulder: Price attempted to rise but failed to break previous highs.
Head: Sellers pushed to form a deeper low, forming the head.
Right Shoulder: Buyers entered again at the previous demand, creating a higher low than the head—indicating weakening bearish momentum.
🟦 The neckline was drawn across the swing highs. Once broken, it confirmed the reversal.
📍Significance: This pattern formed inside a strong SR Interchange Zone, where support turned resistance and vice versa—adding confluence.
🛠 2. Major Break of Structure (BOS) – Confirmation of Trend Shift
After forming the right shoulder, price decisively broke above the neckline and previous highs—this was the Major Break of Structure (BOS).
This is critical in MMC because:
It signals the end of the accumulation or manipulation phase.
It confirms that smart money has taken control and is pushing price in the new direction.
BOS acts as an entry trigger for traders using structure-based strategies.
💥 A strong bullish candle closed above the BOS level, showing aggressive buying.
📉 3. Volume Contraction – Smart Money Behavior
Between May 31 and June 2, we observed a tight consolidation at the previous resistance zone (now support).
Volume was contracting, forming a compression zone—a common sign of liquidity buildup by institutional players.
🧠 Why is this important?
Low volume ranges typically lead to high-volume breakouts.
This is the “accumulation before expansion” phase.
Smart money often accumulates orders here before a major move.
When price broke out of this compression, it did so with high momentum—validating this theory.
🔄 4. Structure Shifting – New Bullish Market Cycle
Following the BOS and breakout from volume contraction, price aggressively shifted its structure:
Higher highs and higher lows started forming.
Price invalidated bearish order blocks and respected bullish zones.
A new bullish market cycle under MMC began unfolding.
🚀 Price is now headed toward the Next Reversal Zone (around $3,460–$3,470), where we expect significant reaction.
🔍 5. Key Levels Explained
🔵 SR Interchange (~$3,280): This acted as a strong base for the Head & Shoulder formation. A key demand zone if price retraces.
🟦 Volume Contraction Zone (~$3,330–$3,350): Launchpad for the bullish impulse.
🟥 Next Reversal Zone (~$3,460–$3,470): A likely profit-taking or short-term reversal zone. Watch for bearish setups or consolidation here.
🎯 Strategy Insights (Based on MMC)
Entry Opportunity: After BOS + Retest of neckline or volume contraction zone.
Risk Management: Stop loss just below the previous low or reversal zone.
Target Zones: Next Reversal Zone or Fibonacci extensions depending on strategy.
📈 Conclusion
This GOLD chart is a textbook example of how technical confluences create high-probability setups:
✅ Head & Shoulder at demand
✅ Break of structure confirms reversal
✅ Volume contraction signals smart money entry
✅ Bullish expansion shows structure shift
🔔 Final Thought:
Watch closely how price reacts around the Next Reversal Zone. If bearish price action appears, it may provide a short-term reversal or retracement trade. Otherwise, a clean break above could signal the continuation of the bullish leg.