Hey SPYLOVERS here are 3 Scenarios for this week check it out...Another week analyzing SPY's behavior correctly as we planned. I’d like to invite you to review my previous analyses of the price movements throughout the week, so you can see that I base my strategy solely on price action and institutional supply and demand concepts—simple methods that the price has respected.
In this case, we won’t be seeing historical highs anytime soon. I believe we’re in a pullback where we need to monitor closely to see if the price might return to the order block I have around $563.60. This area is significant because it’s where the highest concentration of orders in the market is currently positioned.
If we look at the last candle SPY closed with, although it ended higher than the previous one, it’s still showing selling pressure, so we’ll likely continue on the path of selling for a few more days.
The key is to analyze the next move the price makes when it touches the order block:
Here are 3 possible Scenarios.
Scenario 1. If the price reaches this zone ($563.60), it might dip a little further as a fake-out before bouncing back strongly. Here, we need to pay close attention to the candlestick pattern that appears in this area.
Scenario 2. If it respects the order block but doesn’t bounce with enough strength, we might be witnessing a Head and Shoulders pattern forming, which could later bring the price to the inflection zone (the blue middle area).
Scenario 3. If the price breaks my order block with strength and volume, then we’re validating a CHoCH (Change of Character), where we could see the price move to the inflection zone (the blue middle area).
No matter what happens, remember to always watch the candlestick pattern and the volume. That’s the main fuel behind the price's strength, and analyzing it this way will make your analysis more accurate.
Thank you for supporting my analysis. TRADE SAFE! Best regards.
Headandshouldersformation

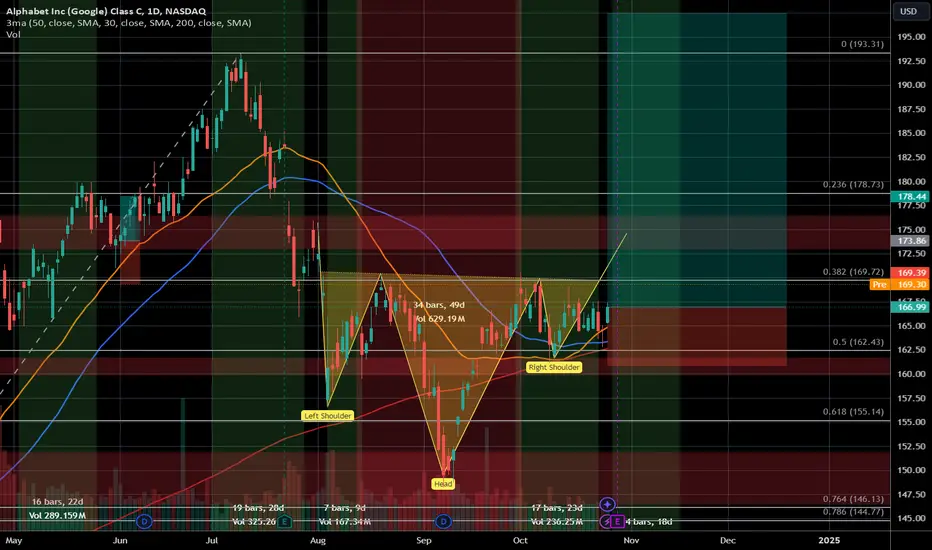
Bullish End of Year?This chart shows the price development of Alphabet (Google). Since reaching its high in July, the stock has been in a downward correction. However, it now appears that this correction may be ending. The price has formed a higher low, which could serve as the right shoulder in an inverse Head & Shoulders pattern.
Additionally, the SMAs are bullishly aligned once again. If the price breaks above the 38.2% Fibonacci level, I anticipate a bullish move toward the end of the year.
TBT - Reverse H&S Shows Strong Upside PossibleInterest rates continue to react to "unbelievably seasonally adjusted" economic data. And while one can complain and point out the methodologies, I believe that the markets are smarter than that. I won't predict how high it might go, but anticipate that it will be one of my big winners in 2025.

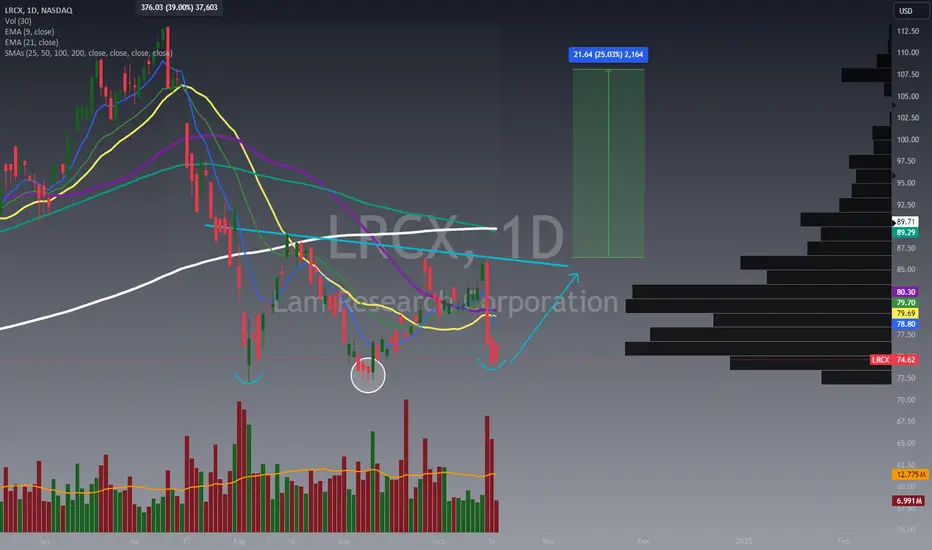
LRCX Inverse H&S Forming! Huge move upward inbound! NASDAQ:LRCX Inverse H&S Forming! Huge move upward inbound!
A break of the neckline would reward a 25% upside to the volume gap!
Head and Shoulder formation HegNSE:HEG is forming head and shoulder on daily timeframe.
Possible target will be 3150.

APTUSDT: Inverse Head and Shoulders Pattern FormationAPTUSDT technical analysis update
APT has formed an inverse head and shoulders pattern on the daily chart. The price has broken the neckline and is now retesting it as support. Additionally, the price is trading above the 100 and 200 EMAs on the daily chart. A strong bullish move is expected in the coming days.
Regards
Hexa

LITUSDT Forms Inverse Head and Shoulders: Bullish Reversal AheadLITUSDT technical analysis update
LIT's price has formed a bullish head and shoulders pattern at the bottom of the weekly support. The price is now moving towards the neckline resistance for a breakout and has crossed above the 100 EMA on the daily chart. Once the breakout is confirmed on the daily chart, we can expect a strong bullish move in LIT
Regards
Hexa

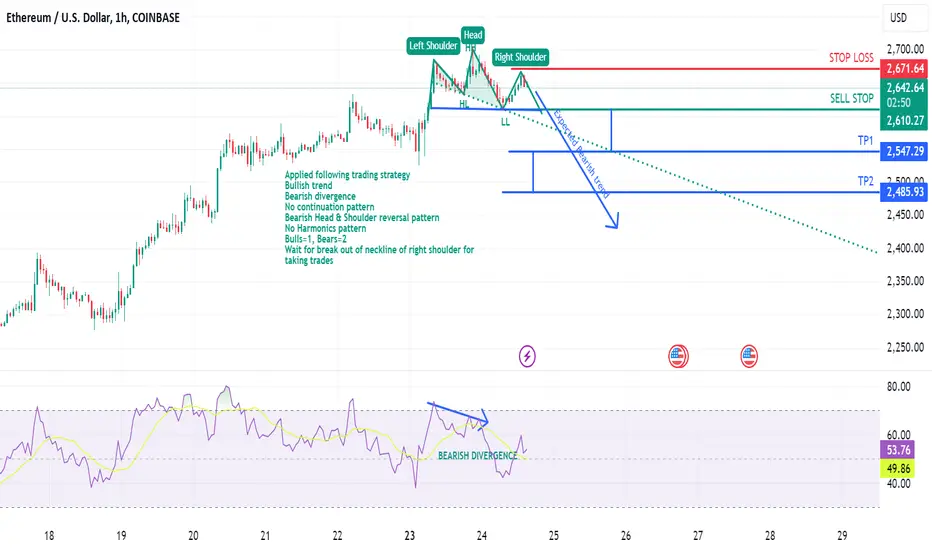
Anticipating trades through trading strategyApplied following trading strategy
Bullish trend
Bearish divergence
No continuation pattern
Bearish Head & Shoulder reversal pattern
No Harmonics pattern
Bulls=1, Bears=2
Wait for break out of neckline of right shoulder for taking trades
BATUSDT Bullish Head and Shoulders PatternBATUSDT technical analysis update
BAT price has broken the inverse head and shoulders neckline resistance on the daily chart. The price is trading above the 100 EMA, suggesting a potential bullish move in the coming days.
Regards
Hexa

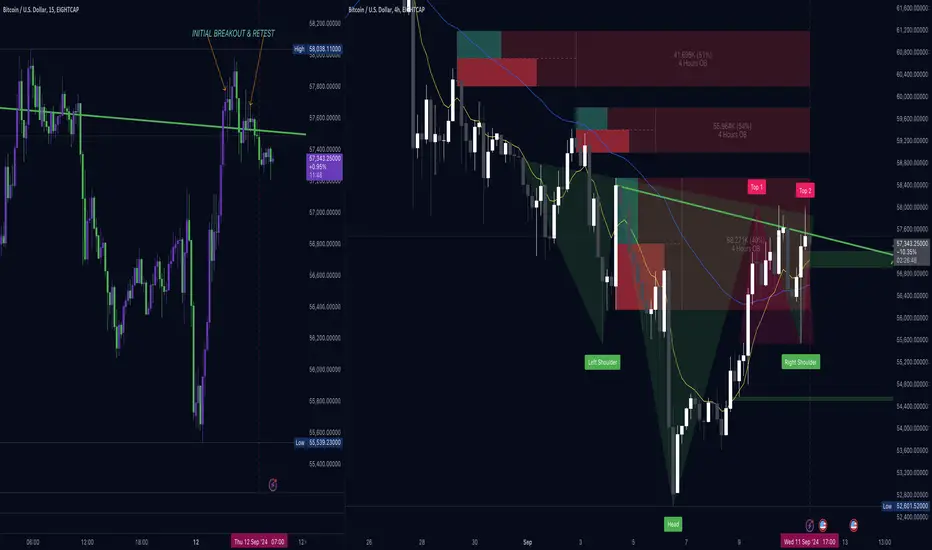
BITCOIN Poised & Ready To Boil (Heads 'N' Shoulders)
This one for BTC USD is on the 2,3,4 hour timeframes. Price has retested & is ready to bust to the long-side. Good luck.
I have done the Heavy-lifting for YOU! CHF-JPY: H&S's Sell
Hi guys,
I have done all the heavy-lifting & planning for you on this one.
It may be as simple as hitting the 'sell-button'.
It's a Daily-chart pattern which will hold more weight,
Price has almost retraced to the neck-line,
Hop to it, take a look,
Thanks for reading.

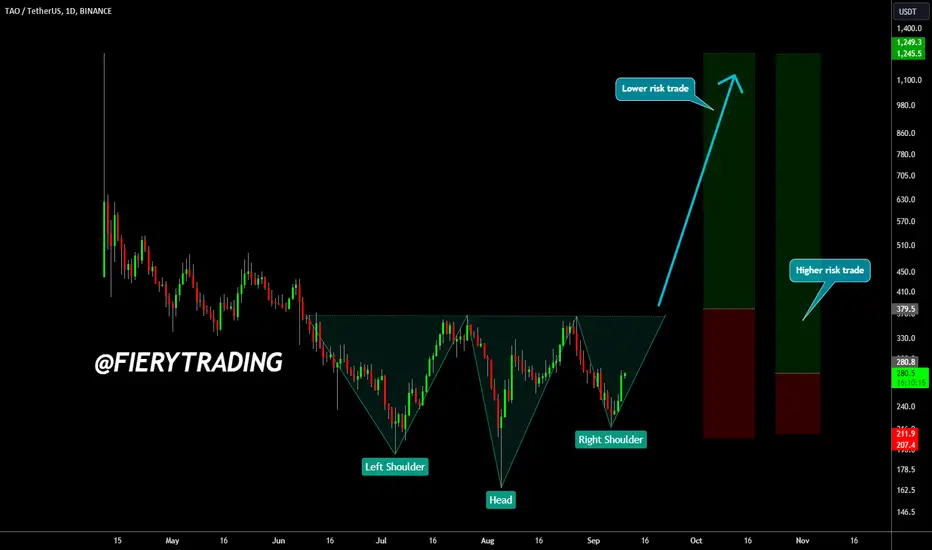
TAO Bullish Inverse Head & Shoulders: Patience is Key!TAO has been forming a bullish head & shoulders pattern over the last couple of months. The pattern is still not complete, so be patient for it to complete.
If you're confident that this pattern will play out and the market will reverse, take a look at the higher risk trade I put on the right. Tighter stop, so higher potential profit!

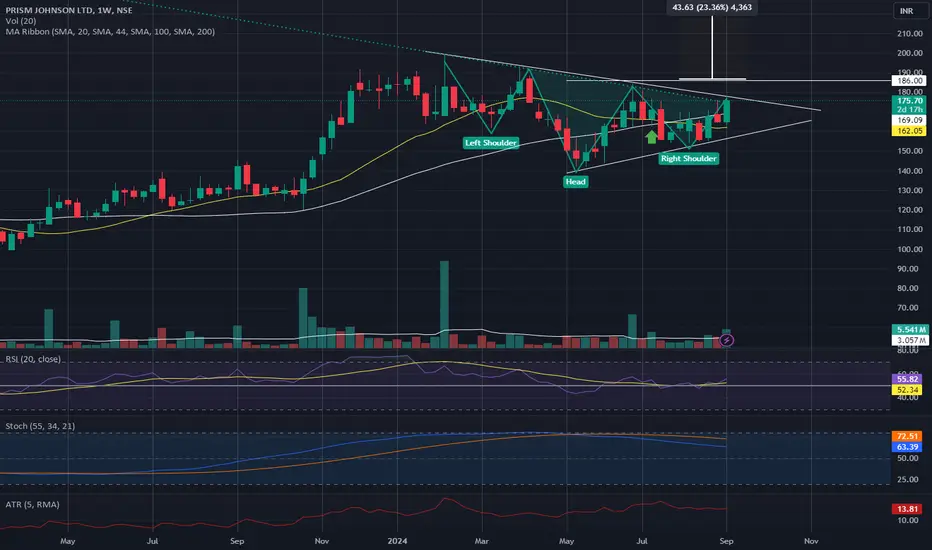
PRISM JOHNSONS - HEAD AND SHOULDERSHead and Shoulders Observed in Weekly In Prism and Johnsons
Entry - above 186
SL - 10%
TGT - 230
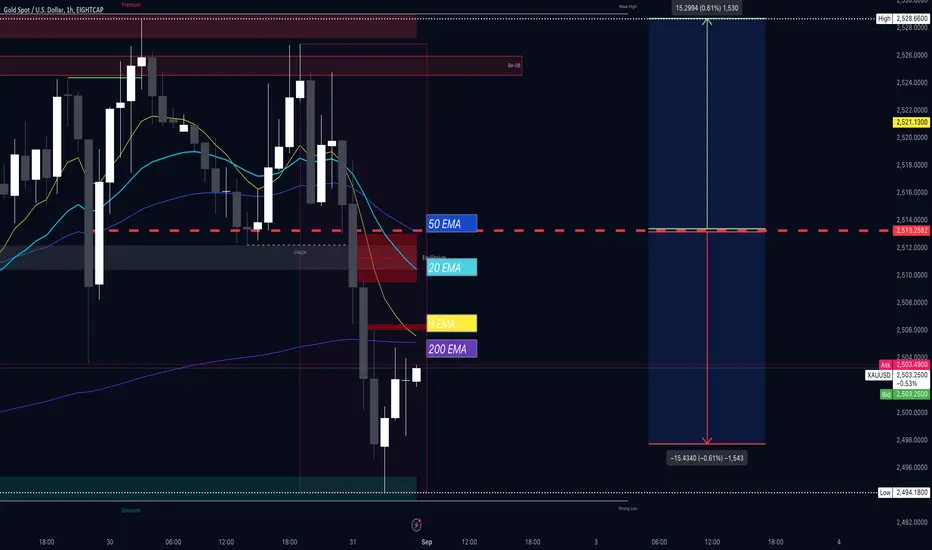
Gold's Hourly Chart - M_Top Breach @ 2513.25 - Recovery?
Hello,
I was saying all week that the USDX was going to be strong in it's recovery from selling off the past few weeks.
I didn't think the economic data was all that bad during Friday, I think the damage set-in once the USDX started to rally on the retest and close above 101.50. As the NY session opened on Friday I saw a lot selling of the Gold-price as the USDX was making a sustained rally above 101.50 and then it skipped back under this level and buying of the Gold-price started to occur but it was a bull-trap.
The Gold market sold off and as can be seen on the hourly chart a breach below 2513.25 and the selling intensified. It is always harder to navigate in real time, I get it.
You can see here on the hourly that the 200 EMA is starting to slope down and the 9 EMA is about to cross it.
But it's not all bad. When Asia opens on Monday there is a bullish Head n Shoulders that has formed on a 5 minute chart. (Please see below). Indications are that this will retest and execute taking the market higher. However, for the market to recover, buying will have to continue following this pattern to keep the Gold price above important key moving averages. Otherwise, this 5M pattern will play out bullishly for a time and the Gold price could sell off again. The Gold market got its liquidity during Friday, so lets see where price goes.
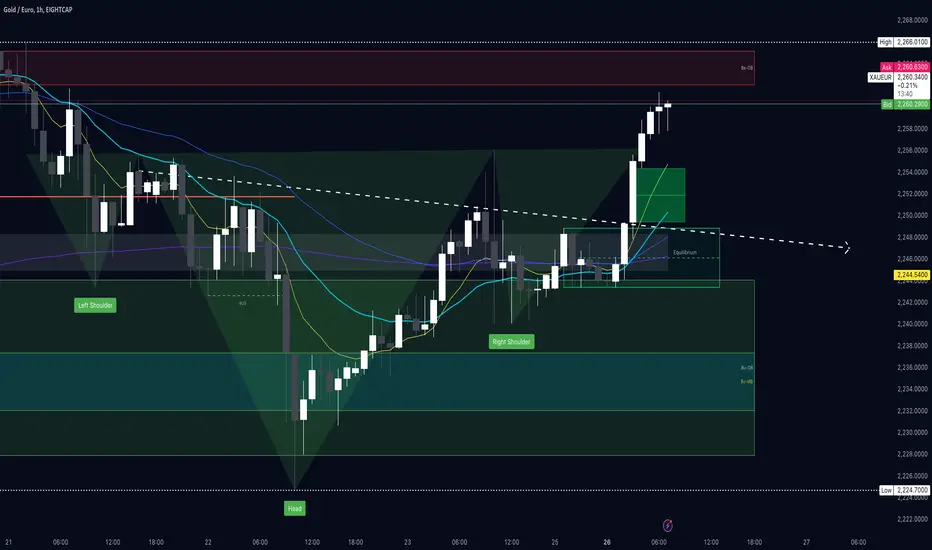
XAU EUR Bullish HnShoulders.... Waiting for a Retest back
I see price retracing here back under the neckline for a breakout possibly later.
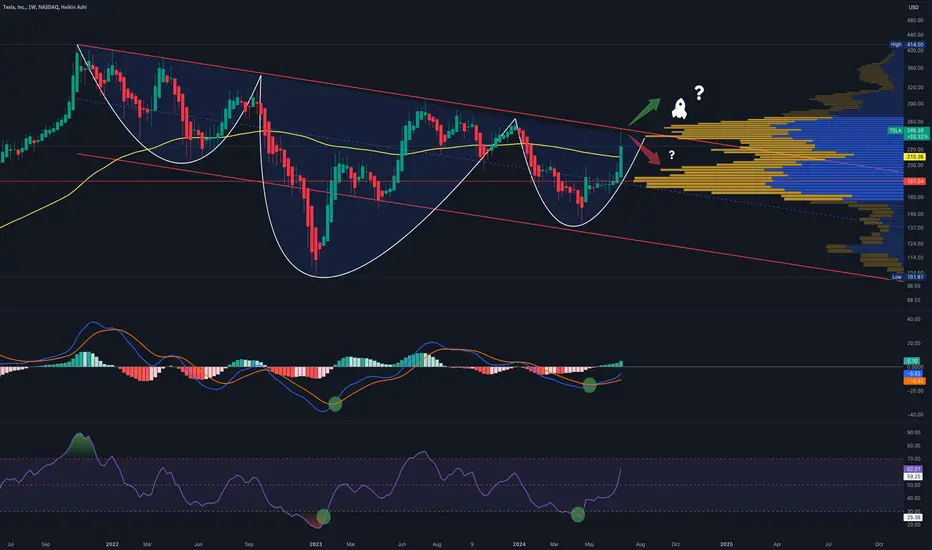
TSLA - Inverse Head and Shoulders on Weekly Chart.NASDAQ:TSLA Tesla looks ready to finally break its falling trend. On the weekly chart, I see an inverse head and shoulders pattern form completed. If it manages to break the trend and stays above it for a few days or a week, I expect a strong upward movement from the volume shelf launch pad ramp. However, in a possible correction, my first target will be back to the $200 level.
Gold Rally's on the back of Heads 'n' Shoulders Pattern
Gold has recovered beautifully in the past hour or 2.
Very recently the push upwards relates to a bullish Heads 'n' Shoulders Pattern on the 1m, 2m, 3m timeframes.
* DYOR as well. Please don't rely solely on my investment advice.
Regards,
Chris

Bitcoin on 1HR Chart Support at present + H & S still valid!
I see on the 1HR chart that Bitcoin is getting strong support on convergence / intersection of the 20 / 50 / 200 EMA's.
There is still a valid Head N Shoulders pattern above current price by just over 1% to chase to the neck line. It is a bit of a tired pattern from yesterday & currently 49 bars across from the right shoulder.

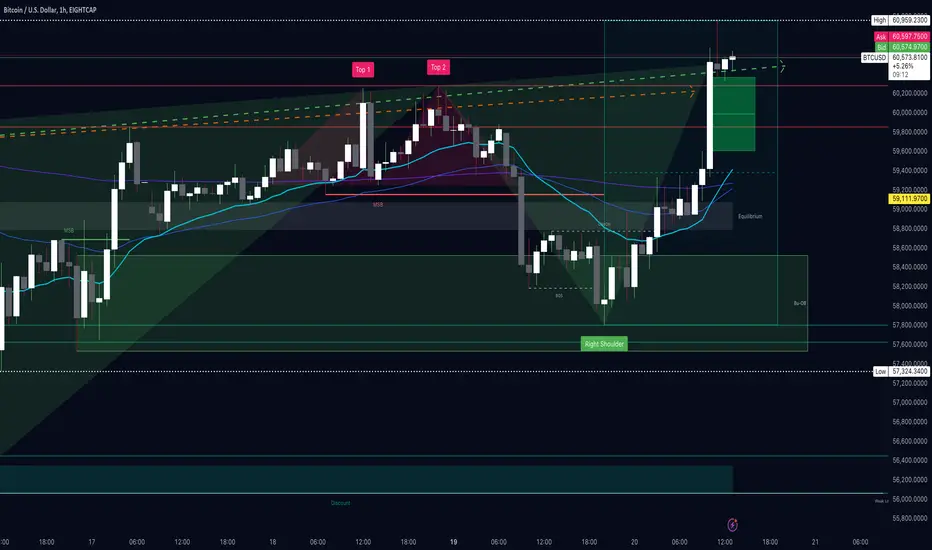
Bitcoin BTCUSD resumes rally on 1HR H&S pattern!
Bitcoin following a little strength in weak volume weekend trading & then softness during Monday trading right around the world, has during Tuesday's Oceania & Asian session recommenced a rally fuelled mostly by this Head 'n' Shoulders Buy setup on the 1 Hour timeframe. It appears to be showing good strength so far today.
Buy on a pullback perhaps..... It would appear that a retest of this H & S is complete.
ISEC - ICICI Securities - Uptrend - Long1. Head and Shoulder Pattern
2. BoS
3. ADX - started to show the trend strength

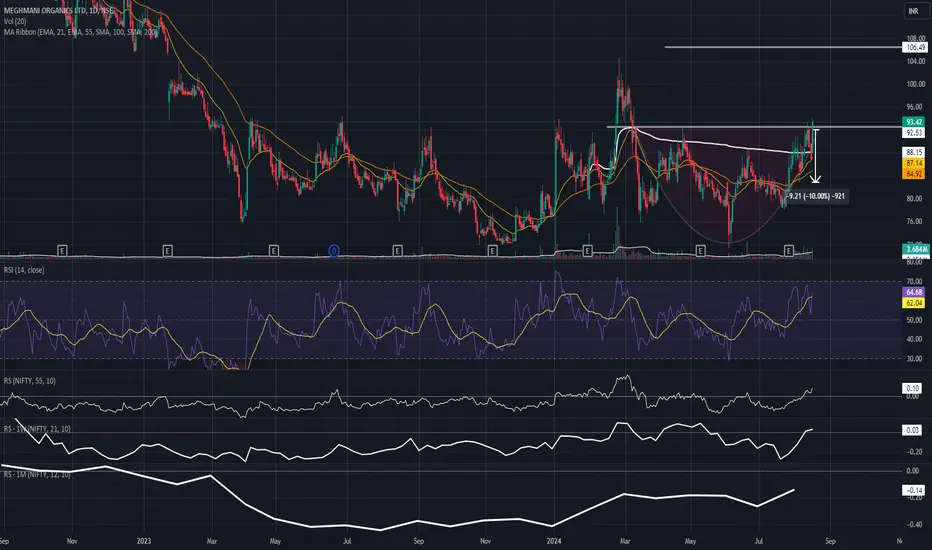
ROUDING BOTTOM/ HEAD AND SHOULDDERS - MOLRounding Bottom/ Head and Shoulders Observed in MOL
1. RSI > 50
2. RS(NIFTY 50) > 0
ENTRY - 90.15
TGT - 103-105
SL - 83