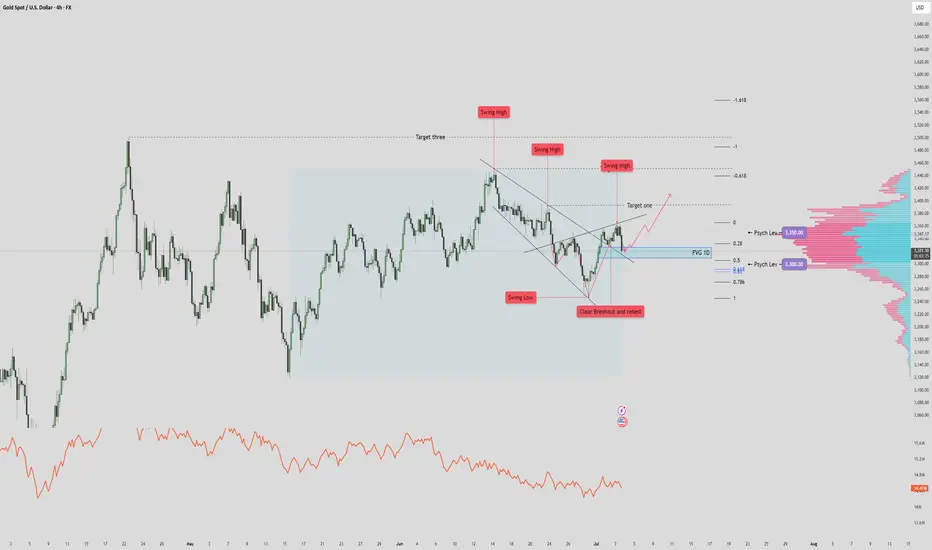
XAUUSD $3500 Recovery? Reverse Heads and Shoulders? 🔎 STRUCTURE & TECHNICAL ELEMENTS
1. Pattern:
A falling wedge was formed and broken cleanly to the upside → bullish reversal structure.
Breakout was followed by a successful retest at prior structure lows (marked “Clear Breakout and Retest”).
2. Fair Value Gap (FVG 1D) Zone:
Currently being tested. This zone coincides with:
Minor support from prior consolidation
Fib retracement (0.5 level)
Potential demand area (watch for bullish reaction/candle structure here)
3. Volume Profile:
3,350 = POC (Point of Control) → heavy resistance.
3,300 = Secondary HVN → strong support below current price.
Low-volume nodes just under current price → if broken, price likely accelerates into the GP zone.
4. Fibonacci & Liquidity Confluence:
Golden Pocket (3287) just below 3,300 = ideal liquidity draw if FVG fails.
Target 1 / 2 / 3 above are Fibonacci-based projections + historical swing zones.
✅ SCENARIO 1: Bullish Case – FVG Holds
If price respects the FVG 1D zone, expect:
Continuation up toward Target One (~3,430)
Extension to Target Two (~3,470) and even Target Three (~3,540+) possible
Confirmation: Bullish engulfing / high-volume bounce / sweep of intraday lows without close below FVG
Bias: Bullish continuation as long as price holds above FVG/0.5 Fib
🚨 SCENARIO 2: Bearish Case – FVG Breaks Down
If price closes below FVG zone, particularly below 3,312:
High probability drop toward 3,300 (psych level)
Liquidity sweep and deeper correction into Golden Pocket (~3,287) likely
This area can act as a high-probability long re-entry zone
Bias: Short-term bearish if close below FVG + swing structure invalidation
⚖️ REFINED SUMMARY
Price rejects off FVG - we can expect target 1 and 2 tagged.
Price breaks & closes below FVG zone - we can expect it to drop/wick to 3,300
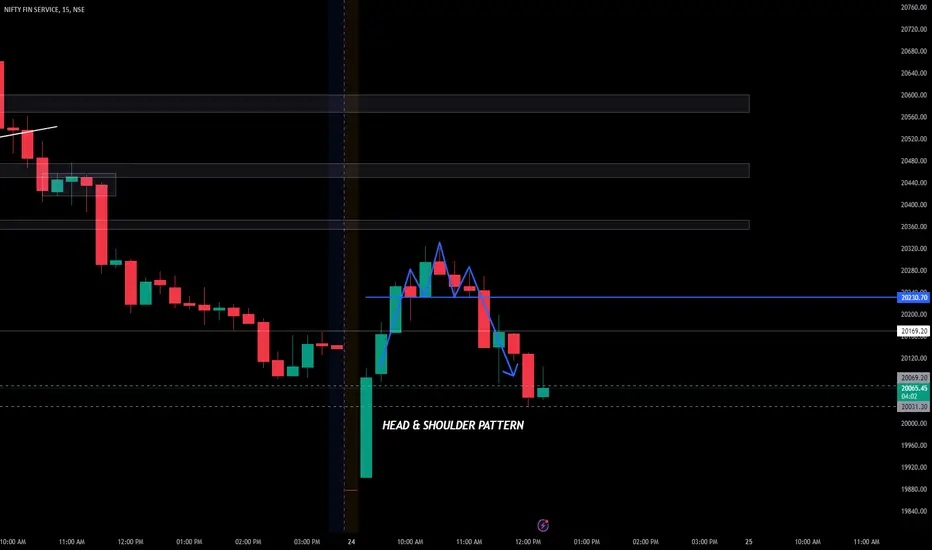
Headsandshoulders
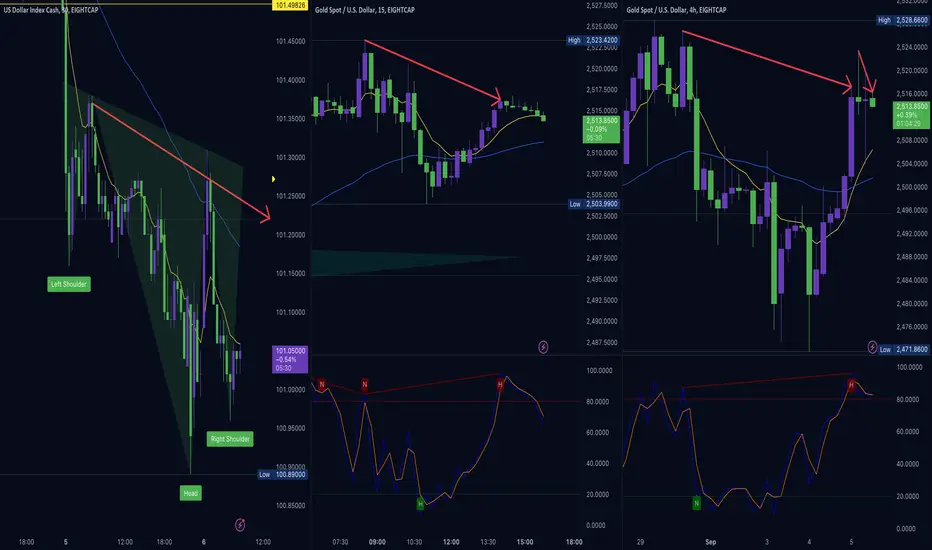
The Hidden-Threat(s) To Gold-Trading During Friday!
So the economic-data seemed good today for the Gold-price. Initially, at commencement of NY session today (Thursday) the USDX came rallying off its 38.2% retracement. But it quickly quietened down & retreated even further and Gold was able to lift somewhat.
There are Heads 'N' Shoulders patterns that have formed on the USDX charts from 5m right up to 30m. See the charts & USDX on the left of screen. A rally to the neckline, a retrace and it could really move hard and fast during Friday.
What I also see is hidden divergence on the 15m and 240m Stochastic charts for Gold XAUUSD. This is probably not the main concern, it would be the USDX setting up for a rally very soon.
Lets see how it plays out.
Head & Shoulder Pattern : FINNIFTYFINNIFTY after shooting up high from day's open was forming a H&S pattern and the down surge in price confirmed it. It demonstrated a classical text book example by creating higher highs & lower lows ultimately breaking down & giving a great shorting opportunity.