GOLD: Bullish - FLAG detected + Breakout of the range.GOLD: Bullish - FLAG detected + Breakout of the range.
1- A "Head Shoulders" has been detected and we did a perfect Take profit ( TP1) at 2 395$.
2- When we break a range the Take profit should be the Height of the range.
Then the TP2 is expected around 2 518$.
3- Plus we can also consider that the range is like a flag and then the TP3 ( green arrow) is expevted around 3 030$
The red horizontals are retracements regarding ICHIMOKU levels .
However a retracement Fibonacci gives a target lower around 2 100$.
Be careful
Headshoulders

GOLD → if the neckline breakshello guys.
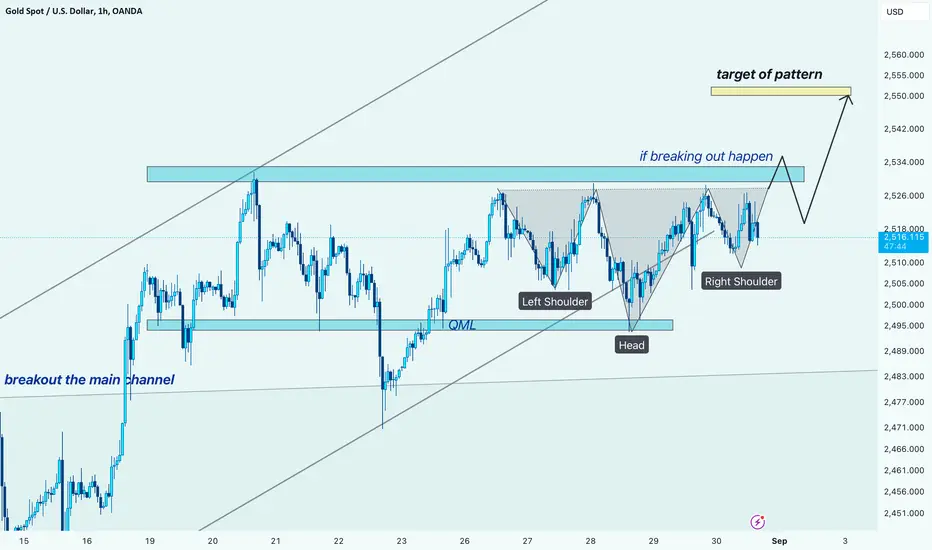
Inverse Head and Shoulders Pattern:
The price action is forming an "Inverse Head and Shoulders" pattern, with the left shoulder, head, and right shoulder clearly marked. This pattern typically indicates a reversal from a downtrend to an uptrend.
The neckline of the pattern is located around the resistance zone at approximately $2,534.
Breakout Potential:
The price is currently trading near the resistance zone (neckline). A breakout above this level would confirm the pattern and could lead to a strong bullish move.
If the breakout occurs, the target of the pattern is set around the $2,555 level, representing a substantial upside potential.
Support Levels:
The key support level is near $2,495, which aligns with the head of the pattern. A break below this level would invalidate the pattern and may lead to further downside.
Key Levels to Watch:
Neckline Resistance: Around $2,534.
Target of Pattern: Around $2,555 if the breakout is confirmed.
Potential Trading Strategy:
Consider entering a long position upon a confirmed breakout above the neckline ($2,534), with a target around $2,555.
Place a stop-loss below the right shoulder or the head of the pattern to manage risk effectively.
Overall, the chart suggests a bullish setup with a potential breakout above the neckline that could lead to a significant upward move. The Inverse Head and Shoulders pattern supports a bullish outlook as long as the price remains above key support levels.
__________________________
✓✓✓ Always do your research.
❒❒❒ If you have any questions, you can write them in the comments below, and I will answer them.
❤︎ ❤︎ ❤︎And please don't forget to support this idea with your likes and comment
BTC → a signal to get a long positionhello guys.
as you can see btc made a Head and shoulders pattern and the neckline broke up!
so we can expect the $65802 area touched!
___________________________
✓✓✓ Always do your research.
❒❒❒ If you have any questions, you can write them in the comments below, and I will answer them.
❤︎ ❤︎ ❤︎And please don't forget to support this idea with your likes and comment

Friday 23, N.Y Gold & USDX: Very very interesting...See charts!
Happy Friday guys, I was tired & late getting into the Asian session earlier. But as soon as I locked-horns with my 42" monitor I saw that Gold & Silver were in a mild upside rally. I soon took a long position & recommended one for you in Silver which was rallying stronger than gold.
The gold price struggled at resistance from 2490 to 2500, not strong resistance at 2490 but volume is always lighter in the Asian session. We quickly booked a profit, I am hoping you did as everything happened so fast in a Long trade which only lasted 40 minutes or so. What happened next? Plz read on below.
I saw that price kept getting rejected at the 20 EMA on the lower-time-frame. I decided to go Short & I recommended a very small lot-size Sell-stop below where price was I think from memory my Sell-stops were around 2489 or thereabouts. Next, I distracted myself on another project on the 'hotcopper' forum with a bullish lithium company I am very heavily invested in called Raiden Resources RDN is the ticker, if you want to check it out, I will never sell Stock trades but this thing is looking good, but you google the stories on Raiden Resources if you wish.
So, I had no Stops on my Short because I generally do not like Stops because I find 9 times out 10 the Market-Makers will hunt your stop down so that Mr & Mrs Market-Maker make their big fat wealthy private bank clients wealthier. Maybe that's a bit harsh, but I often wonder.
So the Gold price found support because I took my eye off the field & forgot to book profits and the Gold price started to properly find support and some strength above 2490.
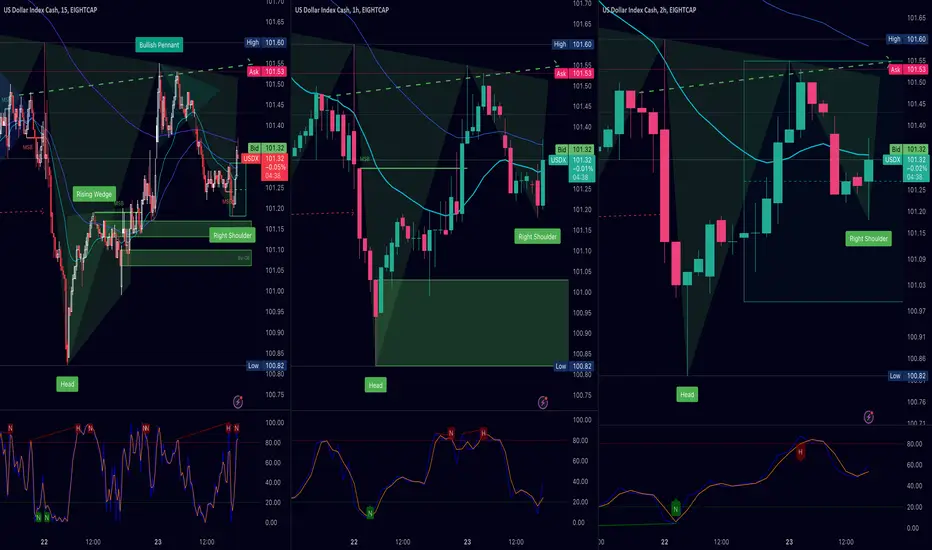
Guys, that is enough on that. Look what concerns me in Friday trading are these bullish Head 'n' Shoulders patterns & on multiple timeframes. We are still about 0.31% from the trigger line & look they probably won't play out today, but what about next week? If the USDX does turnaround next Monday & it certainly could do that because it is very oversold on the Stochastics. However, the path of least resistance for the USDX is further down because it's below its moving averages & how many bloody times do we go Long & then close out of the trade & look at a higher-time-frame & exclaim to ourselves, 'I am an idiot the trend was down / the path of least resistance was down - Why did I go Long'. I used to do it all the time when I was a very green, greedy & gullible trader. Well I still get greedy!
I will monitor these H & S's on the ASDX.
I see where the boss speaks today, The Fed Chair, Mr Powell at 10am Eastern Time USA & Canada and we also have another chat from FOMC member Bostic. My feeling is that Mr Powell has maybe felt a bit anxious lately & he may give our market a bit of a boost today by reiterating the theme of interest rate reduction(s) next month which of course will bode well for Gold & Precious Metals in general.
Further on the Economic Calendar today, we have Building Permits at 08:30am & then New Home Sales at 10am, the latter having a bit more weight and bearing on our trading. Unless you are looking to Short the Gold price today, with our 2 speakers hopefully talking up an interest rate reduction & if the other 2 mentions on the economic calendar come in a bit bearish then this will be poor or the USD but more than likely supportive of the Gold price and getting back above 2500, which I think is where the 50EMA sits on the 1 HR Chart.
So recapping, my feeling is that today will be bullish for Gold depending on New Home Sales mostly but Mr Powell's endorsements rate reductions for the US economy commencing next month will shrug off any bearishness in the Gold price.
In addition to the Head 'n' Shoulders patterns for the USDX (see the 1st set of charts), I have scouring Precious Metals searching for other H & S's patterns so I will be posting these charts so that you have a road-map for the possibility of taking these H & S trades which are predominately bullish ones, I will post these below very soon & I have tradingview alerts set for when price gets near the neckline.
Cheers,
Chris
Bulls HnS's Prec.Metals below. Plz-read-Friday Gold Commentary!
There are some bullish Head 'n' Shoulders patterns today in Precious Metals.
1st up see charts for Palladium XPDUSD. This is a bullish H & S's on multiple timeframes. 5m played out earlier in Asian session but we still have setups on the 1HR, 2HR and 4HR charts.
If Mr Powell gives the market the boost and shot-in-the-arm that I think he will today because I am guessing he has been a bit on edge lately like a trader who just lost 30k in a day. I am hopeful we will get a good run today Long in precious metals. Mr Powell speaks at 10am Eastern USA & Canada.
Be aware that some of these setups have already retested and others have not, but I will do my best to guide you through it with an alert if Entry becomes noticeable to me in the charts later. This is of course if you are a newer trader. I know most of you are experienced.

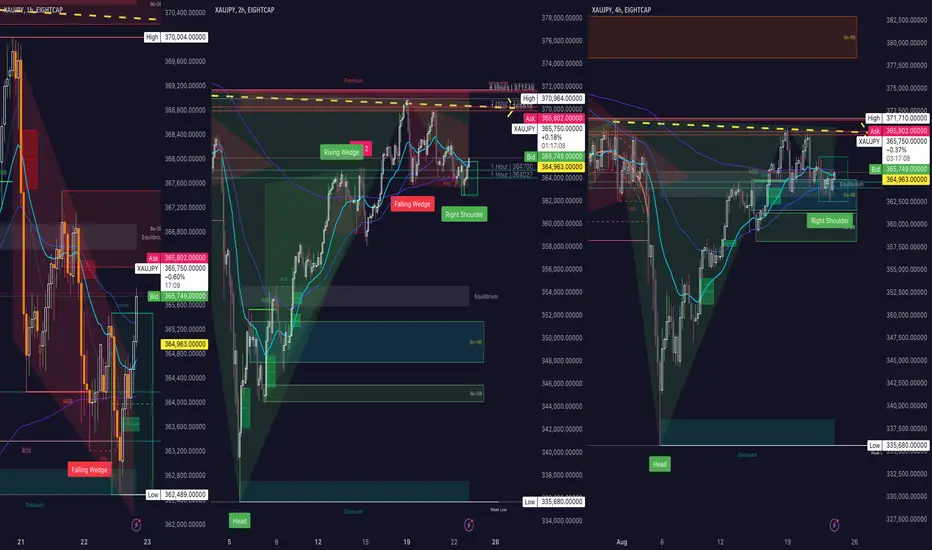
Huge LONG-Gains Potential here...XAU JPY
Heads 'n' Shoulder long XAU JPY on 2HR and 4HR.
Note: This trade has not re-tested yet. I will keep monitoring.
BTC → if breaks up get a long positionhello guys.
let's dive in BTC!
1. Pattern Recognition:
Left Shoulder: The first peak formed before the head.
Head: The highest point in the pattern, showing a peak above the shoulders.
Right Shoulder: The final peak, which is lower than the head but roughly in line with the left shoulder.
2. Key Levels:
Neckline: The blue line around $57,571.68 marks the support level that connects the lows from the left and right shoulders.
Breakout Zone: The chart highlights a yellow resistance zone just above the current price. If Bitcoin breaks above this zone, it could lead to a bullish breakout.
3. Bullish Scenario:
Upside Potential: If the price breaks above the yellow resistance zone, the next target could be around $62,343.58. This would confirm the pattern and signal a potential continuation of the upward trend.
4. Bearish Scenario:
Failure to Break: If the price fails to break above the resistance zone, it could result in a pullback to the neckline of around $57,571.68 or lower.
Summary
Pattern: Head and Shoulders identified on the 15-minute chart.
Neckline Support: Around $57,571.68.
Resistance Zone: Key area to watch for a breakout just above the current price.
Bullish Scenario: A break above resistance could lead to a move towards $62,343.58.
Bearish Scenario: Failure to break resistance might lead to a drop back to the neckline or lower.
___________________________
✓✓✓ Always do your research.
❒❒❒ If you have any questions, you can write them in the comments below, and I will answer them.
❤︎ ❤︎ ❤︎And please don't forget to support this idea with your likes and comment

For junior traders on how to trade a head & shoulders pattern:The diagram should be fairly self explanatory. Alerts come in very handy on tradingview when trading heads n shoulders. For example set an alert near the neck-line when price action gets close. That is what I do, any questions please ask. Cheers, Chris
EURNZD_2024-08-13_02-29-02_97e7e.png

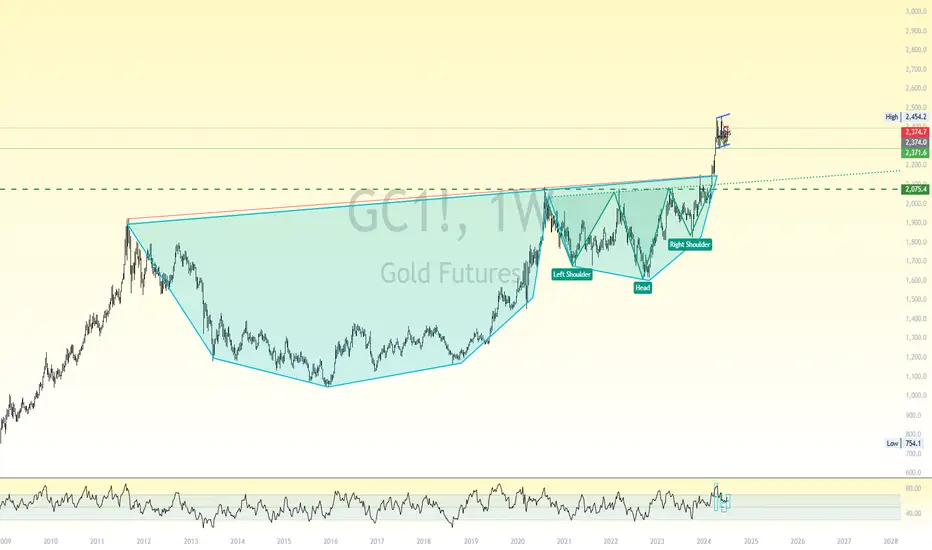
Gold Bullish 6 Year OutlookPast chart history shows gold price went into a bear market from 1980 to early 2000's and again in 2011 to 2020. Currently, we are trading in the bull cycle which lasts on average 9 to 10 years. Analysts, projected a price of gold to hit 2500 by the end of this and we seem to be right on track. Price is trading inside of a bull flag where buyers and sellers are repositioning themselves. What will drive the price of gold higher by the end of this year? What about the year after that and so on?
Looking back further on the weekly chart a cup and handle technical pattern is breaking out. Projected price of this breakout caps out at around 3010. Will be interesting to see if and how the price action of this commodity will reach 3k by 2030.
BTC → it will touch the $85Khello guys...
the chart shows a forming head and shoulders pattern! a double one!
I think it will touch the gray area to form the next double right shoulders, afterwards, it will reach the neckline level (I've shown it as a dashed-line)!
if the dashed line breaks up the price will touch the $85k level!
let's see!
___________________________
✓✓✓ Always do your research.
❒❒❒ If you have any questions, you can write them in the comments below, and I will answer them.
❤︎ ❤︎ ❤︎And please don't forget to support this idea with your likes and comment

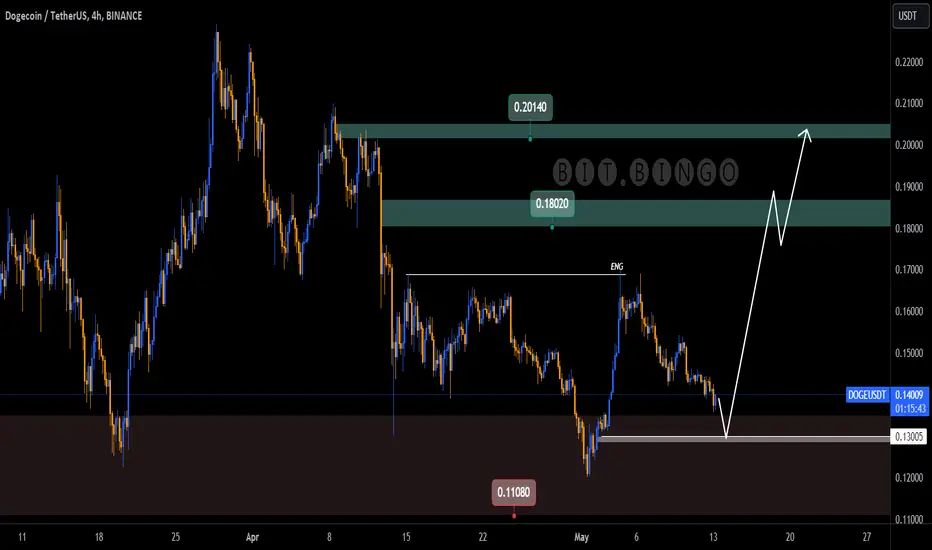
DOGEHi guys
Considering the consumption of the specified range, the probability of reaction to the specified price range is very high.
On the higher time frame, the probability that a higher ceiling will be formed compared to the previous ceiling is very weak.
As a result, our bullish view is short-term for now.
What do you think?
EURAUDHead and shoulders forming on the EURAUD
Looks very similar to the EURUSD in 2021.
On daily it is at resistance.

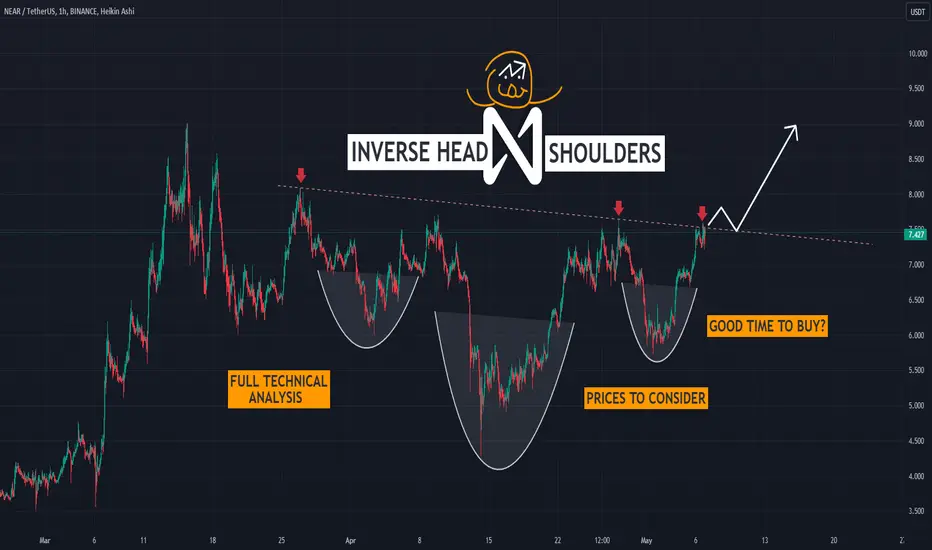
NEARING A HEAD AND SHOULDER PATTERNIn this idea, I'll tackle the bullish pattern, inverse head and shoulders forming for $BINANCE:NEARUSDT. Currently, it is sitting on the neckline, and I've been monitoring this coin two days ago. I'm now lending this idea as it could have a potential for a breakout anytime soon. More details for the technical analysis for NEAR in my idea threads below. Stay tuned :)
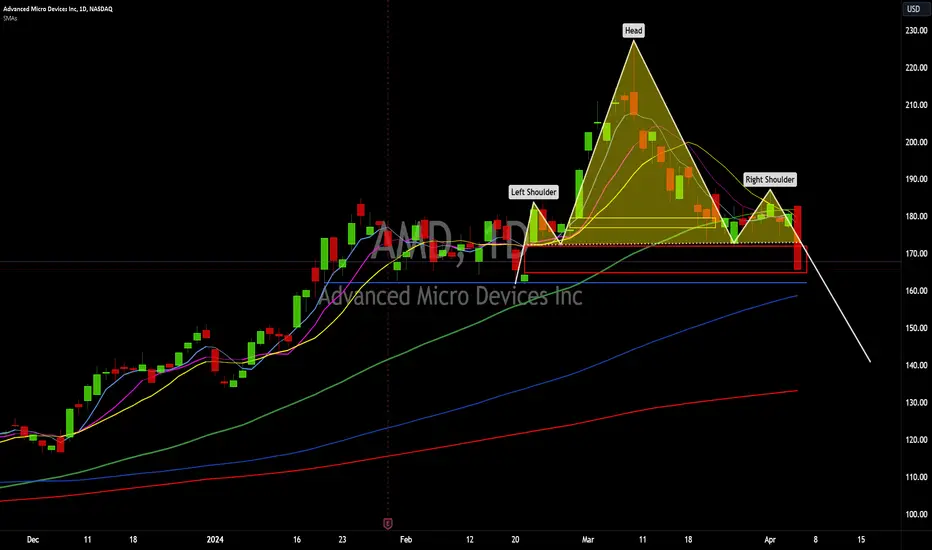
AMD H&S NASDAQ:AMD AMD clear Head and shoulders pattern
price filled gap and broke downside could see 150 - 145
Put Protection for positions or exit.
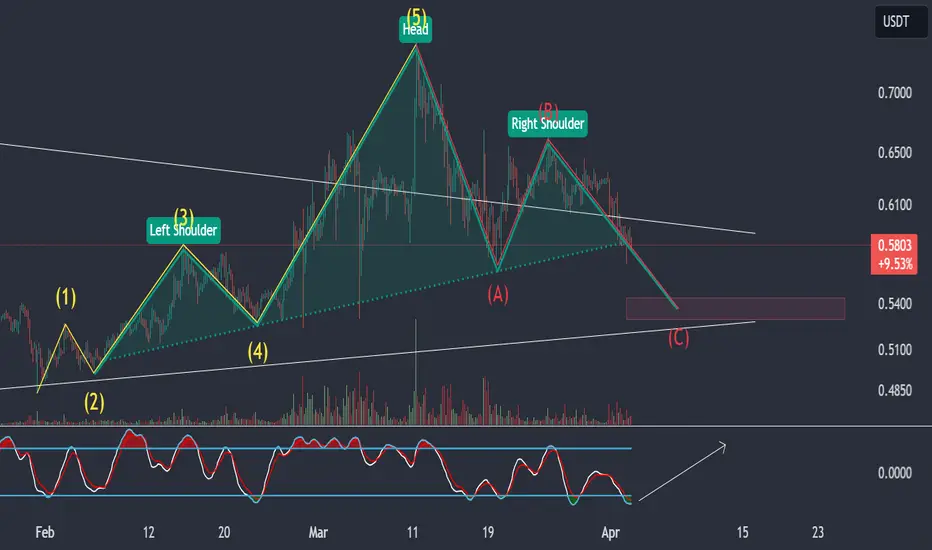
XRP Head & Shoulders + Wave Count Chart.XRP is currently in an ABC correction pattern that is forming a perfect Head & Shoulders pattern. If price action continues to drop, I expect it to hit the lower range of the descending wedge indicated by the purple box, which could act as a launching pad for the next wave up.
Good luck, and always use a stop-loss!
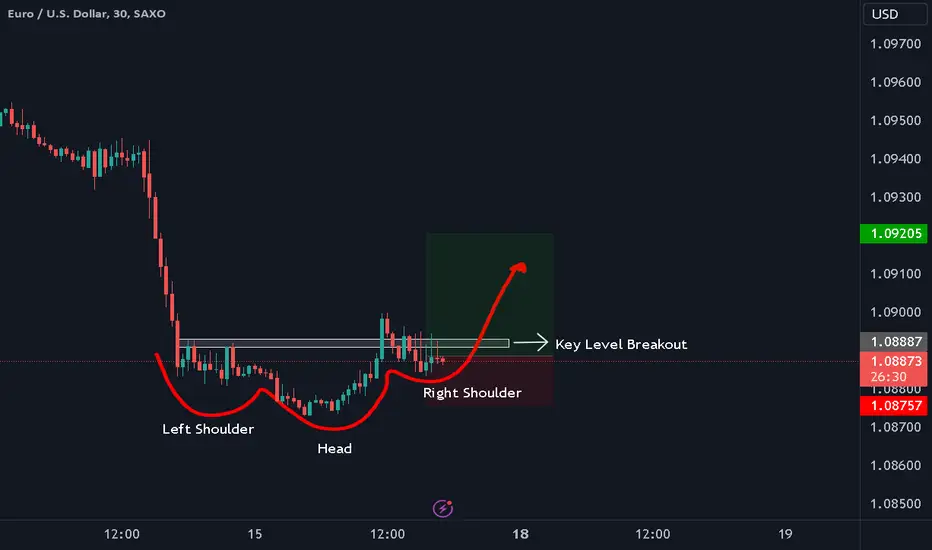
EURUSD Inverse Head and Shoulders LongWe expect further upside on this pair, signalled by the formation of an inverse head and shoulders pattern breakout. We can also see the breakout of a key level supports our directional basis
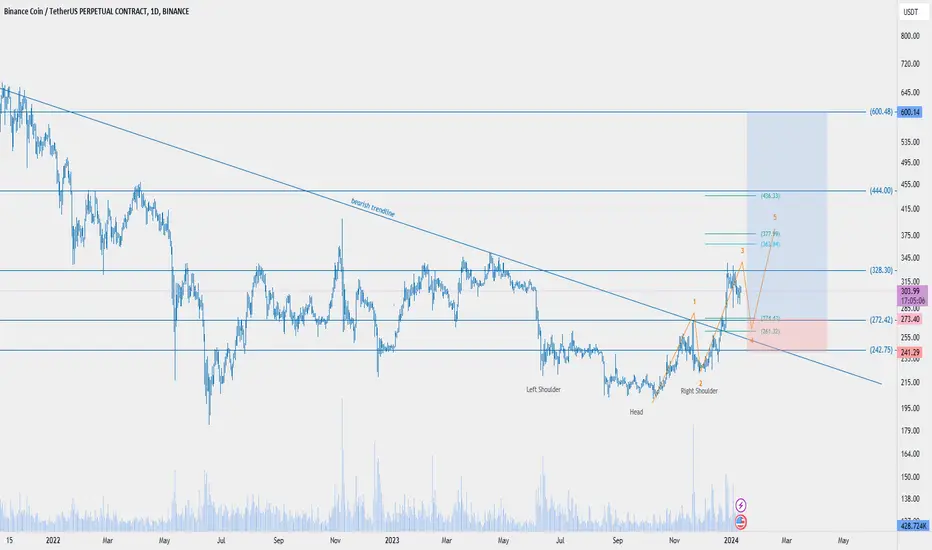
BNBUSD Retesting Head and Shoulders for a Bullish Move 🔥BNB to Retest Head and Shoulders, Setting the Stage for Bullish Momentum
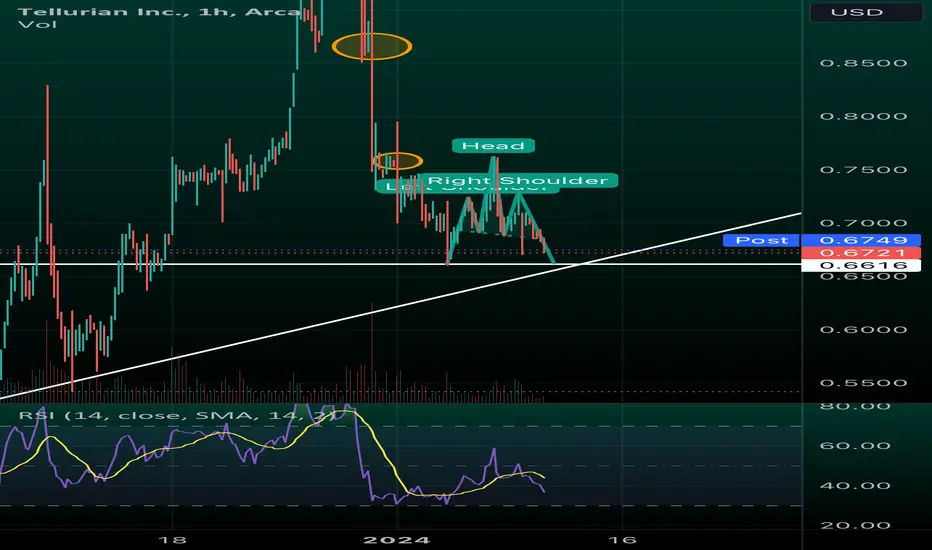
Head and Shoulders - 1hrClassic head and shoulders on the 1hr timeframe. Looking at a low of .66 which is also current support for now. There is also a bullish trend line on the longer time frames which must stay in tact. We could be seeing a bullish reversal after confirmation of support level .66 and if broken we are looking at .60 and lower.
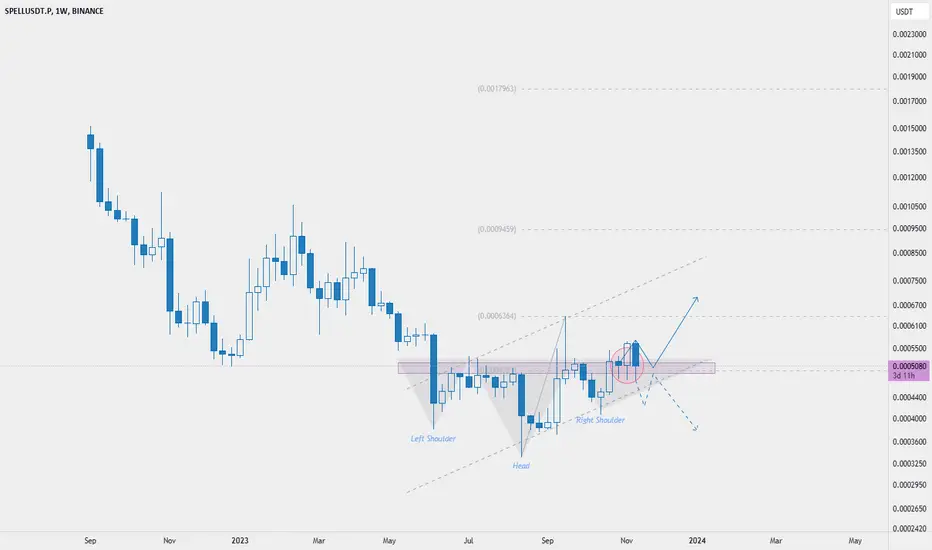
SPELL at a Crucial Juncture: Retesting Head and Shoulder PatternSPELLUSD 1W finds itself in a pivotal moment as it undergoes a retest of the head and shoulder chart pattern.
Why Bitcoin may move down to 12.5k1.) The 50/200 day EMA are about to complete a death cross (the 50/200 day MA have already done so, not shown above)
2.) The weekly price action has formed a rising wedge
3.) Price stalled out at the first area of resistance, failing to reach as high as the candle close from July of 2021
4.) Weekly RSI has printed a head and shoulders pattern and looks like it wants to move down. Note that there could be an interim re-test of the neckline that provides a small rally before breaking down.
5.) 12.5k is the next area of support after losing 16.5k.
6.) Volume has gone down as price corrected, indicating weakness.
For Bitcoin to return to bullish, it needs to get back above the 50/200 day EMA and MA, and we should see a strong reaction following the death crosses that quickly cross back over.

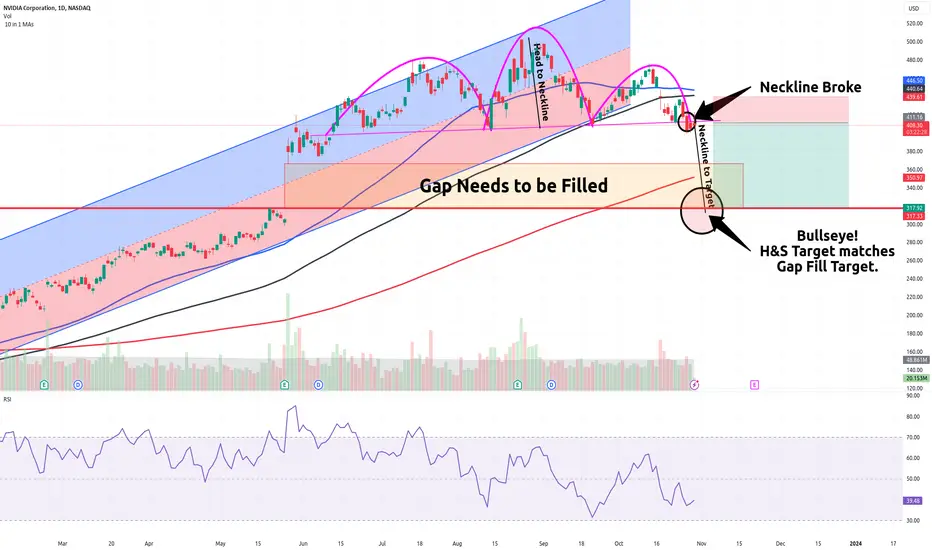
Short NVDA to $317?Traders,
Couldn't help it. Far too enticing to ignore. NVDA price will be attracted to that $317 level like a super magnet. Not only do we have a H&S pattern now in play, but we have that huge gap to be filled. I mean, trades like these don't come around every day! It's a no-brainer here.
Not fin advice. Pure entertainment only.
Stewdamus
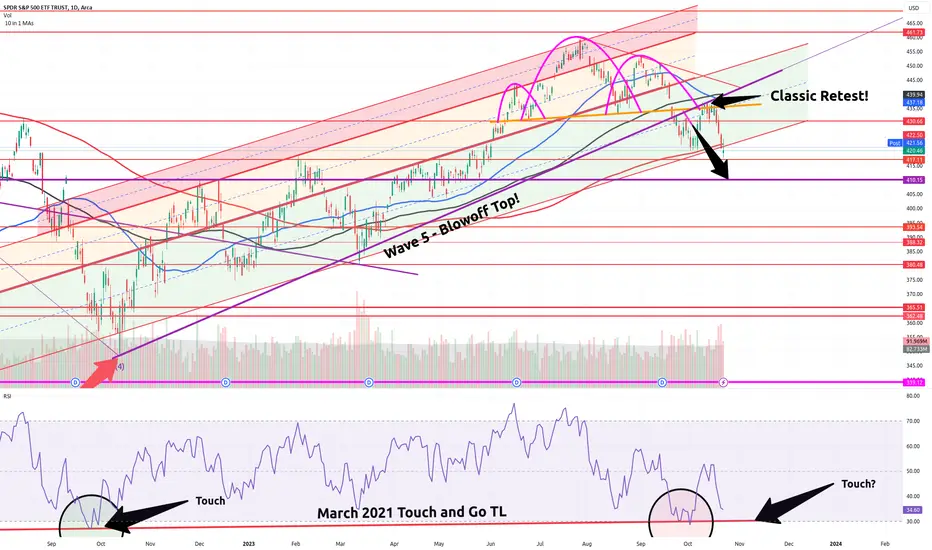
SPY 410 Target Now ConfirmedTraders,
A couple of weeks ago you'll remember I expected a bounce off of our 200 day SMA which coincides with the bottom of my channel, making a strong area of confluence and support. But I wasn't sure if that was the end of our drop? Turns out, after testing the underside of our neckline for a patent classic retest, we have now broken below the 200 day SMA and channel. Tomorrow will provide confirmation. As of now, I will say that our $410 target down is certainly in play. And look how it coincides with the RSI! We should hit 410 right about the time the RSI is also finding its support on our long-trending touch and go.
Best,
Stew
OPUSDTHey guys
What do you think about an upward trend up to the yellow range?
It seems that we can expect an increase and an upward trend from the price range of $1.1641
