HEAD & SHOULDERS PATTERN AND A LIVE EXAMPLE IN AUDJPYHead & Shoulders pattern is popularized amount traders, the H&S is one of the first patterns traders come in contact with.
H&S are formed in all time frames and in all markets.
Here is an example of AUDJPY trading H&S in a Daily Chart.
H&S are reversals patterns, they can be trade in all times frames but i like to use the H&S in smallest time frames as Price action reversal patterns, If I were trading other pattern than H&S the H&S in M30 for example would be a signal for me telling me it worth to take a trade amounts others trading methods.
Headshoulders
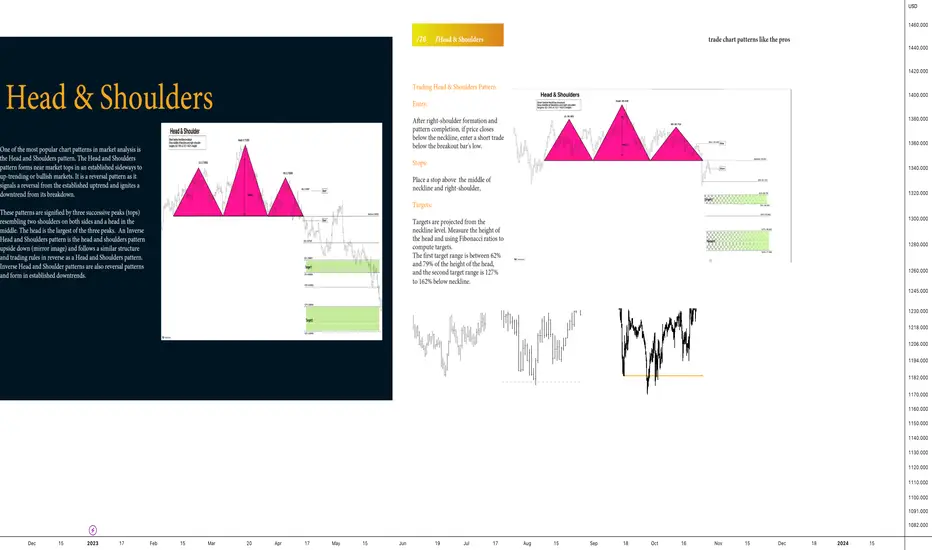
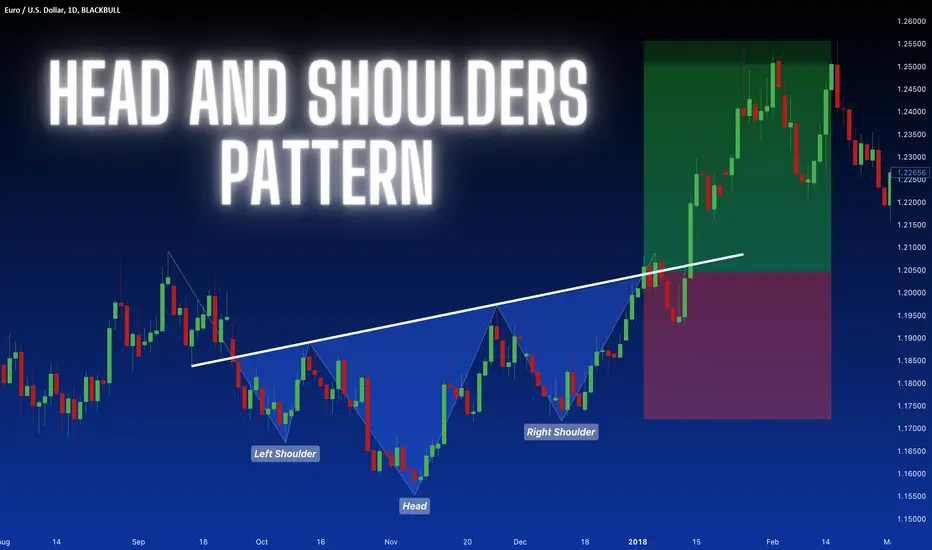
HEAD AND SHOULDERS PATTERN - TRADING GUIDE Head and Shoulders pattern
This lesson will cover the following
What is a “Head and Shoulders” formation?
How can it be confirmed?
How can it be traded?
The Head and Shoulders pattern forms after an uptrend, and if confirmed, marks a trend reversal. The opposite pattern, the Inverse Head and Shoulders, therefore forms after a downtrend and marks the end of the downward price movement.
As you can guess by its name, the Head and Shoulders pattern consists of three peaks – a left shoulder, a head, and a right shoulder. The head should be the highest and the two shoulders should be at least relatively of equal height. As the price corrects from each peak, the lows retreat to form the so-called neckline, which is later used for confirming the pattern. Here is what an H&S pattern looks like.
Other key elements of this pattern and its trade process are the breakouts, protective stops, profit target, and volume, which is used as an additional tool to confirm the trend reversal. So here is how you identify the Head and Shoulders pattern and how its individual components are characterized.
Formation and confirmation
In order to have a trend reversal pattern, you definitely need a trending market. Let's talk about the first model of H&S, the Inverse or Reversal will have the same methodology but exactly in the opposite way.
While prices are trending up, our future patterns left shoulder forms as a peak, which marks the high of the current trend. For the shoulder to be formed, the price then needs to correct down, retreating to a low, which is usually above or at the trend line, thus, keeping the uptrend still in force. This low marks the first point used to determine where the neckline stands.
Afterward, a new higher peak begins to form, stemming from the left shoulder low, which is our pattern head. As the market makes a higher high (the head), it then corrects back and usually, this is the point where the upward trend is penetrated, thus signaling a shift in momentum and a possible Head and Shoulders pattern.
The second low that is touched after the retreat from the heads peak is the other point used to build the neckline, which is basically a line drawn through the two lows.
The subsequent rebound from the second low forms the third peak – the right shoulder. It should be lower than the head and overall match the height of the left shoulder (keep in mind that exact matches rarely occur). It is also preferable that the two shoulders have required relatively the same amount of time to form as this would make the pattern stronger.
In order for the Head and Shoulders pattern to be confirmed, the retreat from the third peak (the right shoulder) should penetrate the neckline and a candle should close below it.
The neckline itself should be horizontal in the perfect case scenario, but that rarely happens. Instead, most often it is sloping up or down and that is of significance as well – a downward-sloping neckline is more bearish than an upward-sloping one.
Volume
As mentioned above, volume plays a key role as a confirmation tool and can be measured via indicators or by just analyzing its levels. Presumably, volume during the left shoulder advance should be higher than during the subsequent one, because as the head hits a higher high on the base of declining volume, this serves as an early signal for a possible reverse. This, however, does not happen every time.
The next step of confirmation comes when volume increases during the decline from the head's peak and the last nail in the coffin are when volume gains further during the right shoulder's decline.
Trading the pattern, stops and profit targets
We said earlier that the Head and Shoulders pattern is deemed confirmed if the right shoulder's decline penetrates through the neckline and a candle closes below it. As soon as that happens and you are reassured that it is not a false breakout, you can enter into a short position. However, as you already know, no trading decisions should be made on the go, i.e. you need to have predetermined where your protective stop is going to stand and what your profit target is.
Protective stop
There are two common places where you can place your stop loss. The first one, which is more conservative, is right above the peak of the head, while a more standard position is right beyond the right shoulder. You can see those visualized in the following screenshot.
The second option makes more sense because if the breakout through the neckline actually fails and the price rebounds back with such momentum that it rises beyond the right shoulder, then the whole pattern is flawed and you definitely do not need to wait for it to exceed the head as well. Besides, such a loose stop significantly increases the risk and reduces the risk/reward ratio, thus, reducing this pattern's trading appeal.
Profit target
The most common and often advised profit target is the distance (number of pips) between the head's peak and the neckline. Having estimated that distance, you then need to subtract it from the neckline, just like in the screenshot below.
And how does that translate in terms of risk/reward ratio? If the breakout confirmation (the close beyond the neckline) appears very close to the neckline itself, and we enter into a short position there, we generally have a 1:1 risk-to-reward proportion, if we use a conservative protective stop. Why?
Since our profit target is the distance between the heads peak and the neckline, if we decide to use the conservative option for a protective stop, then we will have the same distance as a loss limit, thus, reducing our risk-to-reward ratio to 1:1.
This is why, in order to improve that ratio, most experienced traders place their protective stops more often above the right shoulders peak, given that they use the head-to-neckline profit target.
However, keep in mind that this price distance should serve as a rough target, because things are usually not that straightforward and other factors such as previous support levels, crossing mid-term and long-term moving averages, etc. must be taken into consideration as well.
Two ways to trade the Head and Shoulders Pattern
There are generally two ways to trade this pattern, depending on how it plays out. The first one we've already mentioned. As soon as a candle closes below the neckline as a sign of confirmation, you enter into a short position with the respective profit target and protective stop described above.
Now for the second way to trade the H&S formation. In this case, we have a pullback after the neckline penetration, which, once support, now acts as a resistance level. This time we need to go short once the price pulls back and tests the neckline as resistance. As soon as it rebounds from the neckline, we enter into a short position, using the same principle for placing the protective stop and aiming for the same profit as in the first scenario. Here is what this would look like.
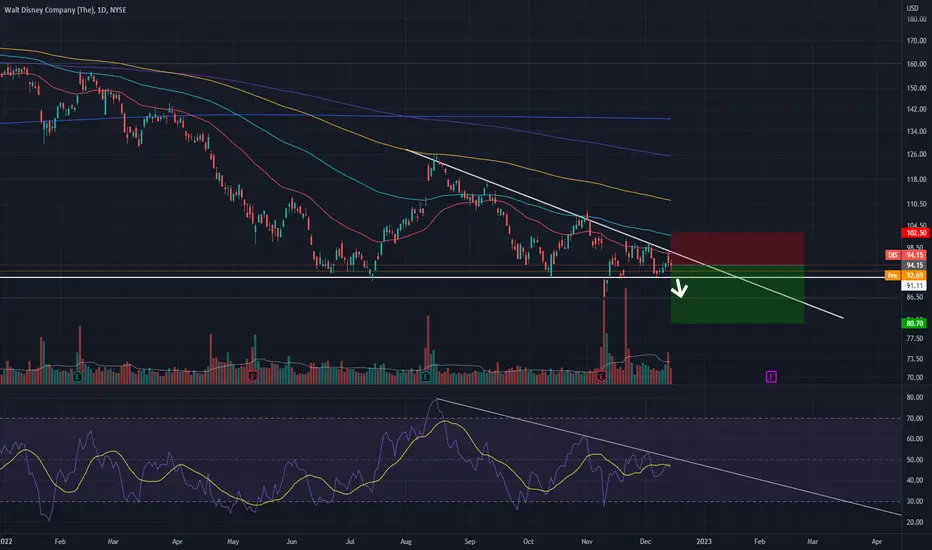
Disney DIS Short - Descending Triangle/Head and ShouldersDisney DIS Short - Descending Triangle/Head and Shoulders
Disney preparing to break down from a descending triangle . Expecting low $80s price range.
Longer term there's a clear Head and Shoulders pattern that would break down if the descending triangle also breaks
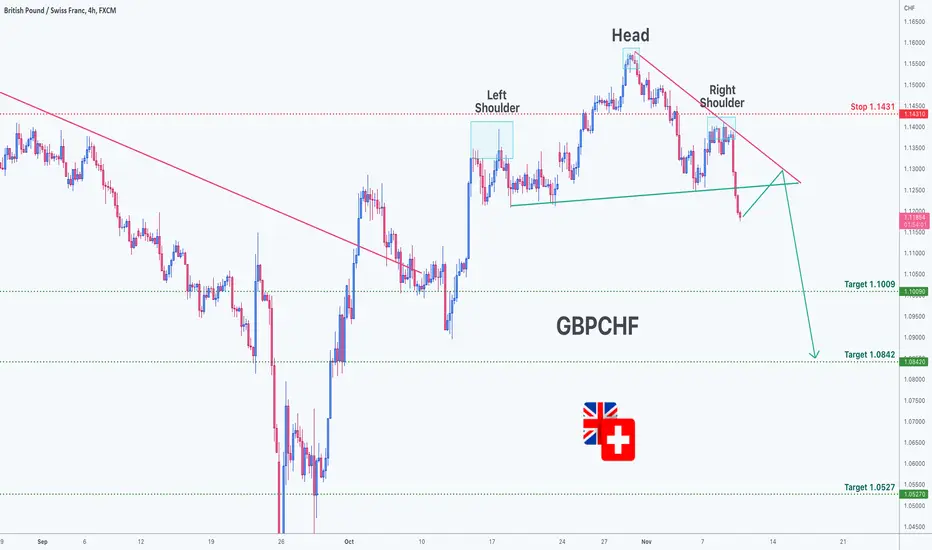
Head and Shoulders pattern on GBPCHFBased on technical factors there is a Short position in :
📊 GBPCHF
🔴 Short Now 1.1841
🧯 Stop loss 1.1431
🏹 Target 1 1.1009
🏹 Target 2 1.0842
🏹 Target 3 1.0527
💸RISK : 1%
We hope it is profitable for you ❤️
Please support our activity with your likes👍 and comments📝


Nat Gas ShortHead and Shoulders short breakout.
3.3 risk ratio.
Would be nice for humanity if gas prices drop.
More than a trade, a potential economic indicator.

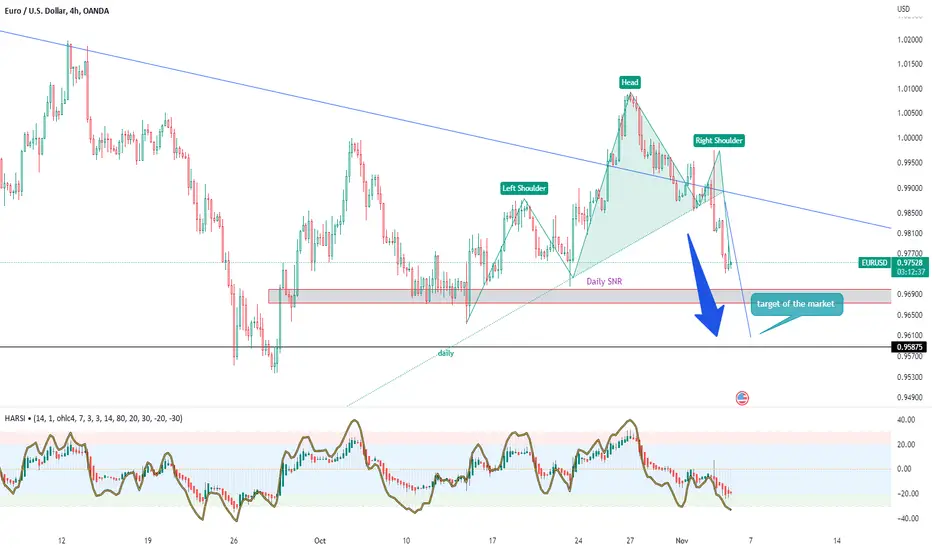
head and shoulder on eurusd 4h price is declining after completing head and shoulder pattern . market target is defined in the chart . plan your trade direction acording to analysis ..
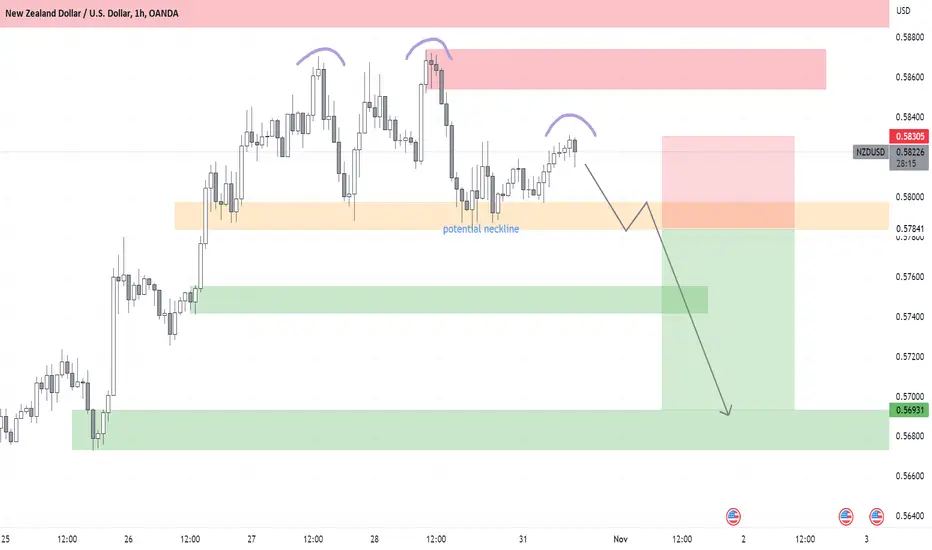
NZDUSD H1 potential short positionthere is a potential head and shoulders pattern,
if right shoulder is formed, price breakout neckline and backtest(orange zone)
I'll consider placing bearish order but only if bearish signal appears,
could be bearish engulfing, evening star... so on
Entry: organeorange
SL: right shoulder's H
TP: upper edge of demand zone which is at 0.5693
all are personal opinions, not investment advice!
H&S on ETH/BTCThe next H&S pattern may not be as obvious.
Just kidding.
In more seriousness, here are some things I'm considering when looking at Ethereum's relationship with the rest of cryptocurrency:
Cultural influence: consider the significance of NFTs, DeFi, and other applications being launched from Ethereum. The ICO craze that characterized the 2017 bull run in crypto was primarily fulled by Ethereum, and ideas surrounding capabilities of smart contracts. (Yes, these things are not exclusive to Ethereum, but many began on and continue to live/thrive on Ethereum.)
The Ethereum remains the most secure and decentralized of all smart contract networks. Furthermore, the amount of ETH controlled by central groups is smaller than all other chains.
Ethereum continues to make progress toward upgrade goals.
The plethora and growth of layer-2 platforms, scaling the speed and efficiency of the Ethereum network is more significant than all other chains.
The previous crypto winter (2018-2020) was characterized with strong growth in bitcoin dominance. However, the drop visible in this chart, has not been as low and long as expected by many traders - perhaps this is jut the beginning, of a decline in Ethereum's value relative to bitcoin. However, I speculate that the future bitcoin dominance has more to do with macro economic headwinds/tailwinds (how asset allocators understand any difference between Ethereum and bitcoin with respect to it's base utility - store of value, vs base economic unity of a thriving ecosystem of developing internet of value ) than with the base utility of the network.
Speculative take: Ethereum has likely entered into a phase of adoption among internet applications/companies, etc, that will cement it's continued adoption - this expansion could be anticipated to accelerate as Ethereum transitions to proof of stake (PoS) and is thus more computationally (energy) efficient for securing the blockchain. Advantages of PoS and PoW (Proof of Work) have merit from economic and computer science considerations, but far beyond what I'm sharing here.

One more SPOOK for Halloween?Looks like an inverse H&S Potentially forming here.. into downward diag resistance..
Likely another spook for Halloween, to form the right shoulder, then a thrust up for November.. "Upvember"

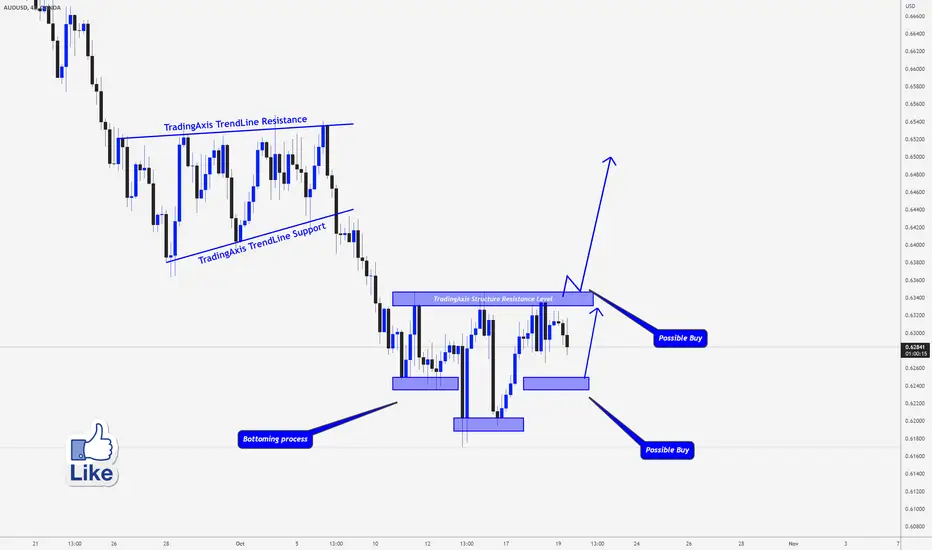
AUDUSD > Possible Bottoming Here, the Trend May Shift Soon!!Analysis of #AUDUSD
The AUDUSD has formed double bottom near 0.6200, we kind of have a head and shoulders pattern developing now, we can be aggressive and enter a buy trade at the second shoulder if we get a reversal pattern at the lower time frame.
the other way we can trade this market is to wait until we have a confirmed breakout of the neckline resistance and then start trading the buy side if we get a valid setup that meets the rules
Thanks for your continued support!

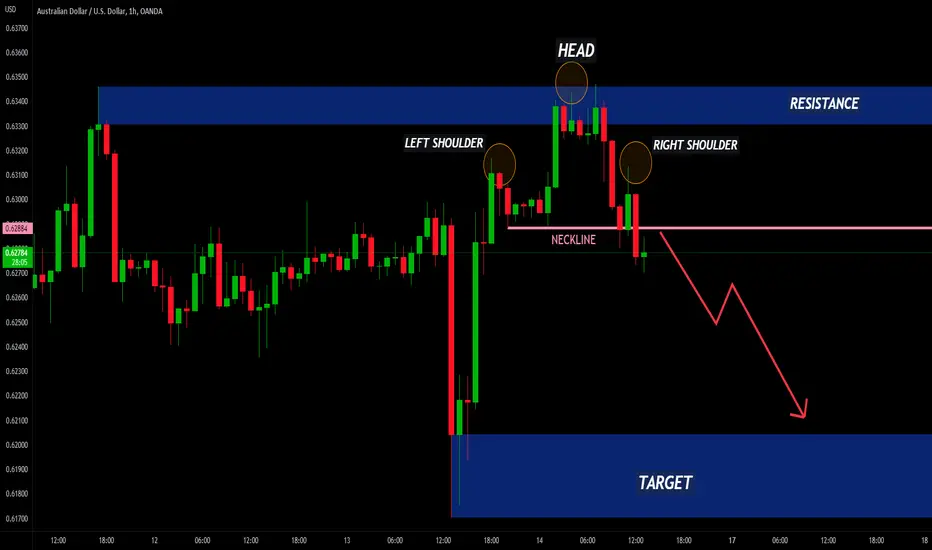
AUDUSD - HEAD AND SHOULDERS 📉The AUDUSD price is in Bearish Head And Shoulders Pattern 🧐
the Neckline is broken ✔
so, i predict a bearish move 📉 im waiting for a pullback 📈
TARGET: 0.62051 🎯
...
if you agreed with this IDEA, please leave a LIKE, SUBSCRIBE or COMMENT!
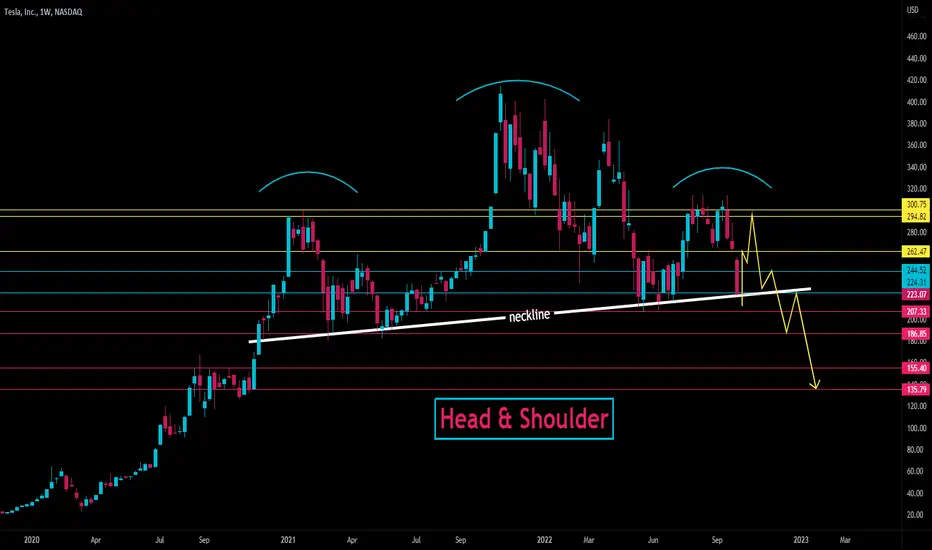
TESLA - $TSLA - Head & Shoulder - Distribution almost OVER!!!!!When great trees fall, rocks on distant hills shudder, lions hunker down in tall grasses, and even elephants lumber after safety.
Soon Tesla will move from the head & shoulder -- down to its KNEES and that is when we will execute our entry for a long hold.
Sorry Elon, your Ponzi gig is up, you can't produce because you don't have materials and the ones that exist are over priced just like your vehicles.
Your stuck boo, your in a corner, stalemate, king cannot MOVE!
I presented this head & shoulder pattern on $TSLA back in July, before the Right Shoulder was complete and now we are on to the final stages.
I see a bounce occurring before heading lower.
On Monday - US holiday - we should expect lower volume and usually that means a sell off.
This view is on a weekly timeframe. I believe Tesla will wick below the neckline as it has in the past and then squeeze up and fill the GAP to $262.47 (1st target).
If the S&P500 shows strength mid October, prior to OPEX options expiry date, Tesla may keep trekking up the the second target which is in the $290 range before breaking the neckline.
Head and shoulder criteria:
1. Buying volume is diminishing and showed most strength on the left shoulder.
2. The head is much higher then the left shoulder.
3. The neckline fits the description of a proper head and shoulder pattern.
GOOODLUCK TRADERS!
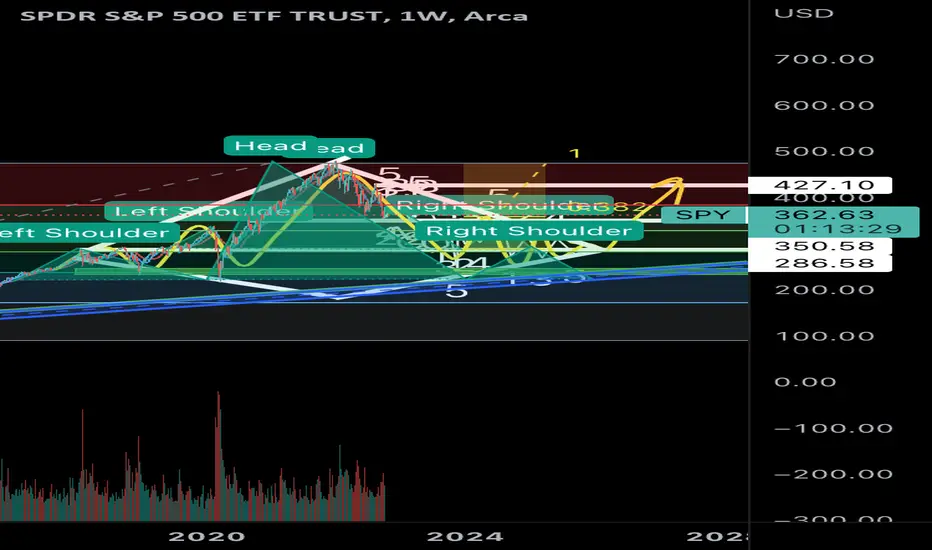
$SPY - diamond top - head and shoulders Spy is in process of creating a mega diamond top or head and shoulders. Consider waiting for each rally to complete and enter short for the next two years.
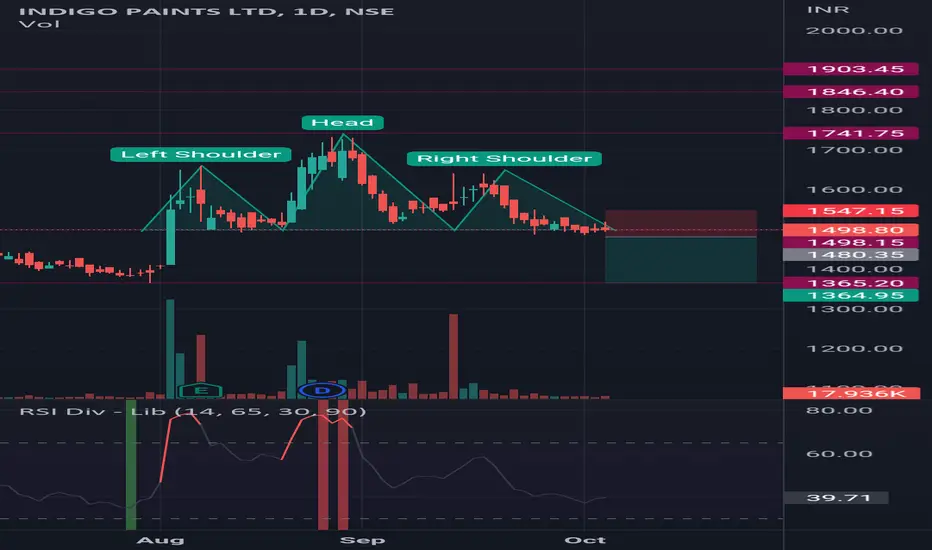
Bearish head and shoulder In Indigo 🎨 A very good bearish head&shoulder made in the 1 day chart of Indigo paints soo its a tym to short it or not buy it .
Sell Indigo paints below 1479
Target 1444 1395 1365 1350
Sl 1550
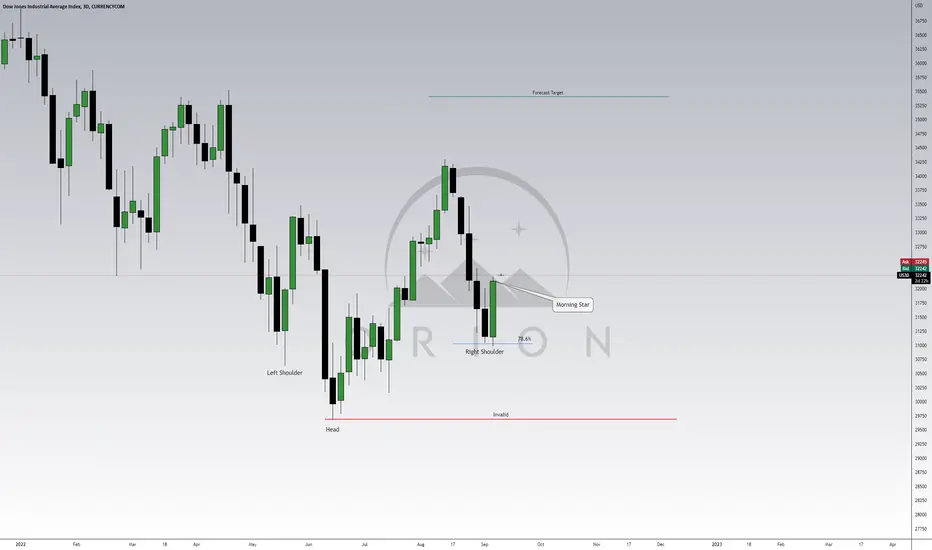
US30 Forecast: Potential For A ReversalWe've had a very strong rally last week after Powell announced that interest rates is the highest its ever been in the last 40 years ! With this fundamental fact it would be easy to call that we should see US30 in a downtrend for quite sometime. The only thing is ...we need the price action to tell us when it will happen. Clearly, it was not last week ! So the question is, are we done with last weeks bullish rally ? well... looking at this 3 day timeframe, we can see that there is a visible inverse head and shoulders that could be telling us to expect more bullish momentum before this expected plummet. If this pattern becomes invalid then we know where the market is going for sure. Safe trading !
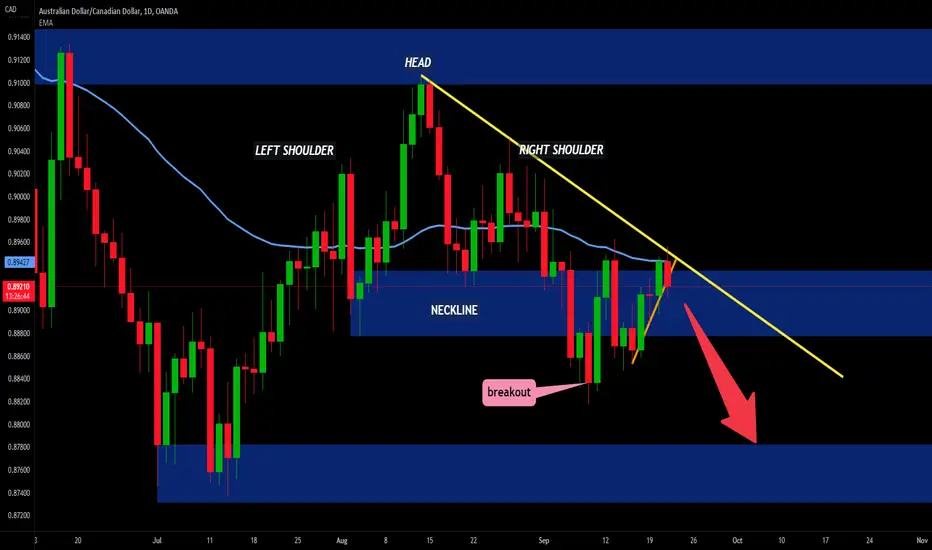
AUDCAD - HEAD AND SHOULDERS 📉The AUDCAD price is in Bearish Head And Shoulders Pattern 🧐
the Neckline is broken ✔
so, i predict a bearish move 📉
TARGET: 0.87824 🎯
...
if you agreed with this IDEA, please leave a LIKE, SUBSCRIBE or COMMENT!
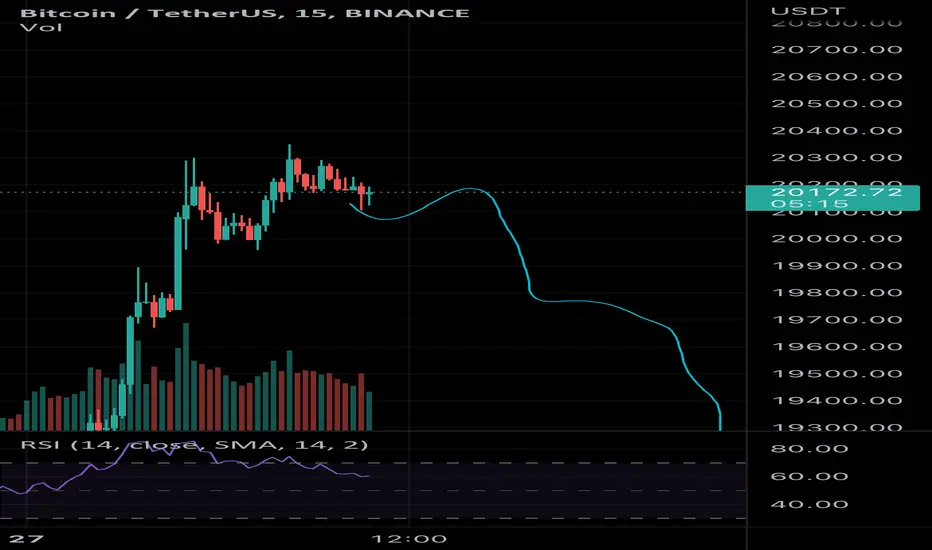
BITCOIN - Bull trapBitcoin printed long wick, bull trap behavior. Good risk/reward entry on H&S continuation pattern.
IQ has always and will always, get all the praise; but discipline gets the job done ~Mark Ritchie
Lose like a pro and keep trading, or lose like a novice and quit ~Mark Ritchie
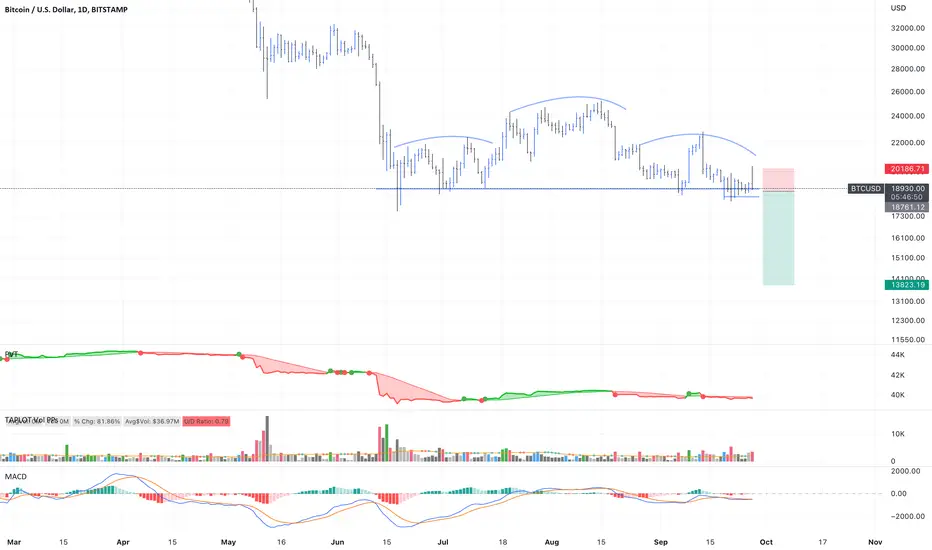
Lack of buyersAround this area there is a lack of buyers and we dont have any positive news to continue the trend on. This might be a H&S.
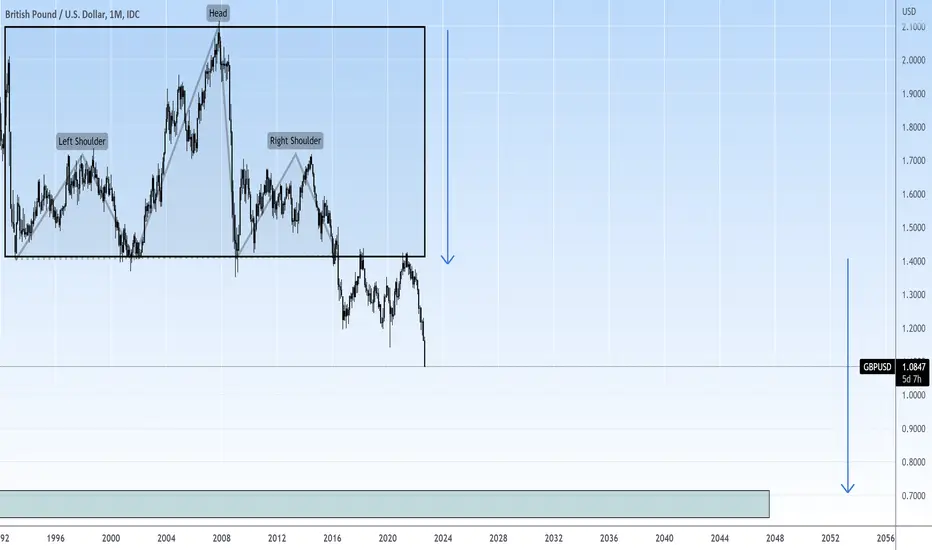
GBPUSD - Long term Price Crash - H&SChart show's the Head and Shoulder pattern and the long term target.
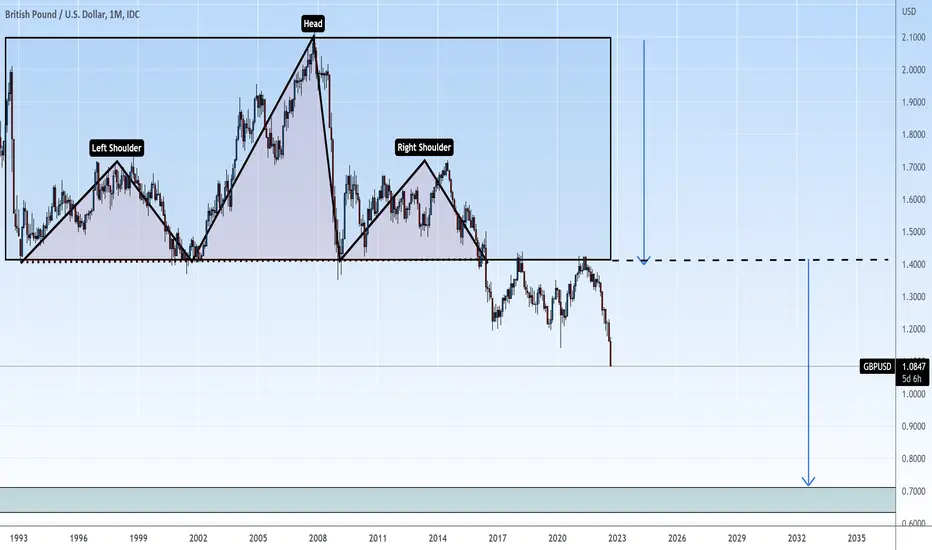
GBPUSD - Price Crash Head and ShoulderChart show's the possibility of the Head and shoulder pattern and the long term target.