WC: 23.59 Target: 1800-2400 MOASS: 47k-100K: PROFITI am a trader...I have one goal at the end of the day: MAKE A PROFIT
This will be my final post on Gamestop as I am now dedicating ALL of my time to Macro Market Coverage...
I FIRMLY believe that there is a high potential for markets to turn SIGNIFICANTLY LOWER over the next year and plan to show people how to trade a bear market profitably and not get absolutely wrecked
As part of my Macro Coverage I will be covering stocks that have high potential to run so I will be dropping updates on GME here and there as it runs
Ive posted every trading day (and the weekends) on Gamestop for well over a year
I was around for the original squeeze and I will be around if (no guarantees in markets as I always say) it squeezes again
Ok lets get to what you want to know:
20 Week Cycle has NOT been invalidated as far as im concerned
06/09 did see big changes but just havent seen the price improvement...yet
I think we see the price improvement start MIDDLE to END of Aug and will ramp up thru Sep/Oct
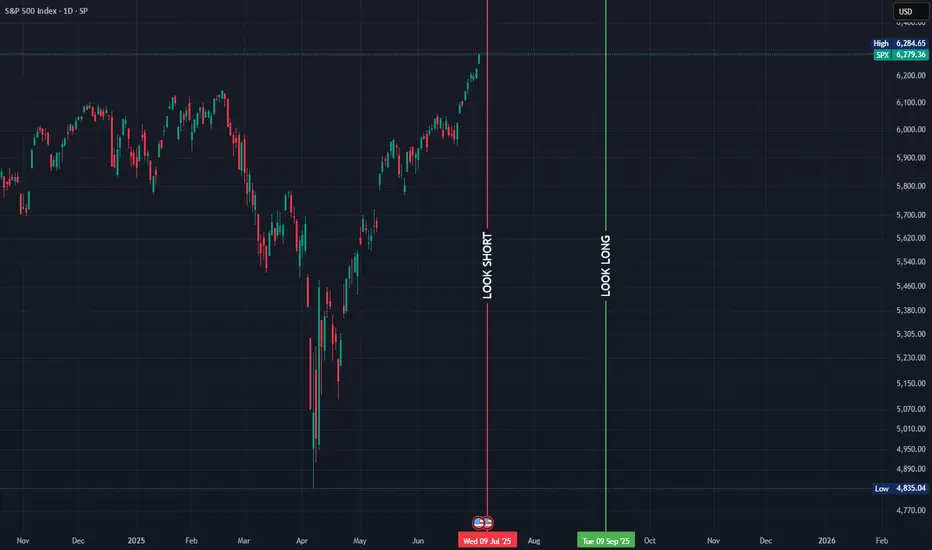
I have SPX dropping to 5100-5400 over the next couple months...that will most likely drag GME down a bit but expect 21.54 to be a solid place to position trades
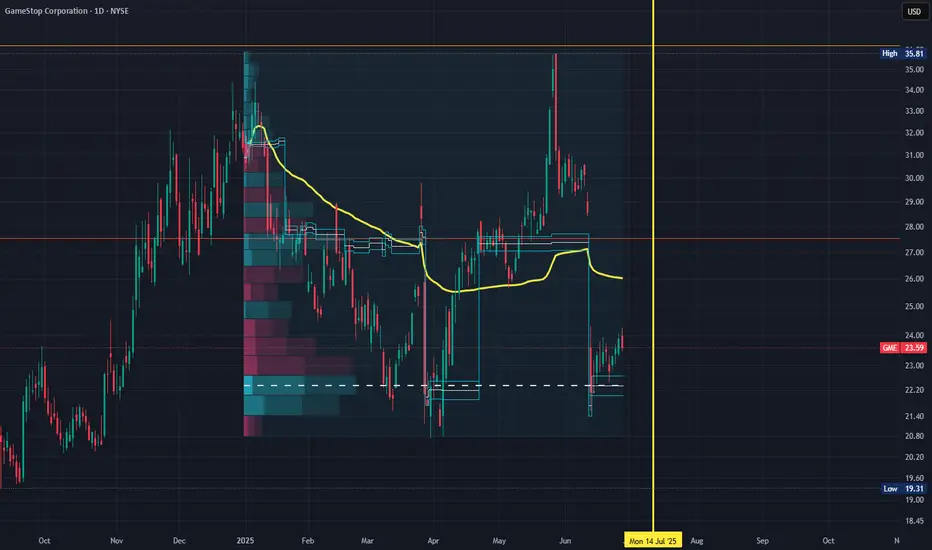
If/When GME moves higher the FIBS ARE STILL YOUR GUIDE
Draw an Anchored VWAP from the 21.54 low...If GME breaks 21.54 draw another Anchored VWAP from wherever it bottoms...those two VWAPS will be the most powerful things you can put on your chart to track GME trend
TRADE WHAT YOU SEE...NOT WHAT YOU HOPE FOR
One last word on Roaring Kitty:
I do believe he is lurking and will be back...my guess as to when? Flip Mode 09/07
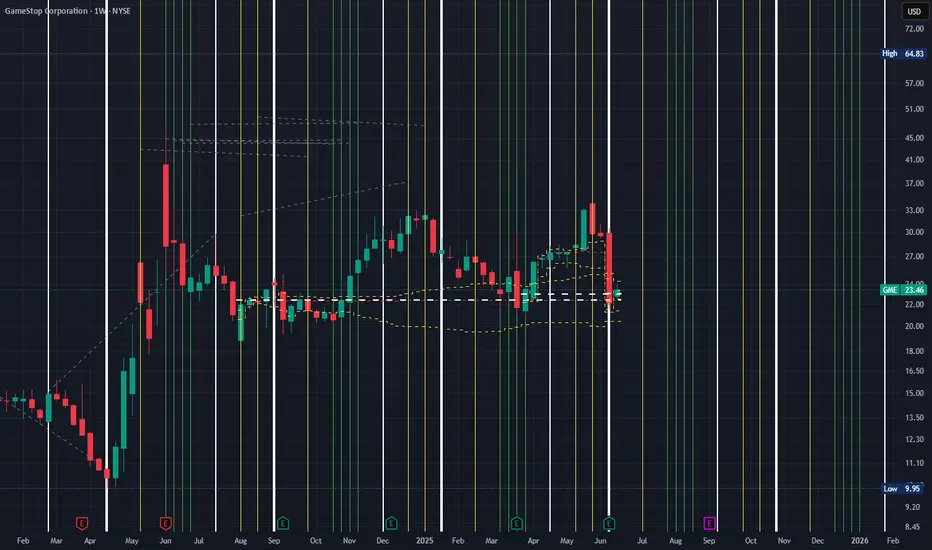
Histograms are not aligned yet and as you see price is choppy
From a 20 Week Cycle perspective it appears price will rise when it reaches the GREEN VERTICAL LINES
Still think this is the best interpretation ever laid out on what Roaring Kitty is doing..I obviously dont have it completely figured out though
Good Trading To You All!!!
P.S. the YEARLY VWAP is at 26....thats the likely LAUNCH point for price
Heartbeattrading
$100 to $1k to $10k to $100k: TRADING MASTERCLASSHow I approach trading:
Trading is a mostly psychological endeavor
You will not WIN LONGTERM in trading until you WIN YOURSELF (i.e. master your emotions)
I use Technical Analysis to help me determine overall Market Direction and Entry/Exit points
I do not use ANY fundamental analysis in my trading
I use Elliott Wave Theory to understand MARKET STRUCTURE
I use a combination of Anchored Volume Weighted Average Price (AVWAP), Fixed Range Volume Point of Control (VPOC) and custom coded Momentum indicators to pinpoint Entry/Exit points
Risk Management:
I will generally aim for 2%-5% percent stop loss but price structure will dictate as well
Position sizing will be fluid
Targets will be fluid but will generally target key Fib Extensions, VWAPs or VPOCs..or a combination of all of the above
Starting Account Size:
$100
Goal:
Grow a small $100 account to $1k then $10k then $100k
Every trade will be public...wins and losses
I will be looking to make my first trade(s) shortly and will show Entry level, Stop Loss and Target
NONE OF THIS CONSTITUTES FINANCIAL ADVICE
WC: 23.59 Target: 1800-2400 MOASS: 47k-100K: Waves of MomentumYes I still believe the 20 week cycle theory is still valid...lets get that out the way
Volatile stocks like GME are driven by two things mainly: SENTIMENT and the OPTIONS CHAIN
So what I plan to focus on from here on out is MOMENTUM
What I have been focused on behind the scenes is a better way to determine WHEN momentum is picking up so that I can strategically layer in and out with the goal of growing my position over time
I've developed a system that I will be using on GME and all stocks from this point on
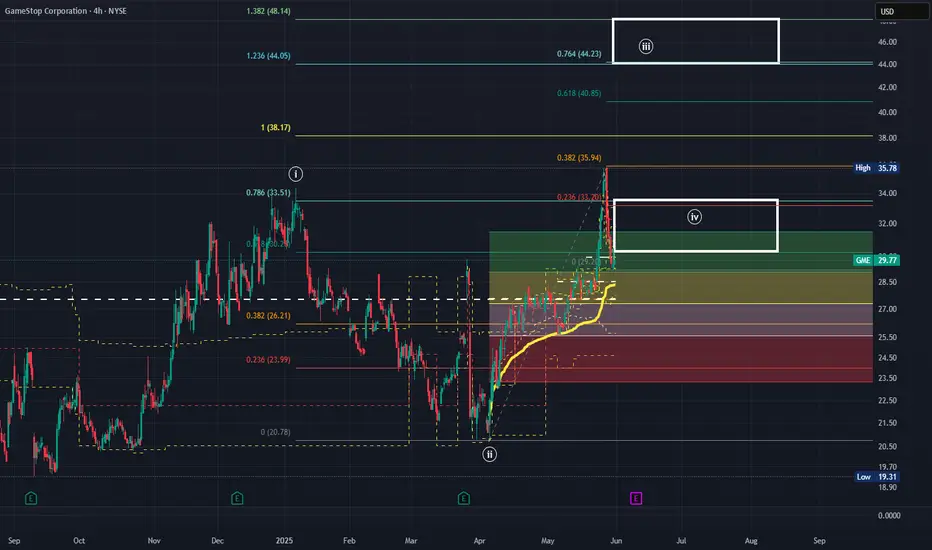
Every chart for me starts with understanding the general macro Elliott Wave structure which includes drawing a main macro fib
That main macro fib gives me main longer term targets for the trade..remember each fib is a target for me but im primarily focused on the 0.618, 1.00 and 1.618 fib extensions..so focusing on the chart since the move from last year the next MAJOR FIB TARGET for me is the 0.618 at appox the 56 level
Institutional Trading houses are forward looking and develop a trading thesis for the year that they execute and manage...this process resets every year
So with that in mind I want to understand 2 things each trading year: Whats the VWAP for the year? and what level is everyone at in relation to where they were (aka whats the Volume Point of Control (VPOC))?
Why? Because those tell us where EVERYONE is in relation to VWAP...the direction price moves away from VWAP tells us what the major players intentions are..and i want to FOLLOW THE MONEY
But in order for price to move away from VWAP..MOMENTUM has to BUILD and SUSTAIN
There are many ways to measure momentum on a chart but the way that works best for me is to focus on the RATE OF CHANGE (ROC) of PRICE & VOLUME
As mentioned last week Ive developed and tuned a custom indicator to help me intimately understand ROC
Im focusing on four time frames: Yearly, 3 Month, 3 Week and 3 Day
Alignment= same timeframe color and position in relation to zero line
Alignment = Strength= look to BUY
Not in alignment= Weakness= look to SELL
NOTE: This view is what you will primarily see posted going forward as this is what im using on ALL stocks to trade in and out
Cant wait to see how this chart looks by year end :)
GOOD TRADING TO YOU ALL!!!
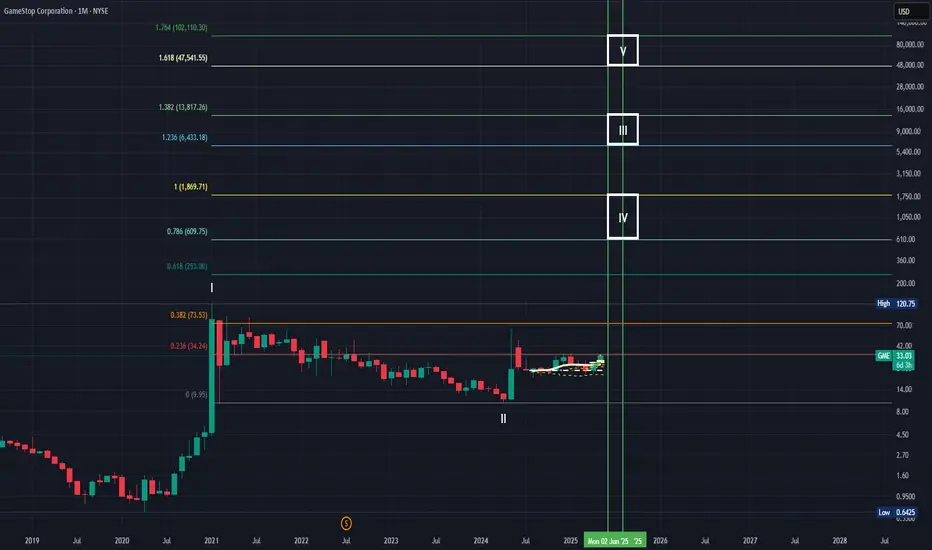
WC: 23.46 Target: 1800-2400 MOASS: 47k-100K: Cycles & MomentumLet me start by saying that I still do not think the 20 Week Cycle Theory has been invalidated
We are only a couple weeks in on what is again a 20 WEEK CYCLE
With that in mind based on the cycle view displayed, at this point, I have to assume this cycle will be similar to the last cycles in that the price appreciation should take place aligned with the GREEN vertical lines...which corresponds with the end of July/ beginning of Aug timeframe
The question is what does the price action look like in the meantime?
A lot of that depends on what the broader market looks like and what levels hold on GME
I do not have a crystal ball
For what its worth I have additional buys set to trigger at 21.50 and 22 with a tight stop loss in case of any moves lower
Ok now lets talk momentum
GME is obviously vary volatile and extremely beholden to the options market
I have been working for months behind the scenes on fine tuning my custom indicators to provide a stable view of increases/ decreases in momentum..and have now reached that point
On the below indicator view , generally speaking, if all 3 Histograms are GREEN and ABOVE the ZERO LINE then price is showing HIGH BULLISH MOMENTUM...and vice versa for Selling Momentum
So with that said as you see GME is still showing a lot of weakness and until we see the bullishness conditions mentioned above I expect price action to be somewhat muted
GOOD TRADING TO YOU ALL
WC: 22.14 Target: 1800-2400 MOASS: 47k-100K: What Now?As I said in the end of day update yesterday the WEEK OF 06/09 was a doozy.
As part of my #GME20WeekCycle theory that week is significant as it is one of the few dates The Cat specifically "gave us" in his tweets...and serves as significant "line in the sand" from which we should look for significant price improvement (covered in the last 3 video updates) (at least thats my theory)
I expected positive price improvement of course this week...but we got the opposite because of the Convertible offering
Along with that we also got TONS OF VOLATILITY AND VOLUME..which I also expected
So what does the mean as far as the cycle theory goes?
This doesnt change anything for me because I never thought or said that we HAVE to get price improvement during that week..its just what I expected because I anticipated BUY VOLUME to come in
I also was CLEAR in the videos that its not just about the day or week of...its about the WHOLE CYCLE
I specifically talked in last video and in the LIVE on 06/09 about adjusting my expectations and to stop "looking for it all" to happen at one time or any given time..
So again I got 2 out the 3 things I was looking for this week: I got Volume and Volatility..just no Positive Price improvement...YET :)
Looking forward I expect the same thing to transpire as the last Convertible offering: Significant Positive Price Improvement
Last time we saw a 72% run from April low to May high
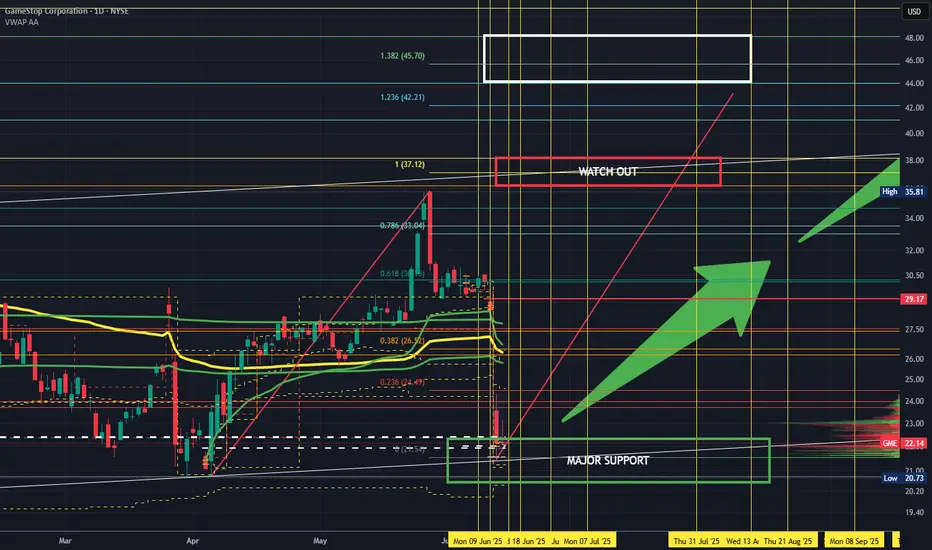
This time I expect 100% move before we see a significant retracement BUT we do need to watch the 38 LEVEL carefully as its a PRIME AREA for retracement due to the presence of overlapping 1.00 extensions....yeah definitely need to watch that area
And yes we are still in a MASSIVE diagonal pattern so look for the ABCs and continue to expect DEEP RETRACEMENTS of ANY significant moves up
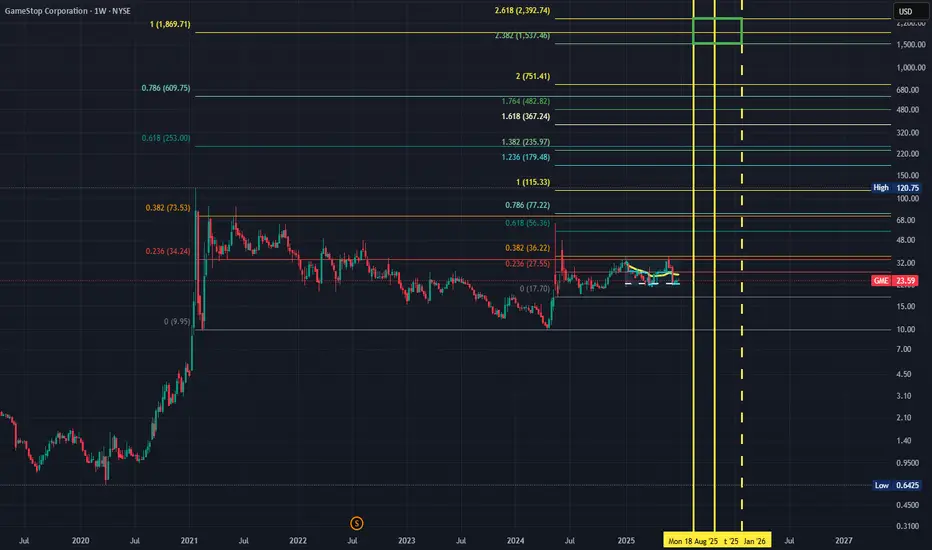
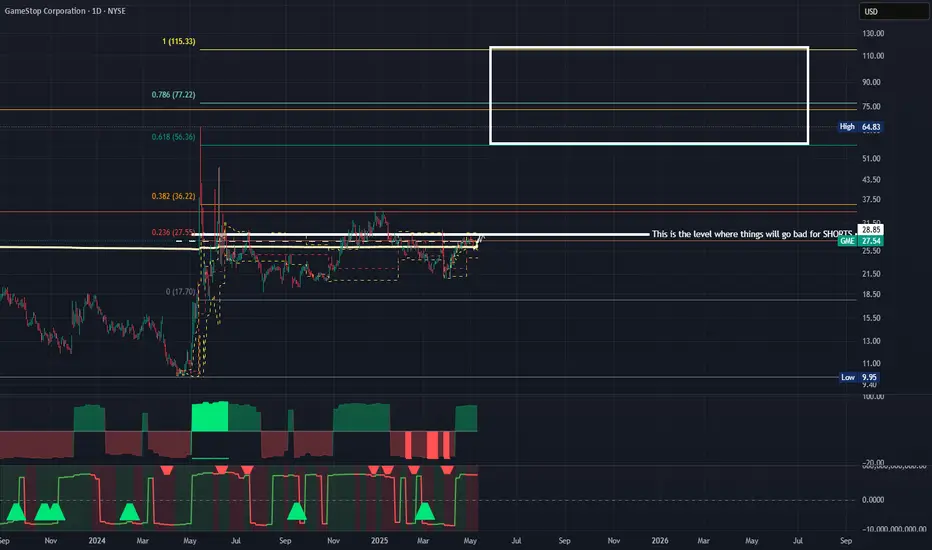
GME DECODED
Expanded View of Cycles
Fib Focused Chart. Yellow Vertical lines are FUTURE POTENTIAL PRICE PIVOTS (I absolutely believe these to be powerful)
Above EACH horizontal white line is a Zone of Low Liquidity. There is nothing above 32 but there is also NOW NOTHING ABOVE 22. Once price gets going higher this becomes a VERY REAL PROBLEM FOR SHORTS i.e. why we are getting EPIC SHORTING between 32-34
Next Week. Short Term levels im watching
GOOD TRADING TO YOU ALL!!!
WC: 29.58 Target: 1800-2400 MOASS: 47k-100K: Week Of 06/09Ok this is my last video on Gamestop
You will see less frequent posts going forward and they will be at the MACRO level and focused almost exclusively on the daily charts
Its been a ride covering this over the past year or so
True to my posting intention (I'm only here to help people trade better) this video is educational in nature
Its not hopium fueled at all...this is me, one last time...TEACHING YOU HOW TO FISH
First half of the video is setting your charts up for the squeeze
Second half of the video is showing you some new stuff around the 20 Week Cycle that you havent seen before
But yeah..no hype...just TA and some rambling..because as my Tagline on my X profile says i'm:
"Just a guy who likes to draw Elliott Waves on stock charts and ramble on about markets."
GOOD TRADING TO YOU ALL...SEE YOU ON THE OTHER SIDE!

WC: 29.80 Target: 1800-2400 MOASS: 47k-100K: Time to FOCUSAs I reminded everyone in the youtube video earlier this week we are dealing with a large Diagonal structure in GME
There is nothing unusual AT ALL about the decline we saw this week
That is the nature of diagonals
Now we seem to be bottoming again around 30 which if that continues should see price rise to the 38 level then ultimately the 45 region
I also gave you 2 days to watch leading up to and during the week of 06/09:
06/05 and 06/11
Expecting to again see strong volume after those dates
I have no idea obviously but I would also expect The Cat to make an appearance around 06/09..probably on 06/08 if his Sunday posting pattern continues..but who really knows
At the end of the day im just watching FIBS, VOLUME and Indicator Confluence/Divergence
I'll leave the hopium to someone else...i'm strictly business from here out
GOOD TRADING TO YOU ALL
FNGR: You Had My Curiosity, Now You Have My AttentionI have received a ton of requests to provide a chart on FNGR
I'll keep this simple:
Yes, based on the structure this has HIGH potential for a massive break higher aka squeeze
Every Fib is a target but as I mentioned in my latest GME video on targets I ALWAYS use the 1.00 Extension as my first and main target
Lets see if it happens
GOOD TRADING TO YOU

WC: 33.03 Target: 1800-2400 MOASS: 47k-100K: TICK TOCKIt would be easy to be really hyperbolic with my tone and words right based on the latest price action...but I'm NOT going to be
I am a TRADER and in order to extract profit consistently over time its important to manage the PSYCHOLOGICAL aspect of trading well i.e. your emotions
That's why I going to focus on only the TECHNICALS because THAT, for me, is what's going to ensure that I see as much PROFIT as possible from this trade:
TESLA: A Good Trade for Bulls AND BearsTesla has an Elon problem aka a SENTIMENT problem
I am a 100% Technical Trader
I am an avid believer in Elliott Wave Theory and Socionomics
From those perspectives its clear to me that Tesla is in trouble...long term
Tesla went from essentially a meme like stock to a media and Institutional darling
The meteoric rise in the stock was largely because of belief in Elon..the person
Yes his companies have done some pretty amazing things..but if we are honest there are tons of failed promises in their past and now we are seeing competitors start to really make ground
This is showing up in vehicle pricing and units delivered..both trending down
The problem Tesla stock truly has though is that soooooo much of the company sentiment is tied into a belief in Elon- the person..versus the fundamentals of the company and their actual products (cmon we all know LIDAR is better smh)
As his popularity wains... so will Tesla
So with that said the charts are setup to provide opportunities for BOTH BULLS and BEARS over the next few years.
The chart show really clean places to take and hedge positions... but long term BULLS need to be keely aware of the "Trouble" line because if and when it breaks Tesla will be in serious trouble

TLT Is Yelling at UsYou typically see a migration to TLT when people are looking for a safe haven from troubled markets
I posted about TLT previously and thought we were about to see a rush to the trade because of potential market weakness
Well as we know this Bull market continued to show legs and subsequently TLT has been grounded on the launching pad
The market is yet again showing classic signs of topping
Are we saying that the market is about to crash? NO..not yet
What we are saying is that liquidity is leaving the equities markets in droves and TLT will most likely be a place where that liquidity finds a home
So pay close attention to TLT over the next 6 months because its going to tell you everything you need to know about this bull market

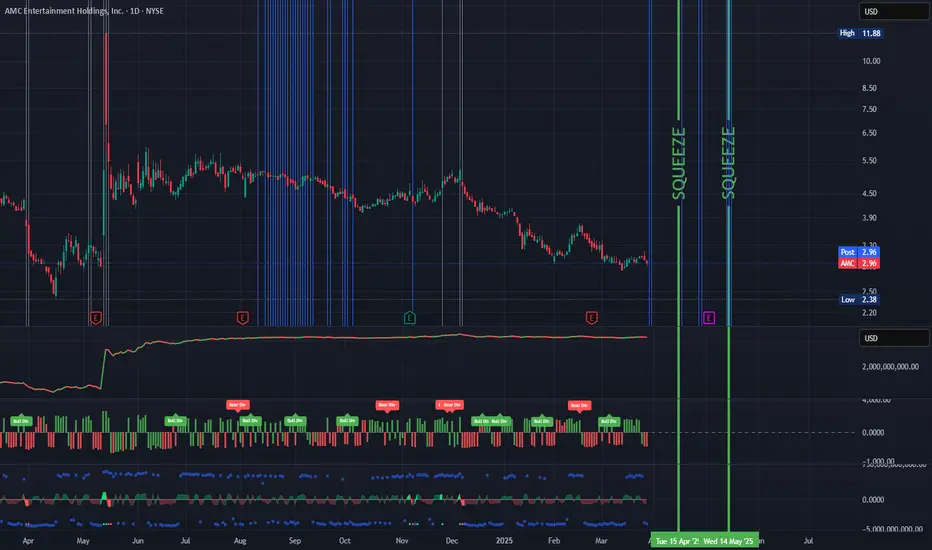
Squeeze Me: AMCI do not have a crystal ball
But what I do have is enough
Trade What You See..Not What You Hope For
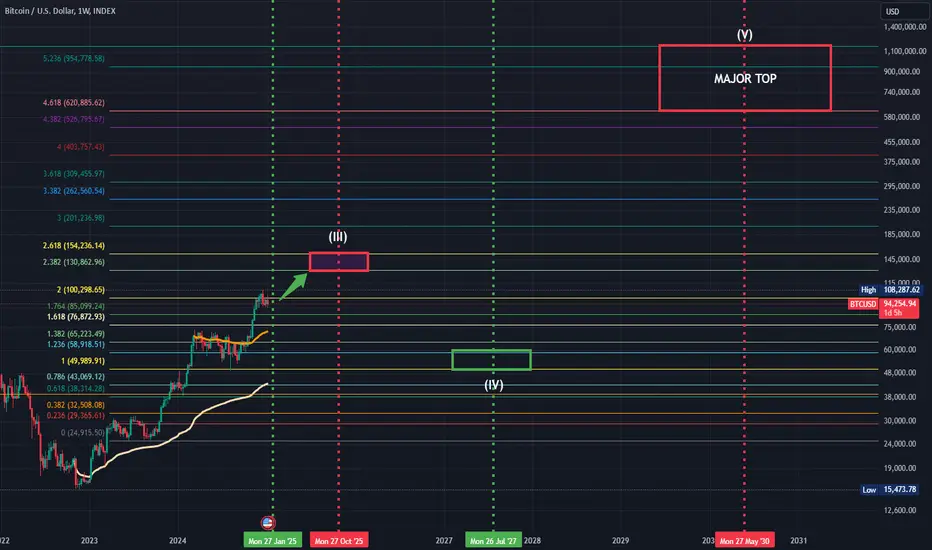
BITCOIN: $150k by Oct 2025...then PAINThe rise of Bitcoin and the crypto space as a whole has been one of the most fascinating parts of this last Bull Market run.
From a socioeconomic perspective the rise of speculative assets, including Bitcoin, often coincides with bull markets and economic cycles. These speculative booms tend to cluster near periods of excessive liquidity, investor euphoria, or the final stages of economic expansion.
Below are comparisons highlighting how Bitcoin's behavior aligns with previous speculative asset bubbles and economic cycles:
1. Bitcoin and the Dot-Com Bubble (1995-2000)
Similarities:
Speculation Driven by Innovation: The internet in the 1990s and blockchain technology in the 2010s both promised transformative potential.
Parabolic Price Action: Many dot-com stocks exhibited exponential price growth, similar to Bitcoin during its 2017 and 2021 bull runs.
Euphoria at the Peak: Both saw significant retail and institutional participation near the top.
Collapse: The NASDAQ dropped ~78% after 2000; Bitcoin saw >80% declines after 2017 and 2021 peaks.
Economic Context:
The dot-com bubble coincided with a strong economy, low unemployment, and expansive monetary policies before the Fed began raising rates in 1999.
2. Bitcoin and the Housing Bubble (2002-2007)
Similarities:
Access to Cheap Credit: Just as low-interest rates fueled the housing market, easy liquidity and ultra-low interest rates from 2008 onwards helped Bitcoin's rise.
Speculative Investments: Both periods saw retail investors flock to perceived high-return assets—real estate in the 2000s and cryptocurrencies in the 2010s/2020s.
FOMO and Leverage: Use of leverage amplified returns and risks in both markets.
Economic Context:
The housing bubble inflated during a period of economic growth and low rates, culminating in the 2008 financial crisis.
3. Bitcoin and Gold During the 1970s
Similarities:
Hedge Against Inflation: Bitcoin is often called "digital gold," much like gold was a refuge during the stagflation of the 1970s.
Speculative Mania: Gold's rise in the late 1970s was driven by fear of inflation and geopolitical instability, paralleling Bitcoin's role as a hedge during monetary expansion.
Economic Context:
Rising inflation, energy crises, and global uncertainty contributed to gold's rise, peaking in 1980. Bitcoin's 2021 peak coincided with fears of monetary debasement and high inflation.
4. Bitcoin and the Roaring Twenties Speculation (1920s)
Similarities:
Technological Innovation: The 1920s saw the rise of automobiles, radios, and electrification, much like blockchain innovations in the 2010s and 2020s.
Excessive Leverage: Margin trading drove speculative stock purchases in the 1920s, akin to the leverage seen in crypto markets during Bitcoin bull runs.
Economic Context:
An economic boom and loose monetary policies fueled the 1920s stock market until the 1929 crash.
5. Bitcoin and Oil During the Early 2000s
Similarities:
Scarcity Narrative: Oil's rise during the 2000s due to geopolitical concerns and growing demand mirrors Bitcoin's scarcity-driven valuation.
Speculative Price Movements: Both experienced rapid growth as speculative capital piled in.
Economic Context:
Oil's rise coincided with economic growth, peaking before the 2008 financial crisis. Bitcoin has also seen peaks before macroeconomic downturns.
Common Themes of Speculative Peaks:
Liquidity Abundance: Speculative asset bubbles often form during periods of loose monetary policy or fiscal stimulus.
Retail Participation: Peaks are marked by significant retail involvement, media hype, and euphoric sentiment.
Late-Cycle Phenomenon: The speculative peak often aligns with the late stages of economic expansion, just before a contraction.
Leverage and Risk: High leverage amplifies price volatility and magnifies both gains and losses.
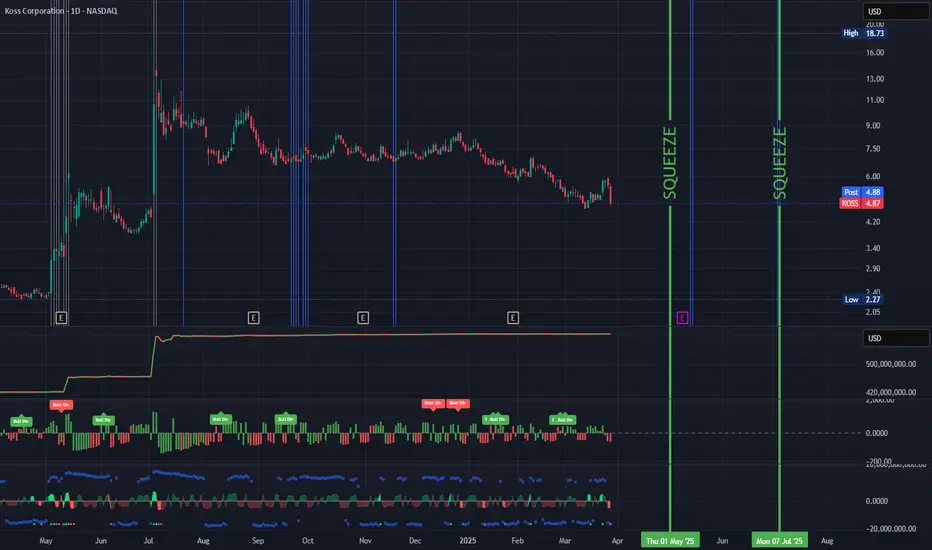
Squeeze Me: KOSSI do not have a crystal ball
But what I do have is enough
Trade What You See..Not What You Hope For
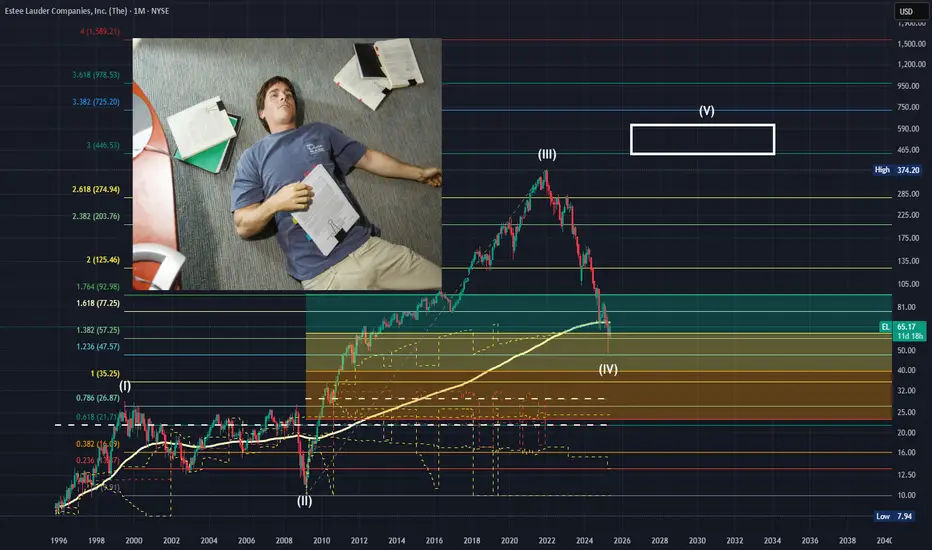
EL: "I May Be Early...But I'm Not Wrong"Having a little fun with this one since Burry's EL position is getting so much attention
With that said I see why its in his portfolio
Expect to hold this for 5-10 years to see it to fruition but yeah...I think Burry has another winner on his hands
As always time will tell and price is king
WC: 27.54 Target: 1800-2400 MOASS: 47k-100K: #GME20WeekCycleLast weeks post, Gamestop Decoded, laid bare everything that I'm fully confident on related to the timing of settlement cycles and The Cats plays
To summarize, GME moves on a 20 week settlement cycle that in its current iteration kicked off the week of Nov 27, 2023
The Cat seems to be amplifying price improvement thru strategic options/ share buying during Low IV periods within the settlement periods
I'll talk about some other interesting aspects of this in my next video on, 05/17
Whats Next?
As explained in the Gamestop Decoded video, from the WEEK ( not day ) of 05/12 thru the WEEK of 06/02 I anticipate volume to pick up significantly due to The Cat starting to receive his ORIGINALS which are WHATS IN THE BOX
That will lead to the WEEK of 06/09 which equates to the EXPLOSION EMOJI in the EMOJI Timeline
P.S. I will be GOING LIVE on my YT channel on 06/09 if you care to hear me ramble about whatever price action we see lol
GOOD TRADING TO YOU ALL!!!
MPW- About TImeMPW has been taking its swwwweeeetttt time overlapping and making lower lows
This is absolutely related to that insane borrow fee and the shorting taking place
But as with everything else, all things must come to an end :)
Shorts are about to get wrecked for the next couple months most likely
This should fly right along with the other stuff that squeezes from now throughout the summer
I'll most likely end up making this part of my "Squeeze Me" series

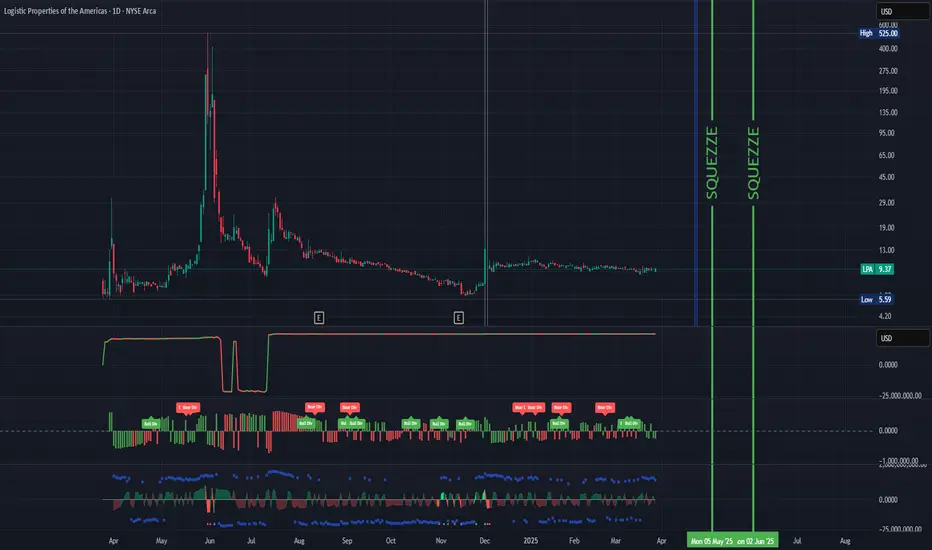
Squeeze Me: LPAI do not have a crystal ball
But what I do have is enough
Trade What You See..Not What You Hope For
Squeeze Me: ZAPPI do not have a crystal ball
But what I do have is enough
Trade What You See..Not What You Hope For

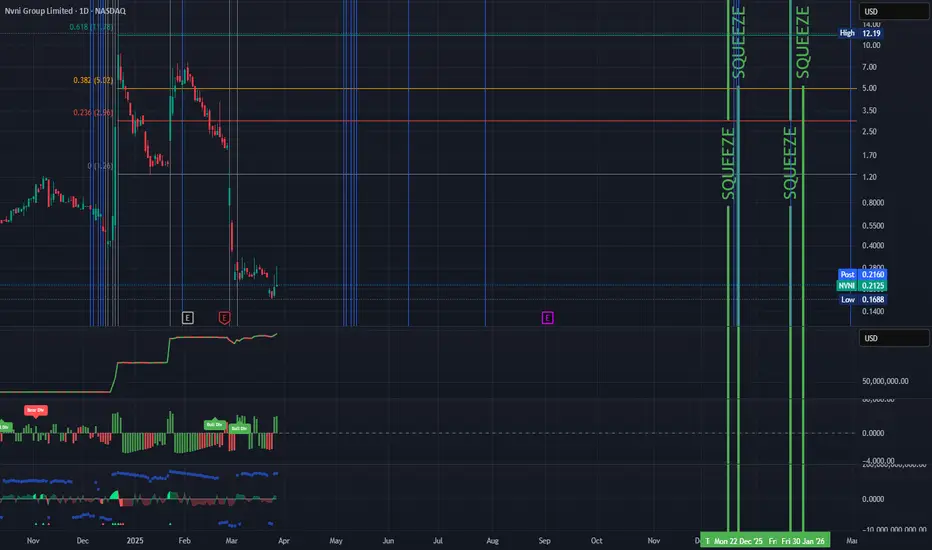
Squeeze Me: NVNII do not have a crystal ball
But what I do have is enough
Trade What You See..Not What You Hope For
Squeeze Me: DRUGThis one is for Roaring Kitty :)
I do not have a crystal ball
But what I do have is enough
Trade What You See..Not What You Hope For

Squeeze Me: MIRAI do not have a crystal ball
But what I do have is enough
Trade What You See..Not What You Hope For

Squeeze Me: SILOI do not have a crystal ball
But what I do have is enough
Trade What You See..Not What You Hope For
