Predicting the volatility of the volatility. ETFs use VIX as a resource to automatically hedge their holdings. This requirement for hedging is expanding with the popularity of ETFs. The channel shows the range of price volatility due to ETP creator arbitrages to balance the ETFs' true value. I've outlined some short term predictions for the behavior of volatility. Remember, it's volatile to trade volatile stocks!
Hedge
ABT - Abbott EUR hedged, correction setupLooking forward for further correction in Abbott, to weekly MA(200) / channel downside

Is it time to hedge stock holdings with an investment in gold?
Lagging and volatile global stocks, a strengthening US dollar, and prospects of slowed interest rate hikes combine to create a potentially bullish outlook for gold prices.
From its value of USD$2,925.51 on October 3rd, 2018, the S&P 500 has fallen 10.01% to USD$2,632.56/share. Over that same time period, the price of gold has appreciated 1.69% to USD$1,223.38/ounce. A continued downturn in US stocks coupled with a downturn in global stocks will work to potentially drive further appreciation of gold prices.
Current high levels of inflation, as indicated by growth in the US consumer price index and producer price index in 2018, should also work to create a favorable environment for gold prices. The United States has seen consumer price index and producer price index growth above 2% for every month of 2018 -- the last time these indicators observed growth in excess of 2% over 10 consecutive months was from June 2011 through April 2012, when the price of gold appreciated by 7.84%, and from May 2011 through March 2012, when the price of gold appreciated by 7.42% respectively.
Strength in the US dollar also supports a bullish environment for gold prices. The Bloomberg Dollar Spot Index’s current value of 96.9920 is at the highest level seen since June 2017. Historically, gold prices diverge from the value of the US dollar amid a downturn in the latter.
Prospects for deaccelerated interest rate hikes in 2019 by the US Federal Reserve also bolsters a long-term bull case for gold prices. A slowdown in the pace of interest rate hikes by the Fed will likely spark higher inflation of the US dollar, which may cause investors to increase gold holdings to hedge against inflation.
While indicators like a strengthening US dollar, volatile global stocks, and high inflation combine to form a bullish environment for gold, supply and demand levels for the precious metal tell a different story. According to GoldHub, supply levels of gold have held steady since 2010 while real demand for gold (by the technology and jewelry industry) has trailed off. Although the current macroeconomic environment appears favorable for an investment in gold, gold supply and demand levels actually work against this thesis. Investors seeking to hedge their stock holdings with an investment in gold should tread cautiously and plan for at least a 1-year holding period.
What do you all think about a potential investment in gold? Leave your comments below! We would love to engage in discussion and hear what everyone has to think.

Bullish market is on the run. SPX Euro hedged analysisLet's take a look at a different angle on multi year SPX run - SPX Euro hedged.
Almost 45 years of bullish market with price action in only the one upside channel, with 2 exceptions that were resulted to US recessions .
So what about 50% decline to early 2020x.

This Is Why You Hold GoldAs the SP500 has dived over the past two weeks, gold futures have finally started to incline after long and heavy tailwinds kept them from gaining traction. As we move into a more inflationary environment and the market outlook looks more bearish, gold will continue to provide be a classic hedge and we'll see futures rise. Silver futures are also an excellent hedge that has seen more volatility and is nicely poised for bullish ETF option plays on silver-tracking ETF's, for example. Now may be a good time to add gold and/or silver to your portfolio, either with futures or ETFs.

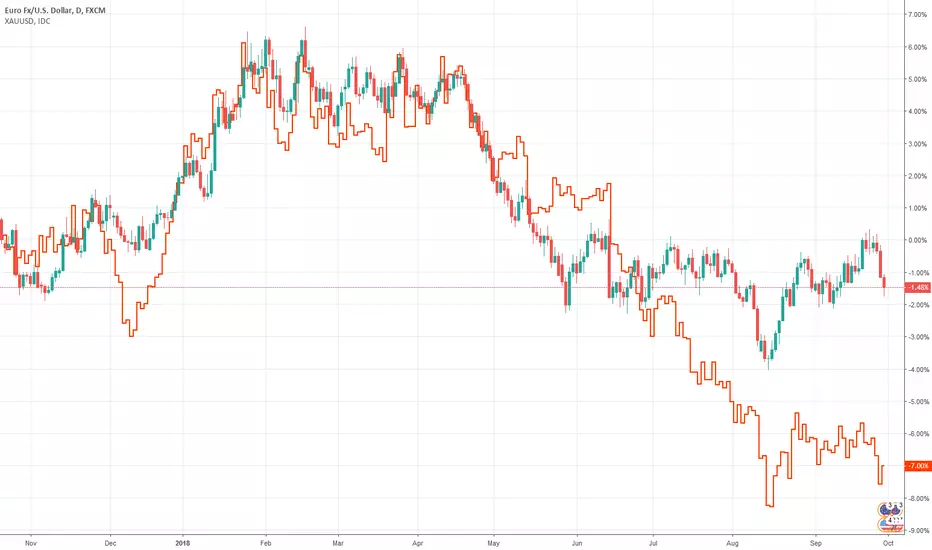
EURUSD vs XAUUSD - hedged arbitrage statistical analysisHi guys, here i am gonna show you a great strategy that have earned me some good money along my trading journey. As u have probably noticed it consists two parts - hedging and arbitrage. With simple words you trade two(or more - portfolio) instruments which have good correlation(arbitrage). The first one you trade on the short side and the second one on the long side (hedge).
This strategy is particulary great on the stock market, because most of the stocks play a big role in a certain sectors (INDICES/ETF's) and they move "together" - they have big correlation.
The reason i show you this example ( EURUSD vs XAUUSD ) is because i assume that most of you don't have the required ammount of money which is needed on the stock market (50k as a minimum) and that's why you will find it more suitable if the case is on the CFD's markets,
i.imgur.com - this pictures shows a regression model where Red line is the daily close price of EURUSD , the Green line is the daily close price of XAUUSD *(multiplicated) by a coefficient and the Blue line is the difference between both of the values. As u can see when the Blue line is the upper/down boundries, the Green and the Red line start to get close to each other which means that they start to close the gap.
I am not gonna explain more, but the idea here is that you have two options to trade this case: 1)with a long perspective (2 weeks - 2 months at least) 2) 1-2 days to 2 weeks.
No matter which case you choose u have to Short EURUSD and Buy XAUUSD if u believe that the gap will be closed. I advise you to paper trade it the first time and to see what will happen in the next days.
Caution !!! - for every 1 unit bought of EURUSD the appropriate ammount of XAUUSD shorted should be 0.9 units. With simple words, if i buy 1000 units of EURUSD i should short 900 units of XAUUSD .

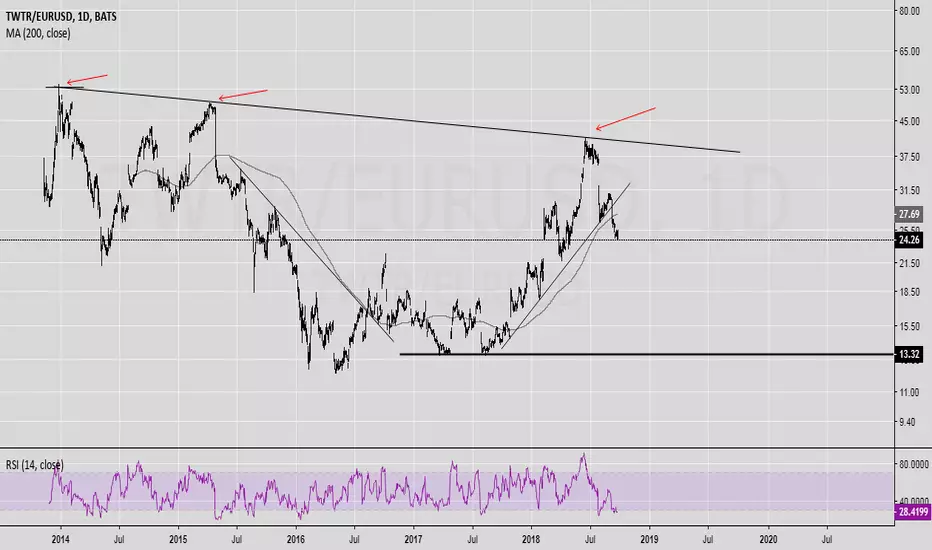
TWTR - Twitter stocks Eur hedged analysisSocial stocks have been rocked this week after Facebook and Twitter execs got a grilling from Congress, sparking worries over increased regulation.
Over the past week, Snap and Facebook have fallen by 7 percent, and Twitter by 11 percent.
Technically the underpressured way started in early 2014 looks quite clear for TWTR. Looking for stocks pullback to 13.30/40 EUR range
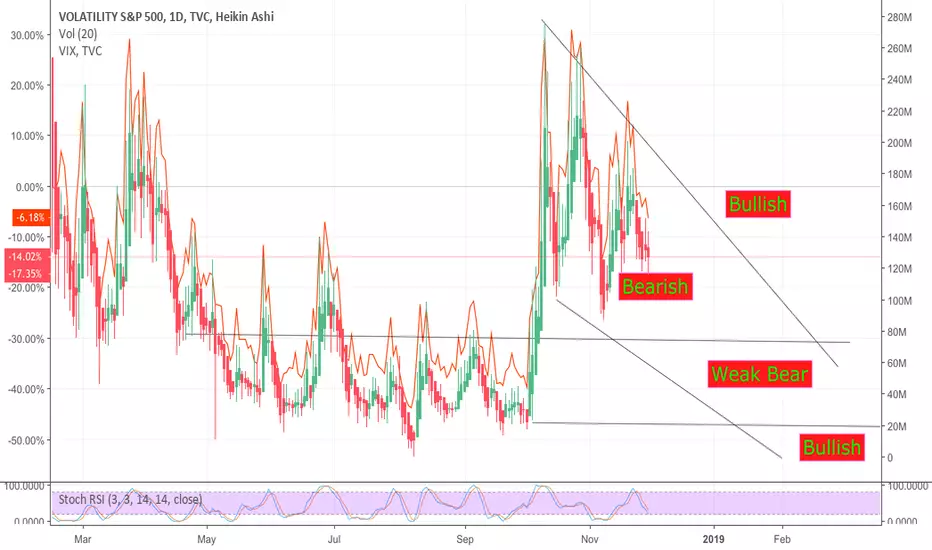
Market down: Synchronicity and the power of numbersClear VIX pattern emerging :
- Volatility has been forming regular waves between every spike or market correction;
- Average duration of a wave over the past 3 years has been 107 days + or - 19 days;
- Significant spikes between waves;
- Current wave duration has been 119 days, suggesting a correction is imminent;
- Volatility spike has properly started this week.
In addition :
- My solidly trending trades have been stopped over the past week;
- Gold seems to have found a bottom and is showing renewed signs of life;
- SPX has been foppish and rebounding against a significant resistance (see post below).
Conclusion :
- Time to take money off the table and to hedge against the downside
BUY VXX (have been building < $30)
BUY GOLD (am long GG)

Market Down!Been warning about the SPX hitting a strong resistance towards the top of the current upward trending channel.
Been suggesting to BUY GOLD and VOLATILITY (see other posts below).
Correction now clearly engaged with Tech leading us down faster, after its beautiful run.
How long this will last is unknown. However, please note the following:
- Long term uptrend still on for now
- Next levels down I would watch are 2,867 - 2,844 - 2,823
- Next levels up I would watch are 2,890 and 2,920
This emergence of volatility might also provide interesting trading opportunities
Safe trading

Hedged Positions / Retracement to 6400Howdy Y'all,
Today I'm updating this chart, somewhat hindsight from the drop at 7400. We've crawled our way through the early 7000 price range and honestly I haven't been a fan of the crawling pace to break 7800.
I had hedges placed at 7320 and 7520 to prepare for the drop - of course the 7520 didn't hit before last nights drop
Currently my goal is to pick up new BTC up on the south side Point of Control (red line) in the lower grey box. However I am longing 6838 with a stop loss a little lower than 6750. Looking at this chart I'm reading that 6800 is a high volume area. If bitcoin is going up with an alt season this is a great spot for it to bounce. I'll risk 1% of my account on this hypothesis - I think Bitcoin is at a great price to be hedged bullish.
Would love to hear y'alls thoughts and comments! Thanks for the time

SPX ToppishAfter multiple breakouts above historical highs, SPX is hitting its upper trend line resistance.
While the run might continue from here, this resistance creates uncertainty and the index might take a breather or stall altogether.
I would keep long positions with strict stop losses and hedge any upcoming correction in the following manner:
1. Buy volatility (VXX) which has been very muted and at low levels but would shoot up if equity indices corrected;
2. Buy Gold which has been lifeless, to hedge against any cracks in the equity up-trend. In particular, gold miners such as GG.
Take a look at upcoming, follow-on ideas on VXX and GG.

Long $DWDPExposure to the commodities.
1.96 Price/Sales ratio.
Another hedge play for heavy US equity players out there.

$VIRT: Long for exposure to Vol.Great company. Great management. Concentrated institutions increasing their exposure.
Note: Great hedge to have exposure to volatility.

(Hedge) IWM - Russell 2000Markets are near ATHs and showing some weakness, so I'm just applying some hedges in case.
Bought +1 Aug31 165.5/168.5 put spread for $1.03
Risk: $1.03
Profit: $197 (potential)

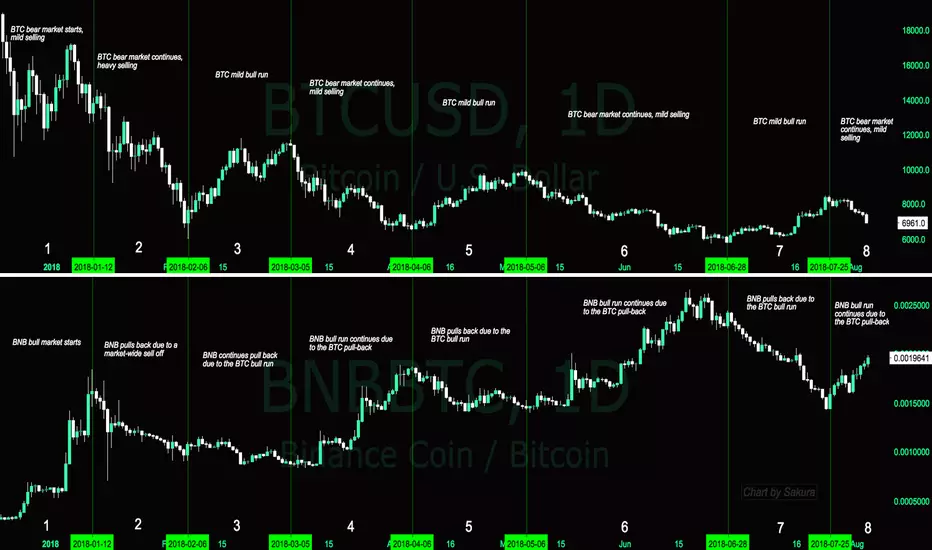
Binance Coin “hedge” to Bitcoin?Hi there, saw this and to share with you !
From my point of view, BINANCE:BNBBTC as became the nº1 BTC hedge.
Use this info !
#roadto1milion
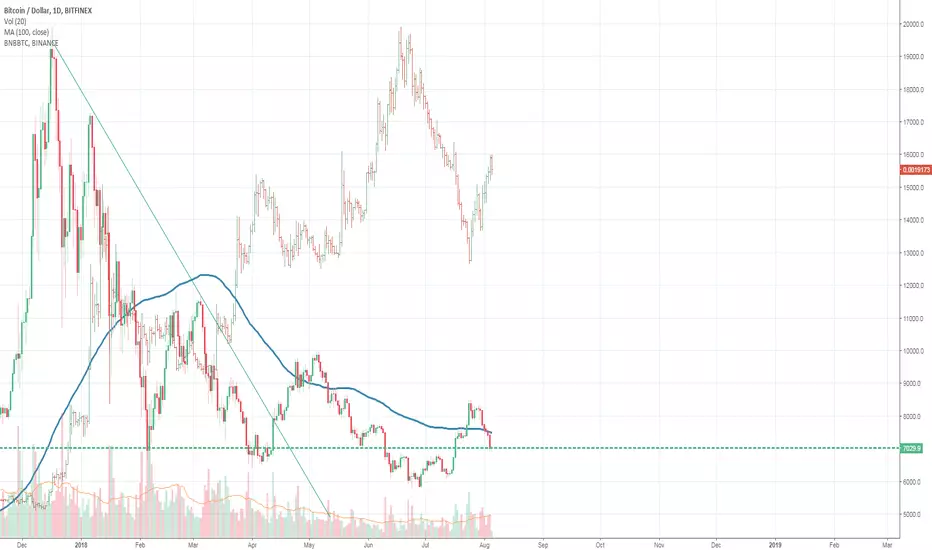
BNB, THE BEST HEDGEFrom this chart, you can clearly tell that BNB and BTC have been inverse of each other so far.
In Section 1, Bitcoin started to pull back after making a high of around $20,000 or so. This was the beginning of the Bitcoin bear market. At the same time, BNB started it's massive bull market.
In Section 2, Bitcoin dragged the entire cryptocurrency market down with it in a capitulation sell-off. BNB was also dragged into this sell off, nothing survived besides tether.
In Section 3, Bitcoin bounced back with a fairly healthy bull run to the $11,000 range where it double topped. At the same time, BNB therefore continued it's retracement.
In Section 4, Bitcoin pulled back and the bitcoin bear market continued. BNB did the opposite, continuing it's bull run.
In Section 5, Bitcoin stopped dropping and entered a mild bull run. BNB therefore started to pull back.
In Section 6, Bitcoin began to retrace again, continuing with the larger bear market. BNB continued with it's larger bull market, bouncing back.
In Section 7, Bitcoin reversed trend again, going on a short bull run. BNB retraced all of it's gains from the prior bull run.
In Section 8, the current section, Bitcoin is retracing it's gains from the current bull run, and BNB has reversed trend and is in bull mode yet again.
The lessons that I've learned from this are:
1. BNB is a great hedge to BTC, and holding BNB while BTC is retracing will cause your BTC stack to increase the majority of the time.
2. BNB and BTC are mostly inverse of each other, the only exception is when there is a large market-wide capitulation sell off. It's possible during a Large market-wide bull market they could both have simultaneous bull runs.
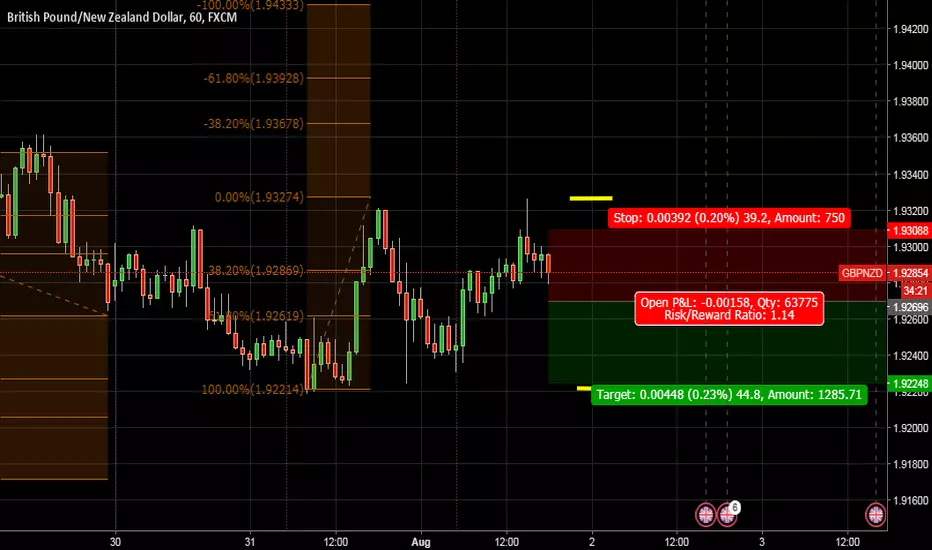
GBPNZD Short Setting up a short stop order for this pair to server as a hedge to my GBPJPY trade, with TP @1.92248 and SL @1.93088.
Daily:
Weekly:
Confidence: B (less risky than my GBPJPY buy because this doesn't go against the overall sentiment in COT as well as bearish trend in GBP, but still risky because of USD news later)
Pizza gonna try to hedge againD1 + 4hr Bear OB + .705 OTE Resistance confluence.
Paint the swing high then run the liquidity.

GBPAUD ShortAs long as hedges against the March 2019 Brexit continues, GBP pairs will continue to be bearish. Setting up sell stop order with TP @1.76821 and SL @1.77988.
www.poundsterlinglive.com
Daily:
Weekly:
Confidence: B (because of the political nature of risks involved)

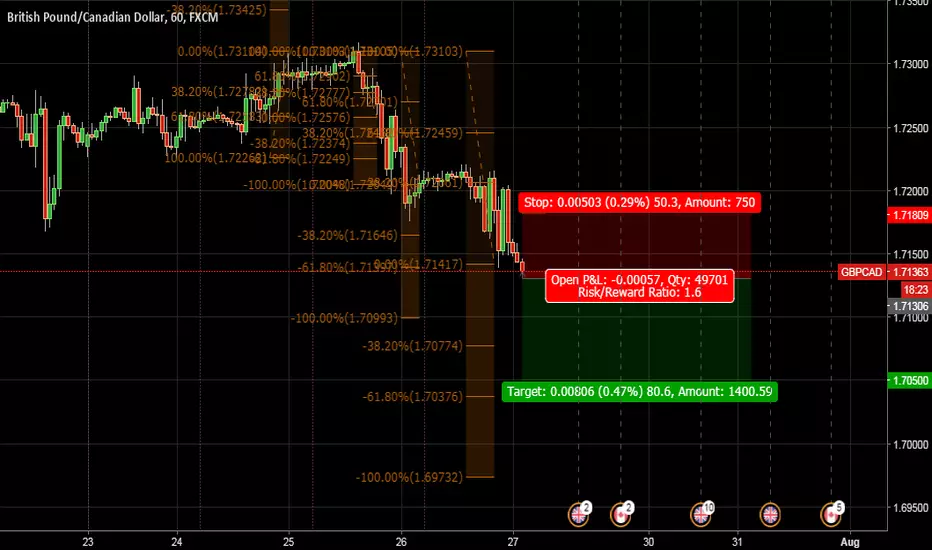
GBPCAD ShortWith oil price rallying possibly up to 70 esp after lower than forecasted crude oil inventory last Wednesday which is bullish for CAD also, as well as bearish GBP driven by hedges for March 2019 Brexit, setting up sell stop order with TP @1.705 and SL @1.71809.
www.poundsterlinglive.com
www.zerohedge.com
Daily:
Weekly:
Confidence: A
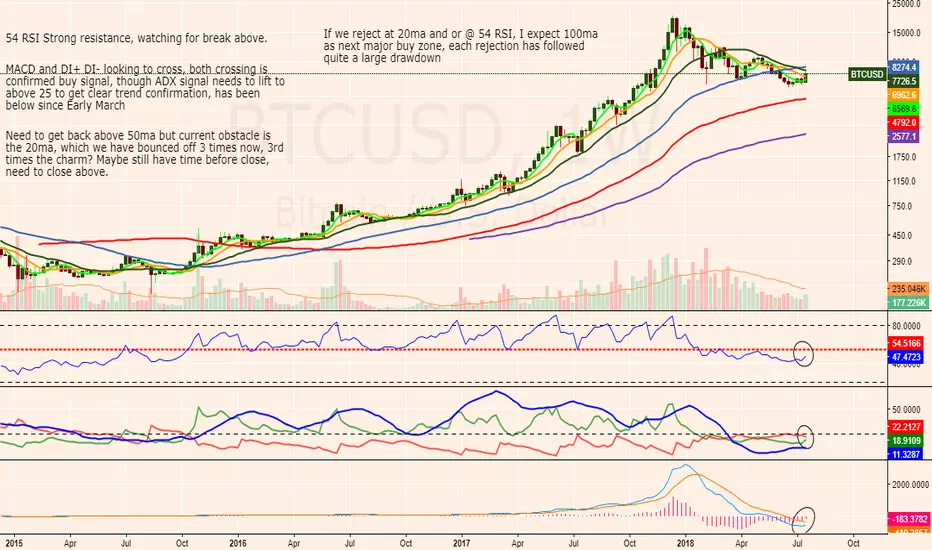
Still Bullish on the Corn but will we see a correction before 8kG'Day mate,
How are we all today, it is a nice fresh winters day in North Queensland Australia this morning, wonderful weather for sitting with the feet up doing some TA analysis on our favourite cryptocurrency Bitcoin.
After closing the week yesterday in great stead for the bulls, we closed the first day just a bullish. We are though sitting firmly underneath a very long-term support/resistance line that has really stopped our momentum in its tracks. I still think a short as a hedge is the right play, I will be adding to it at 7800 7900 while still in my long, I added to the position overnight which has brought up my entry, which is not an issue with the hedge. Remember these hedges will eat at your profits generally but reduce your risk in a big way. If you play it right in a trend you can generally short the pullbacks while long and then close your short at the dip and then ride the dip back up. This can be risky, so keep watch, if the dips start painting lower lows on 4-6hr TF, a reversal may be in progress.
December futures are well in Contango currently and are a great short opportunity, if you are looking to hold it for a long period, currently mark price is anywhere around 50-60 dollars above spot price but as we near settlement it will close on spot, so now is a good time to get in, if you are in the belief that we will still be under current price in a couple of months. This price difference can swing in and out of Backwardation and Contango, so make sure you have enough MArgin to cover you in case of swing.
Good Luck, I hope you can garner something from my Posts, please like and share and comment, make me feel like this is worth taking the time to do. Come find me on twitter or at bitmex under Roger Rektjet or just look for troybyrneoz, if you are not using Bitmex, click my referral link on my profile to get 10% off and they give me a small bonus too. I don't ask for donations and never will charge.
G'day
Thanks for dropping by, hopefully you garner something valuable from my post, be it educational or an idea towards a trade of your own. Please share, like and comment and engage with me, I am here to help
Trader, Chart analyst and all round larrikin. Reside in NQ Australia, surrounded by Crocodiles, snakes & giant spiders, not to mention the boxing Kangaroos and devilish Drop bears. It makes my job quite hazardous but strewth mate, I love it.

Very Bullish on the Corn if we can break these coming conditionsG' Day Cobbers,
It has been a long time since I posted on Tradingview, between running a business and trading in the few moments between Family and Work life I found it not really worth the time to publish, especially since my good charts and Educational posts views are poor compared to Clickbait type headings like above. If you followed me on Twitter, you would see me posting on there quite often though.
Anyway mate, this Weekly TF chart screams bullish to me, its al n the charts, so I ' repeat it again. If you are not in a long position already, I will attach some areas I am looking to add if we continue to retrace. If you are looking for a short head that tasty 20ma would be a great play. I would be cautious though, if we break above the 50ema it could be quite sometime before it comes back down. I may hedge with December futures, not decided as yet.
Anyway, please like and comment and engage, perhaps I will find time to update more regularly.
G'day
Thanks for dropping by, hopefully, you garner something valuable from my post, be it educational or an idea towards a trade of your own. Please share, like and comment and engage with me, I am here to help.
Trader, Chart analyst and all round larrikin. Reside in NQ Australia, surrounded by Crocodiles, snakes & giant spiders, not to mention the boxing Kangaroos and devilish Drop bears. It makes my job quite hazardous but strewth mate, I love it.