USDZAR buy scalp (trapped sells)Could be huge. Could turn into a flake. But should probably push up some more. But that's why am tirelessly working on my EA algo. I hate chart watching.
Heikin

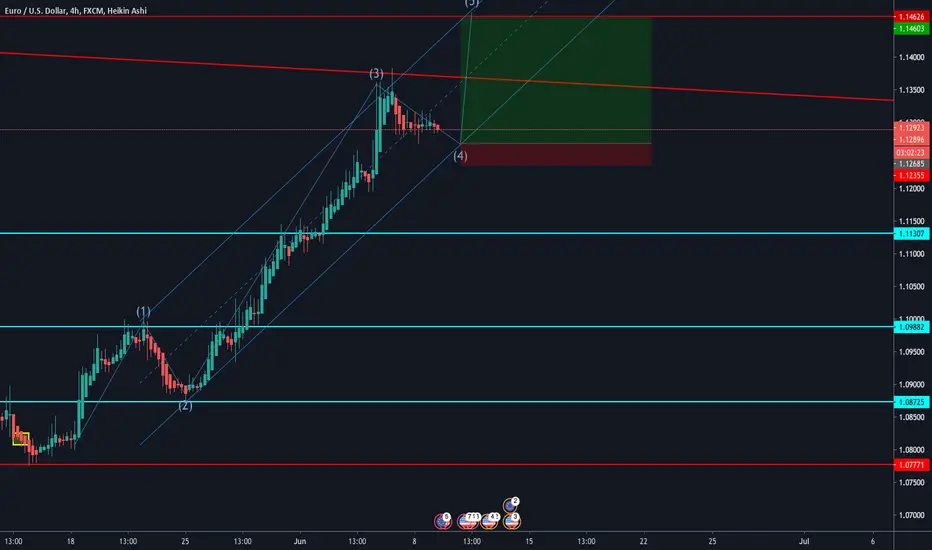
UPDATE on Elliot impulse wave on EURUSD Hello world,
just a quick update regarding my idea on the EURUSD .
Theory:
currently in (correction) wave 4 and soon to engage in wave 5.
We have:
- 1 sharp correction, 1 flat correction (typical for impulse waves)
- longest wave 3 (until now)
- wave 2 not overcoming wave 1
- wave 2 meeting 61 fib mark
Used heikin ashi for easier visibility. Pattern was drawn on candles.
What I am waiting for:
- Breakout candles like big bullish engulfers
- switch in 1h trend to upside
Happy for feedback.
All the best,
c4ss10p314
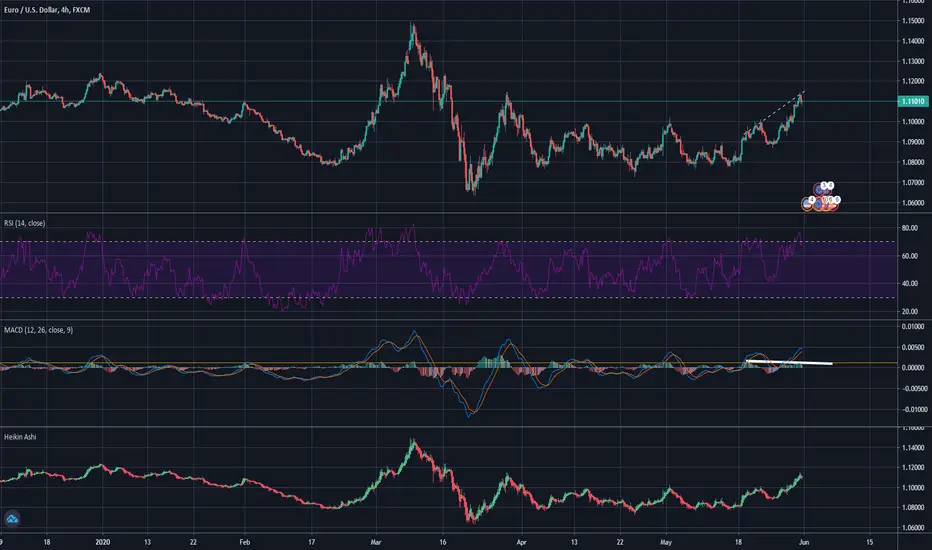
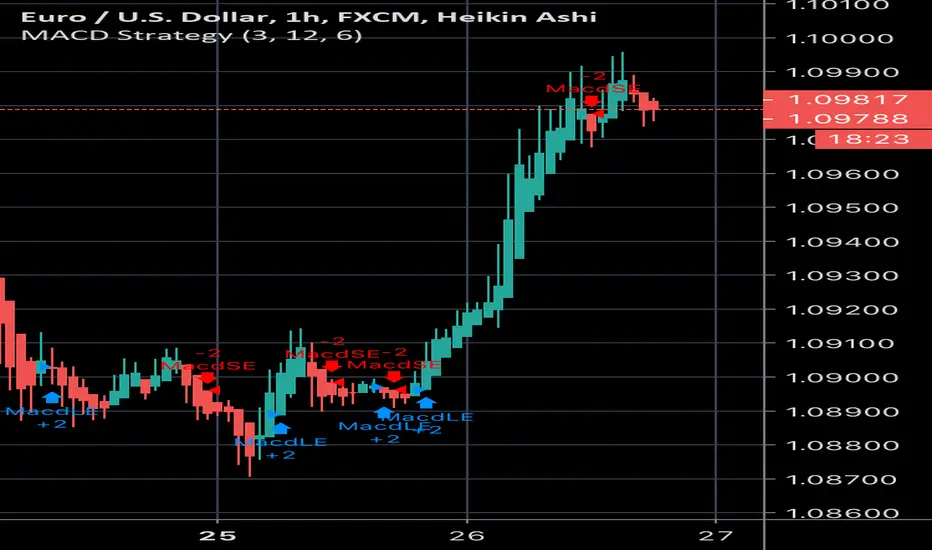
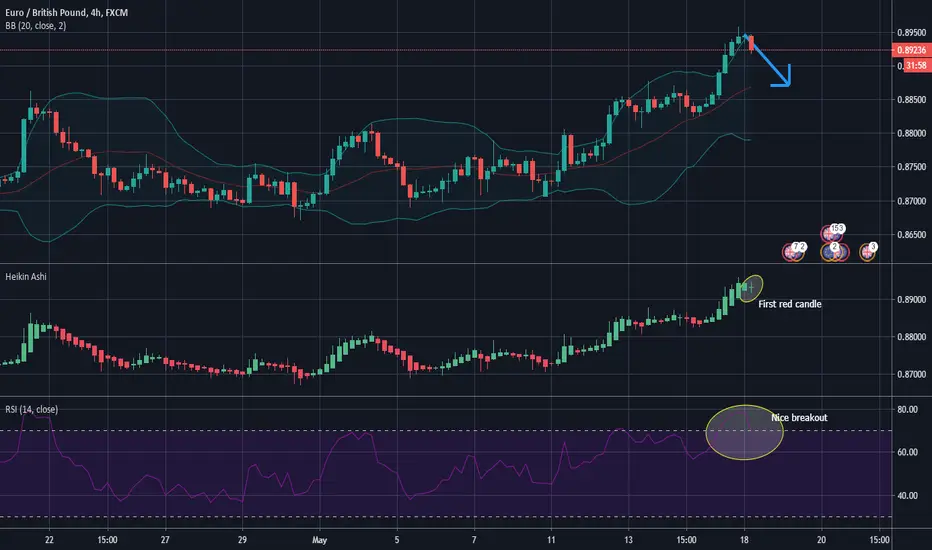
Possible trend reversalAs we can see there is a small divergence happening here. The chart has given us a higher high but the MACD does not indicate a high high. The difference is not that big so this is a small indication because we normally would like to see a bigger difference in the chart and MACD. The other thing that could indicate a trend reversal is that the RSI has broken above the 70 level and that the Heikin-Ashi has already given us the first red candle. This 3 things combined indicate that there could be a trend reversal.
PLEASE KNOW THIS : It is a very news driven market at the moment so the indicators are not as accurate as normally.
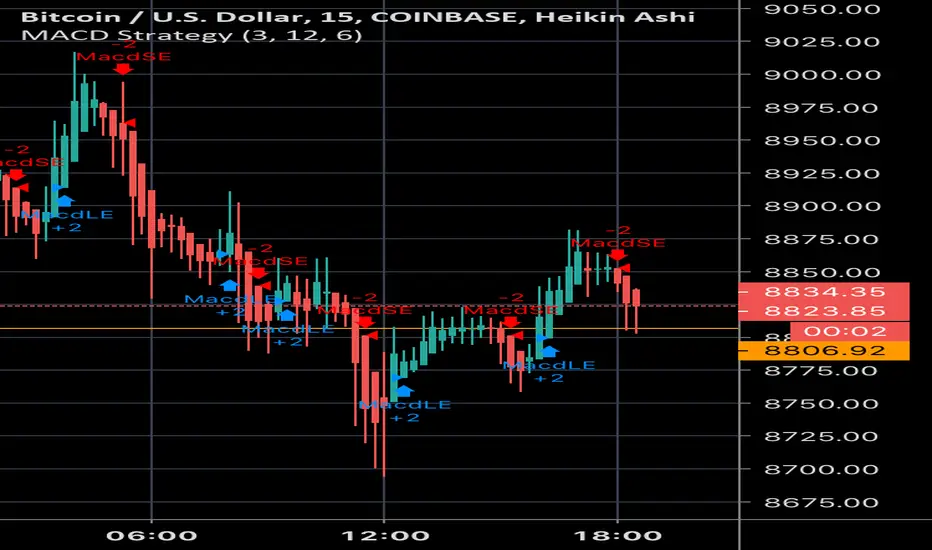
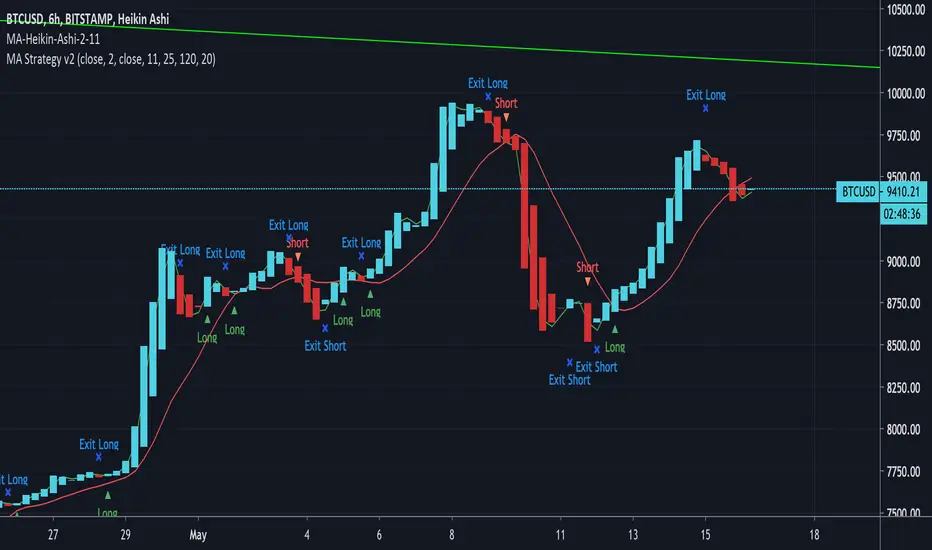
BTC USD STRATEGY -long on blue and close when short is indicated
-short on red and close when long is indicated
Eur Usd short term trends-Long on blue and close when short is indicated
-short on red close when long is
indicated
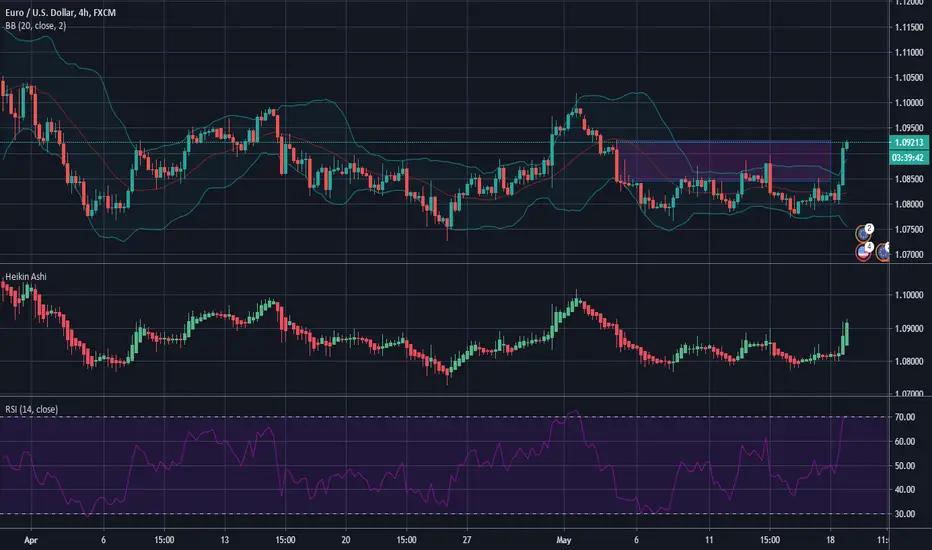
ShortingWe can see that the RSI level of 70 has been broken. This is a good confirmation that the price is going to drop. We now just have to wait for the first red candle to be formed in the heikin ashi.
Let me know in the comments what you think of this.
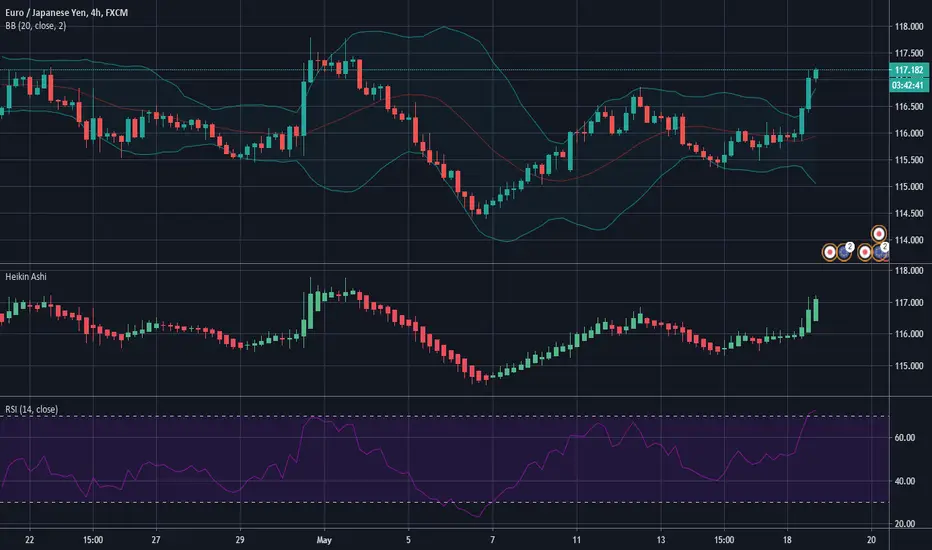
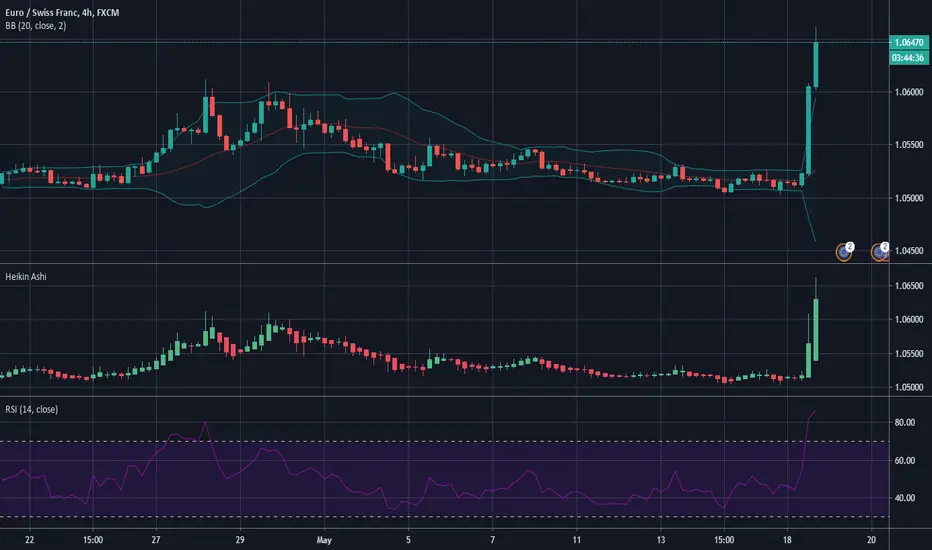
Shorting?We need to wait for this one to see what the RSI will do but if it keeps going up the RSI will pass the 70 level and then we need to have a look a the heikin ashi to see that we can short it if there is a red candle formed there.
Let me know in the comments what you think of it.
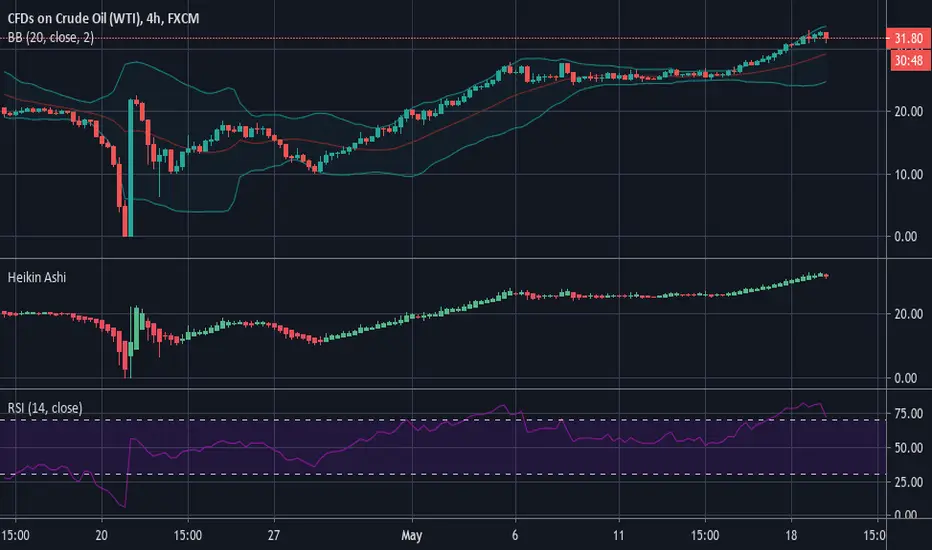
Shorting USOILWhen we go and have a look at the chart we can see that there is a breakout of the 70 level in the RSI and that the first red candle is forming now in the Heikin-Ashi. This are good indicators that the price will go down.
Let me know in the comments what you think of it.
ShortingWe can see that the 70 level on the RSI is broken. This is an indicator that the price will go down. If we want to make the sell order we have to go and look at the Heikin Ashi for the first red candle there for the real confirmation that it is going to drop.
Let me know in the comments what you think of it.
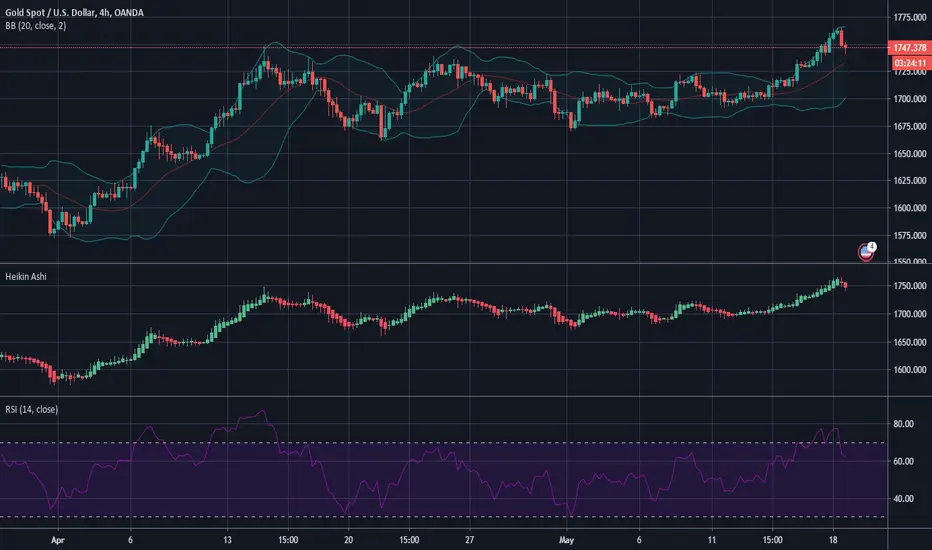
Short on GOLDWhen we have a look at the RSI we can see that there was a breakout of the 70 level. When we than look at the Heikin Ashi we can see that there is a red candle that was formed. This is an indicator that it will drop.
Let me know in the comments what you think of it.
EURGBP droppingWhen we look we can see that the 70 levels on the RSI has been crossed. When we than look at the Heikin Ashi we can see that there is a good chance that the first red candle will be formed there. This would be a good confirmation of a drop.
Let me know in the comments what you think of it.
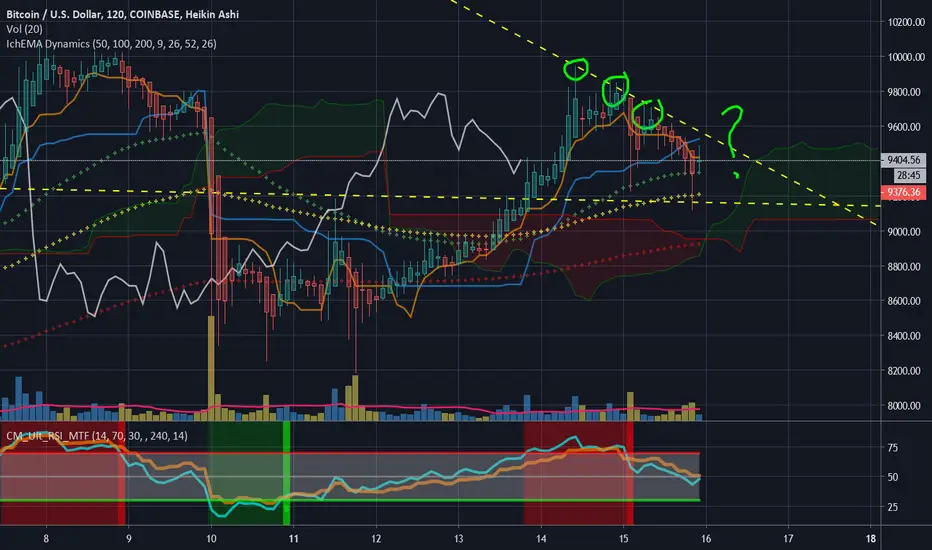
4th touch incoming? watch this wedgehaven't published in a little bit, needed some sleep. If you guys wanna see more charts and explanations of indicators from me use those referral links or send me a tip to let me know.
Anyway there are some other harmonic patterns on a different chart pointing bullish to around 9.7k so I expect this wedge will break bullish on the fourth touch. lower line is the long trend line we just broke out of, upper line is obvious. There isn't too much more to say about this but I'll include a note to say: make sure you are using heikin ashi it's really invaluable. The wick (more accurately relationship between wick and body) tells you a lot about the strength of the price action in a candle and it gives much smoother signals. You don't have to worry so much about little break outs and break downs watching the heikin ashi close. I think the kanji means average value leg if you break it down or just average bar. www.investopedia.com Make sure you guys use investopedia and some basic reading comprehension, they are a great resource. ichimoku traders watch for that tk cross above the cloud
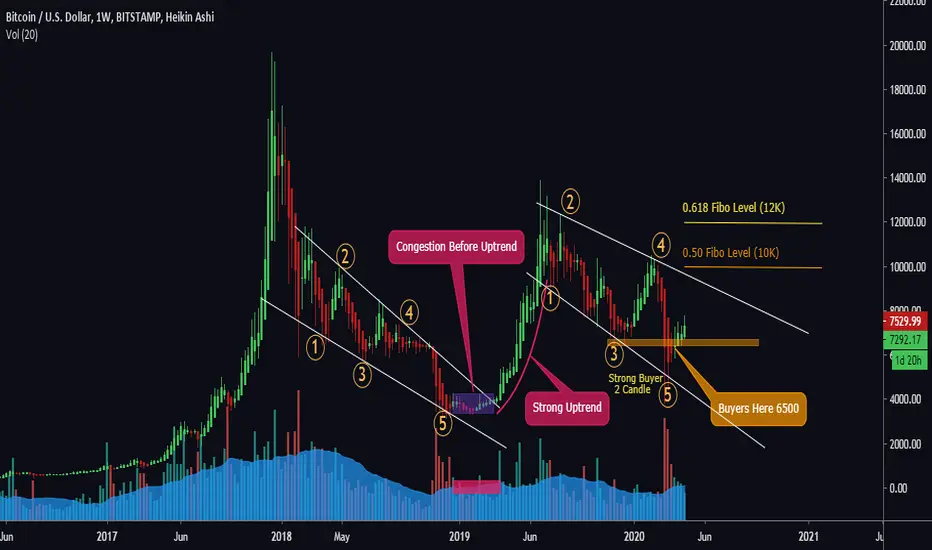
Bitcoin Amazing Weekly Wave and PatternsLike it and Follow me for high Probability next setup.
BTC Amazing Weekly Analysis, Seen that chart in different time and candle view.
I used Heikin Ashi candlestick pattern. Hope u Enjoy it
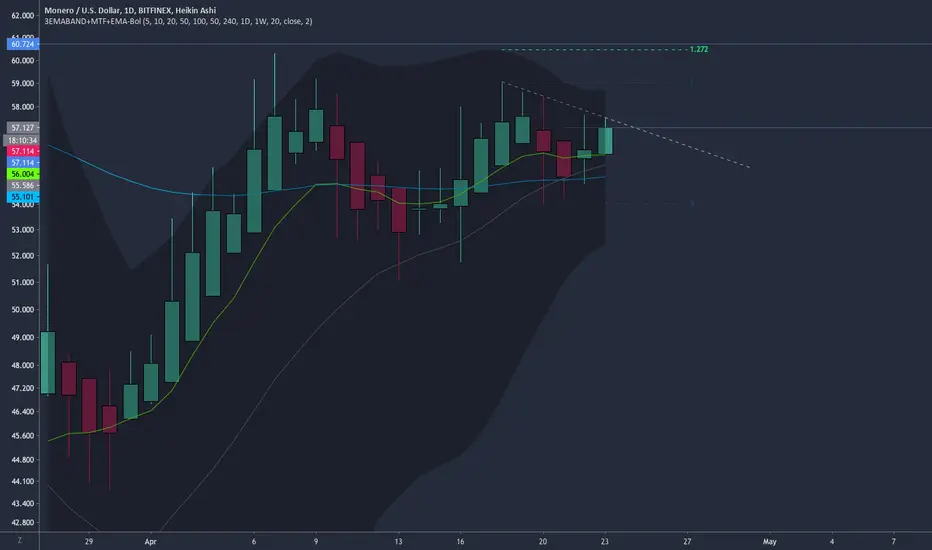
XRMUSDPossible upward movement - on the daily. Bullish daily candle, after change of direction doji + saucer buy pattern, on a fast AO oscillator. Target is just a guide - exit on change of trend.
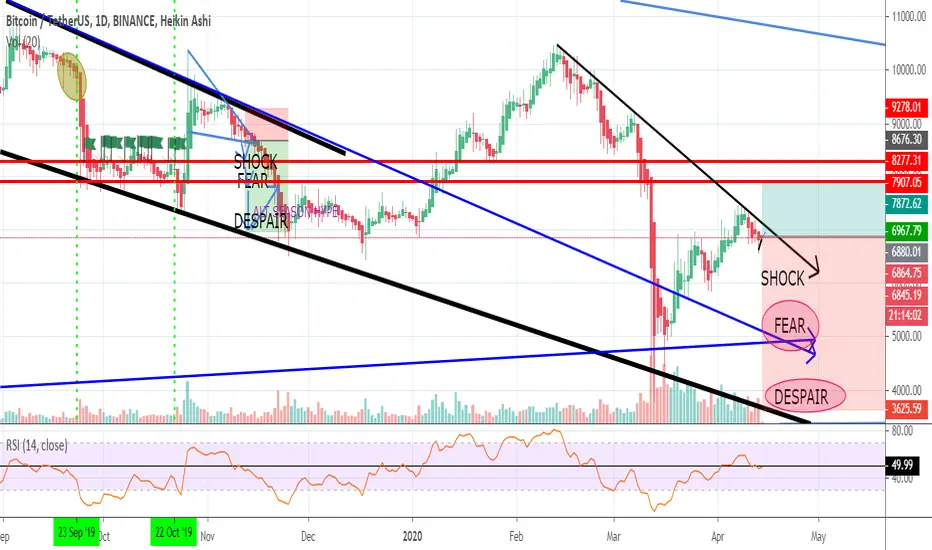
PART 2 - Shock, Fear then Despair. Then Halving HypeHere is my Part 2 Analysis of the next "BTC dip" that needs to happen (and fast) before the halving hype.

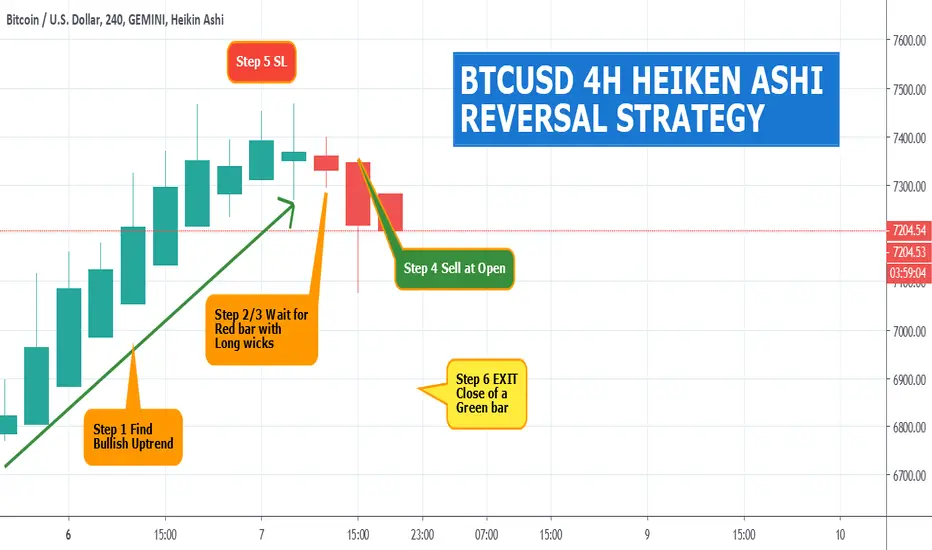
BTCUSD 4H HEIKEN ASHI REVERSAL STRATEGYn Japanese, Heiken Ashi means “Average Bar” and it represents the average-pace of prices.
The Heiken Ashi candlestick chart can help you to spot both trading periods and ranging periods that you should avoid.
There are two primary trade signals that we can identify through the Heiken Ashi candlestick:
1- Bullish candlesticks with no wicks or very small wicks indicate a strong uptrend and excellent buying opportunities.
2- Small candlestick characterized by a small body and big upper and lower wicks signal a potential reversal.
Use strategy on all markets and time frames.
Step #1: Identify a strong move to the upside.
One of the simple ways that we can use the Heiken Ashi candlesticks is to trade reversal when the candles changed color.
So, the first thing we’re going to look for a bullish trend or a strong move to the upside.
Note* The Heiken Ashi chart tends to give much more extended and smoother runs of bullish and bearish price candles which is because of how the calculation is used to average out the range of the bar.
Step #2: Wait for the Heiken Ashi bar to change color from bullish (green) to bearish (red)
The first sign that the price is about to turn lower is when we see a red Heiken Ashi candle.
In order for the Heiken Ashi bars to change color, there must to be a strong shift in the order flow and this typically translates into a much more reliable signal than we get when typical price candle change color on a normal price chart.
The way we look to use this feature is simply to implement traditional technical analysis to locate potential reversal zones with the Heiken Ashi chart.
We use the price action reading skills as a filter to identify a potential trade and then we use the Heiken Ashi chart as the confirmation to go ahead and execute the trade.
Step #3: The first bearish Heiken Ashi candle needs to have a bigger than average lower wick
Long lower wicks can provide an incredible trading signal, especially when using the Heiken Ashi price chart.
You can also wait until you see a bearish Heiken Ashi candle with no upper wick. However, this second approach will cost you some profits left on the table.
The Heiken Ashi trading strategy satisfies all the trading conditions, which mean that we can move forward and outline what the trigger condition for our entry strategy.
Step #4: Sell at the market at the opening of the next Heiken Ashi candle
Our entry method is very simple.
This is a bullish reversal setup, so we’re looking for buying opportunities once everything is in the right place.
Now we can anticipate that a reversal is put in place, and we can go ahead and buy EUR/USD at the opening of the next Heiken Ashi candle.
Step #5: Hide your protective Stop Loss above the first bearish candle high.
One of the really fantastic things about Heiken Ashi candles and what makes them so great for trading is how we can use them to place our protective stop loss.
Because of the tendency of the candles to display continuation, we can go ahead and be really tight with our stops. We can simply place our stop loss above the signal candle high.
Step #6: Take profit after we get a close above a previous bearish candle.
A good Heiken Ashi trade setup will tend to run for much longer than a usual price action setup. So, when we’re trading with Heiken Ashi candles, we really want to exploit this and keep our trades open for longer than we usually would.
Because we’re using such a tight stop loss, we’re only going to need a small price movement to make a good profit on this trade.
Note** the above was an example of a SELL trade using our Heiken Ashi trading system PDF . Use the same rules for a BUY trade – but in reverse.
PM me if you want to read the complete strategy.
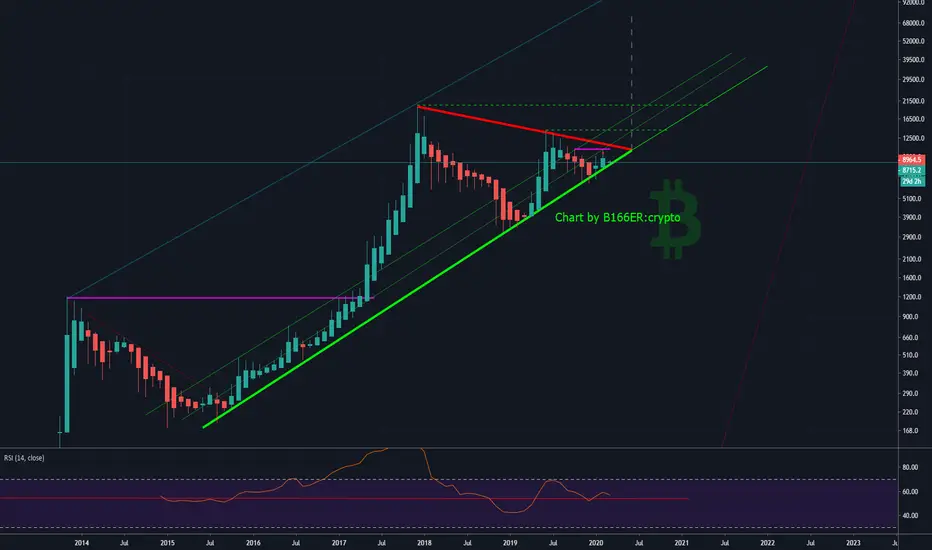
Bitcoin's Heikin Ashi Chart Still Looking Bullishly TastyWe got the first green candle in January.
February didn't disappoint.
March lookin fine as hell as we squeeze further into the tip of the triangle.
This is one sexy chart. I like how the Bitcoin price twerks up and down.
Not financial advice.
Peace, Love, & Crypto,
B166ER
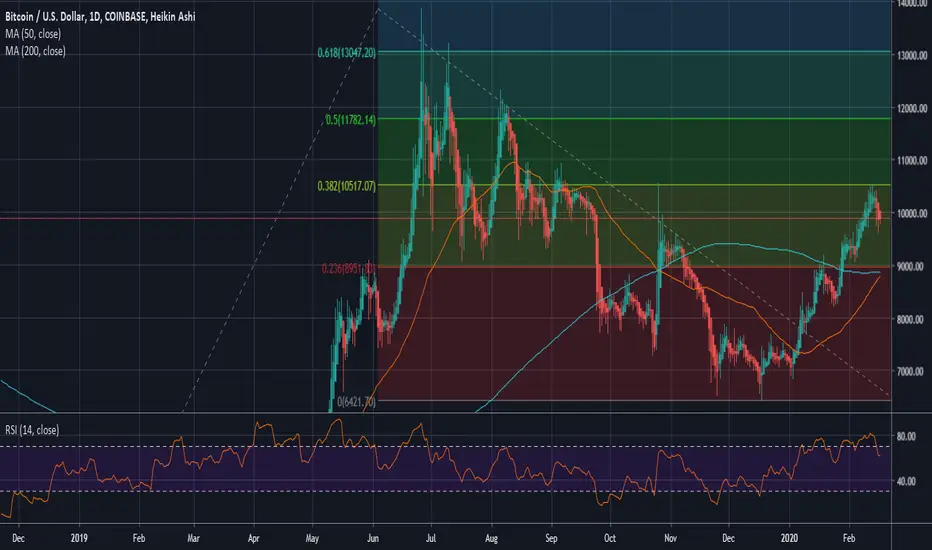
Bitcoin bounces off .382 fibonacci retracement vs USDBitcoin bounced off the 38.2% Fibonacci retracement against the U.S. dollar (USD) from the trend based December 2018 swing low to June 2019 swing high. If this scenario were to continue the bullish momentum then longs started now could take profits at $11,782, $13,047 and $14,848. If this trend turns bearish below $8,951 then shorts could profit at $6,421. The golden cross of the 50 & 200 moving averages suggests this bearish scenario is unlikely.
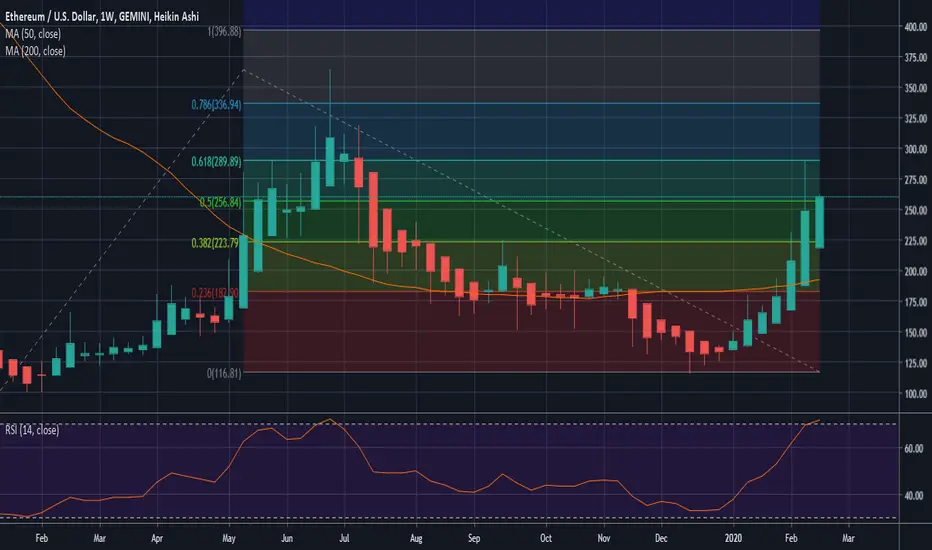
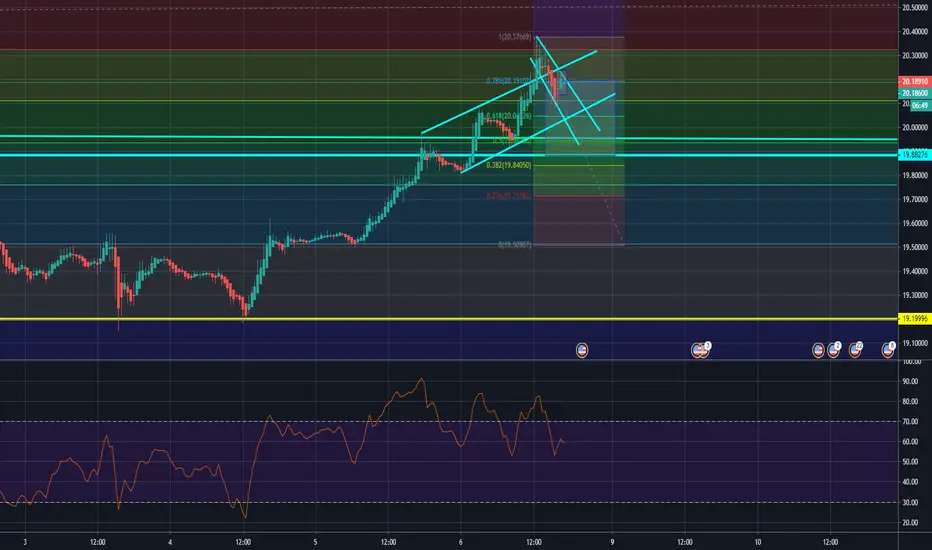
Ethereum holds 50% Fibonacci level against USD on weekly With minutes left in the weekly heiken ashi candle for Ethereum against the U.S. dollar, Ethereum held the 50% retracement level from its December 2018 swing low to June 2019 swing high to December 2019 low. RSI is getting over extended. Longs entering now should target $289.89, $336.94 and $396.88.