Litecoin - Heikin Ashi, trend analysisLooking at the LTC chart with Heikin Ashi candlestick pattern, we can see the trend much clearer, and things are looking good with a strong uptrend, all green candlesticks with high wicks, which indicates the trend is currently strong.
However, I don't think we are completely out of the down trend just yet, price needs to make a higher high on the daily before i'm convinced, and that is shown by the first red line.
I do think we have a good chance of continuing up to this red line though, and taking profits here would probably be something to think about.
(this is not financial advice)
Heikin

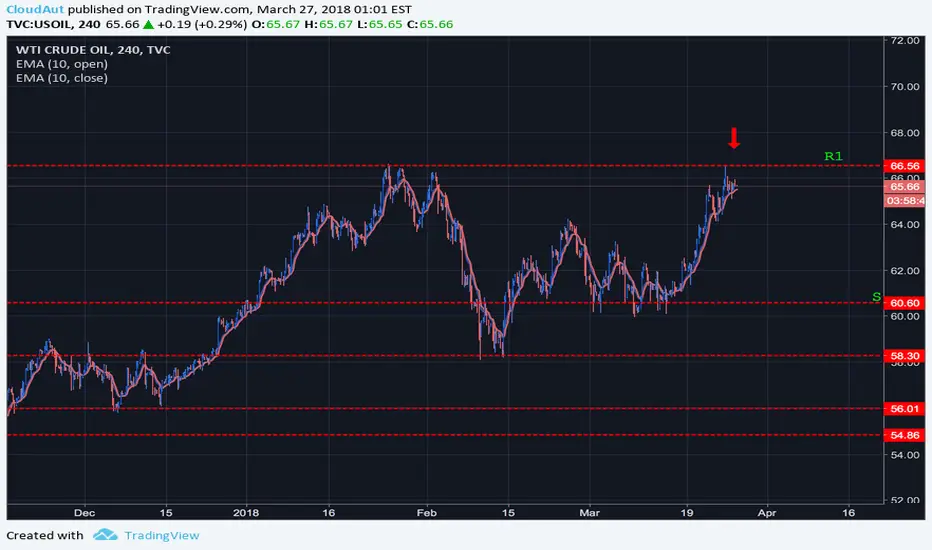
WTI Crude Oil Excellent opportunity for WTI Crude OIL
Here is what can become an excellent opportunity, one of those I prefer. A nice double maximum in daily reached with extreme precision.
The graph to which I refer in this analysis is a 4h and shows very clearly how in area 66.70 there is a double maximum for oil. On these occasions, immediately within short placing no stop loss just above R1 and a first target in S1. As I have repeatedly explained in my analysis, my entry is not unique. I usually build a position in a market with multiple entries. Entering 65.73, for example, I start to build my position that I will strengthen if I had to get closer to R1 while keeping the same SL in order to take full advantage of the rebound. I will strengthen this position further if the daily gives me another bearish signal like that of a Heikin Ashi Bearish or a short signal from the EMA10. However, the opportunity is now really interesting, there was also a spike on R1, so I start to build my short operation.
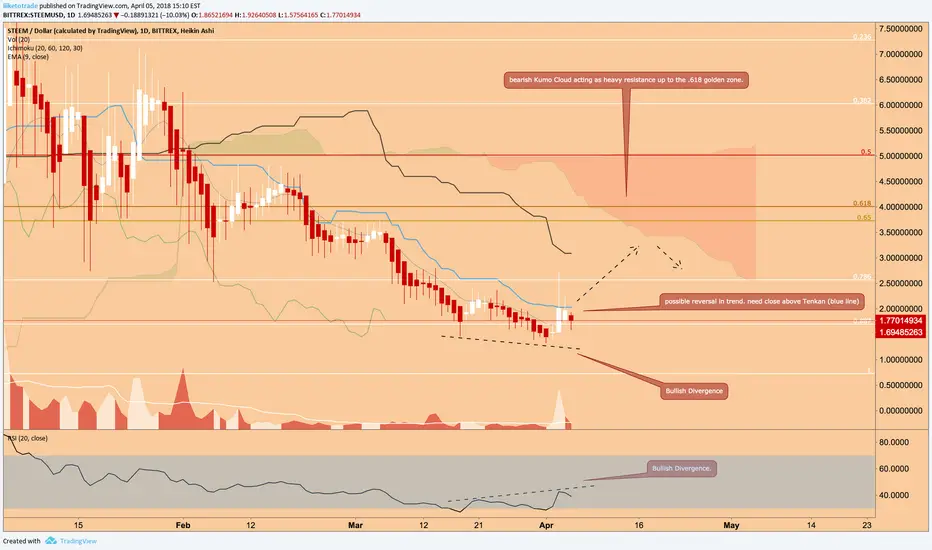
STEEMUSD / Are the tides turning?This post is part of my Technical Analysis Trading Blog on Steemit. please come over to Steemit and join in!
steemit.com
BITCOIN / BTCUSD / Ichimoku / Heikin AshiI want the bull run as bad as you do. But we are gonna have to wait. probably, for a while. The trend down is still strong.
I am going to start posting my short trades from 1fox.com. stay tuned.

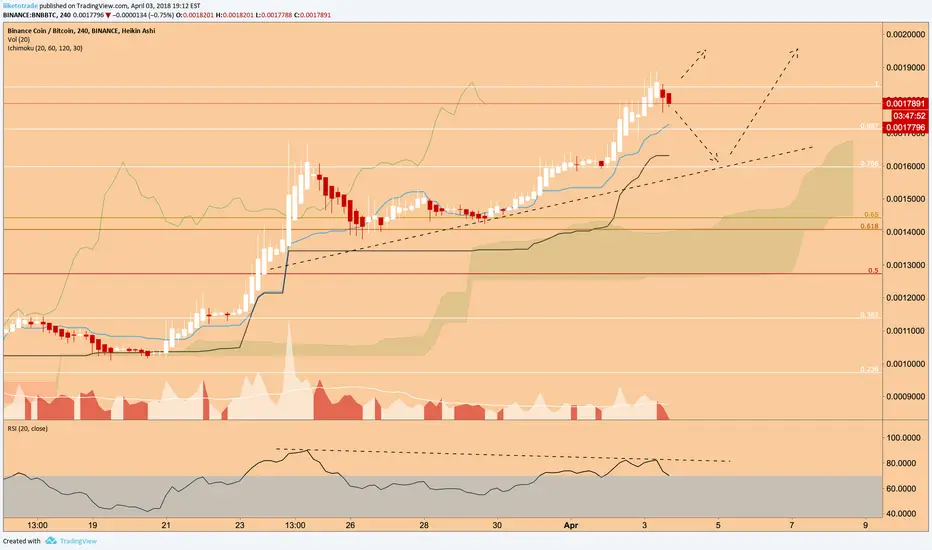
BINANCE COIN / BNBBTC / Ichimoku / Heikin AshiBNB is looking very bullish . I feel the fundamentals behind this token are strong. The long term decentralized vision of Binance makes a lot of sense to me, and they have the capital and liquidity to pull it off. The move to Malta, ability to bring fiat pairs, and a coin that actually has a use (exchange fees), all in all i like this coin a lot.
We have reached the all time high for a double top.
RSI is showing bullish divergence on the 4 hour & the 1 Day chart.
We are well above Kumo, Tenkan and Kijun, showing a very strong trend.
A retracement back to the trend line is likely , but the bullish RSI indicates we may break out and make a new all time high vs BTC.
I am waiting for a strong bounce off of the Tenkan, a white candle with no bottom wick, and a close above the 1 to enter.
I think this is worth keeping an eye on. it's nice to see an all time high in this market. go binance!

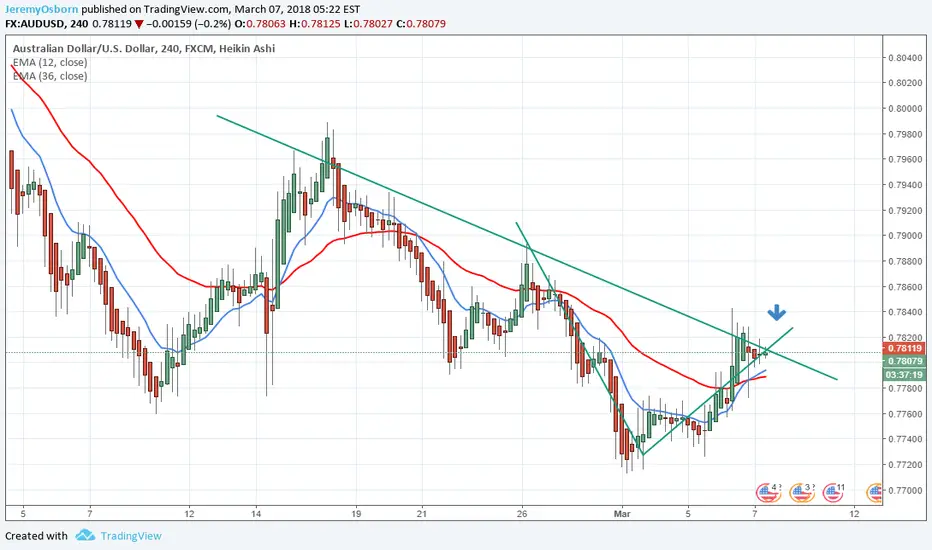
High prob low risk short sell - AUDUSDEntry on first good red candle around: 0.77908 1st target: 0.77194
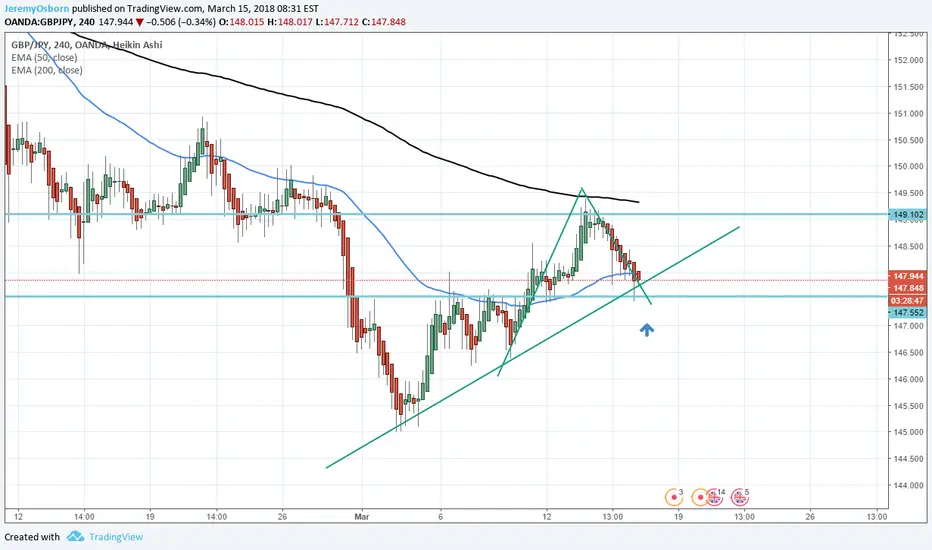
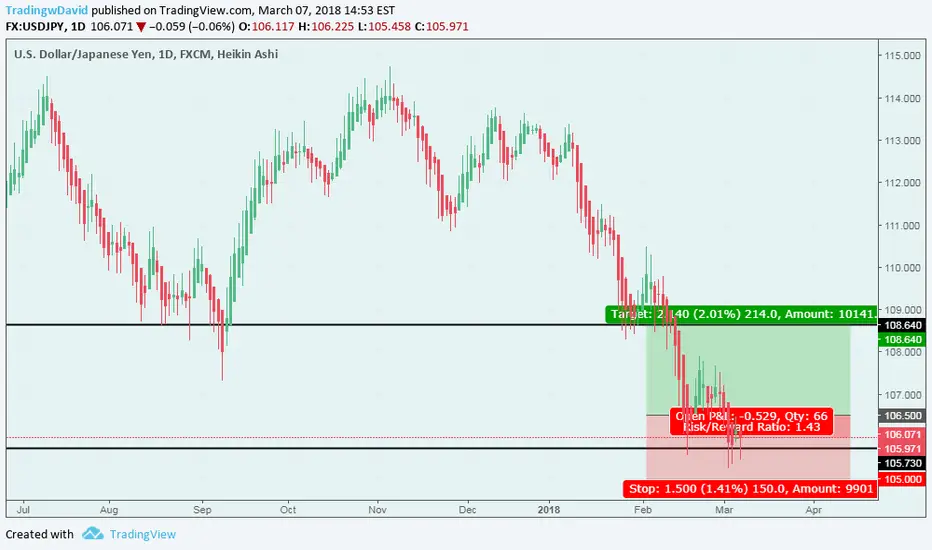
USD/JPY possible bounceUsd/Jpy is testing the support in 105.750 area, and it's likely a bounce until 108.650 area. In particular, if the price gets back above 106.500. You can see better the support if you use the weekly time-frame.
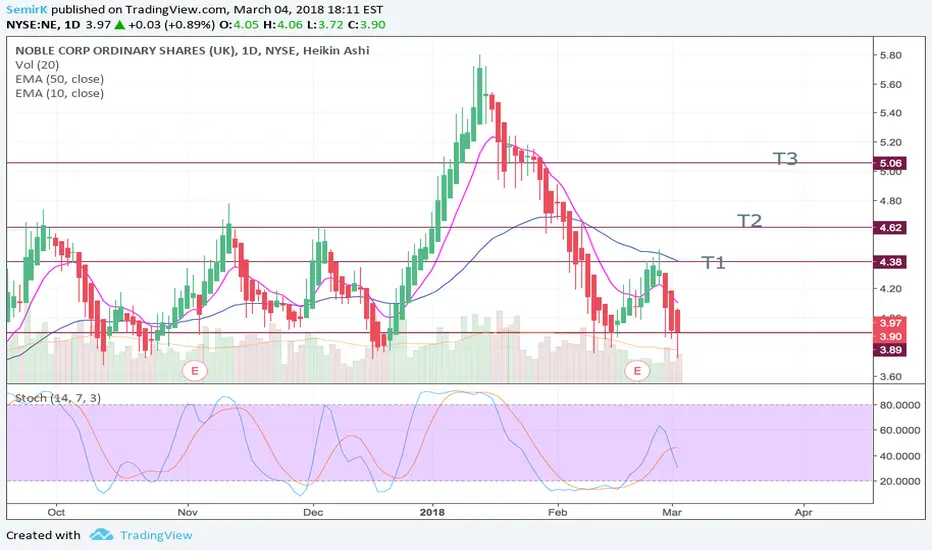
NE LongThis looks to be a predictable stock. Waiting for a GREEN confirmation and if so there's a potential here!
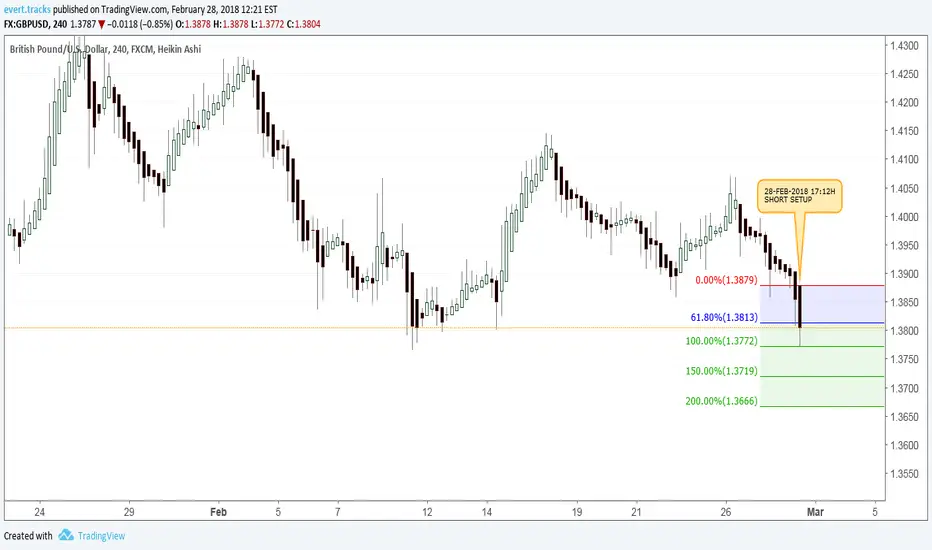
28-Feb-2018 GBPUSD Short HA Setup (4-hr)GBPUSD Short HA Setup
Limit Short
Entry : 1.3812
Stop : 1.3878
R1 : 1.3772
R2 : 1.3719
R3 : 1.3666
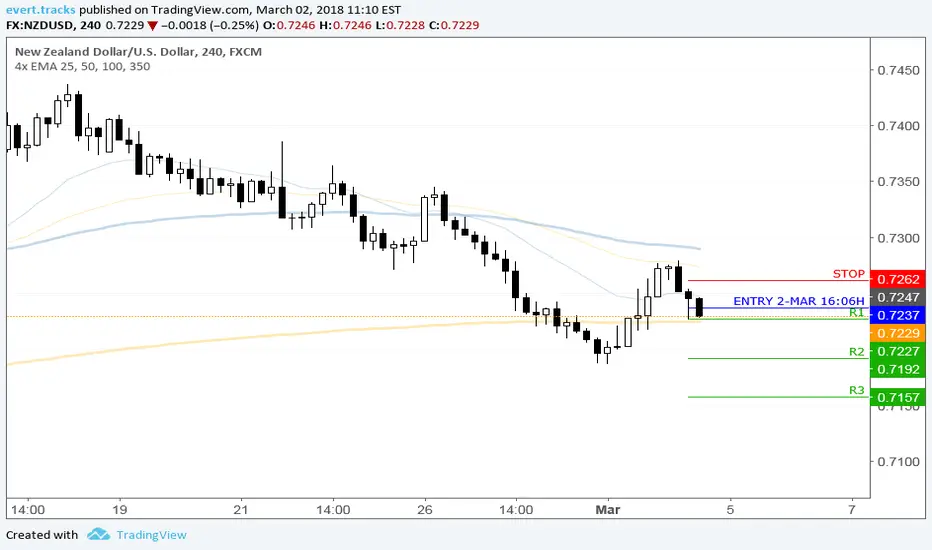
NZDUSD Short 02-Mar-2018 (4hr)Setup: HA Short NZDUSD
Date: 02-Mar-2018
Time: 10:00h
Timeframe: 4hr
Market entry
Entry: 0.7240
Filled: 0.7228
Stop : 0.7262
R1 : 0.7227
R2 : 0.7192
R3 : 0.7157
R4 : 0.7122
HA Analysis
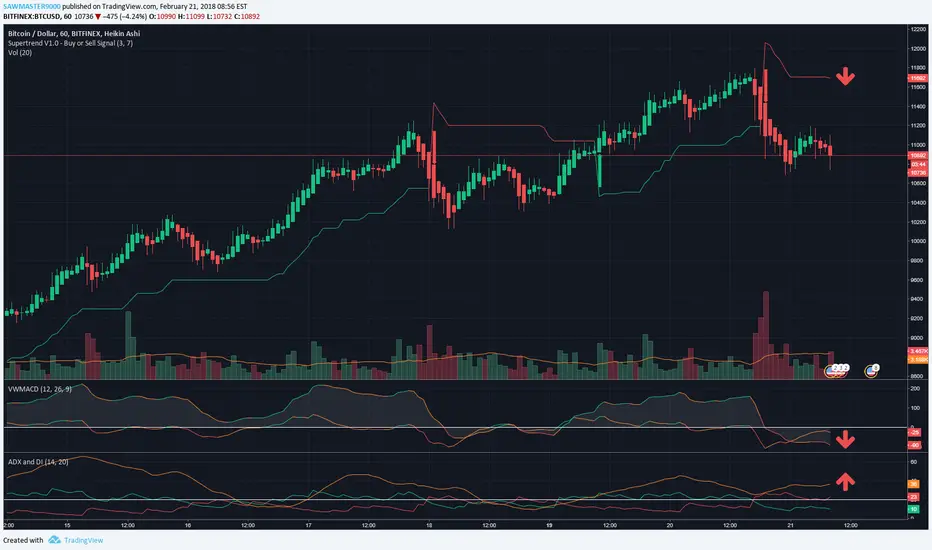
Looking BearishVWMACD is gaining momentum, both short term and long term. Also, ADX is increasing, whilst having DI- higher than DI+, meaning that a bearish trend is forming. In addition, SuperTrend's descending supertrend is beginning to fall. Considering the last few Heikin-Ashi candlesticks have been red, I think it looks bearish.
BTC Retracement to the Tenkan LineCOINBASE:BTCUSD should be pulling back to the Tenkan line as it's been off the Tenkan for a few days now. I had originally thought that pull-back would have already occurred but it appears we are going to head to the bottom of the Kumo Cloud (around $12k) before we get this push back. I do not see us breaking through the Kumo Cloud without retracing back to the Tenkan Line. After we get back to the Tenkan I believe we will make a run up into the Kumo Cloud and test the $14.5k zone.

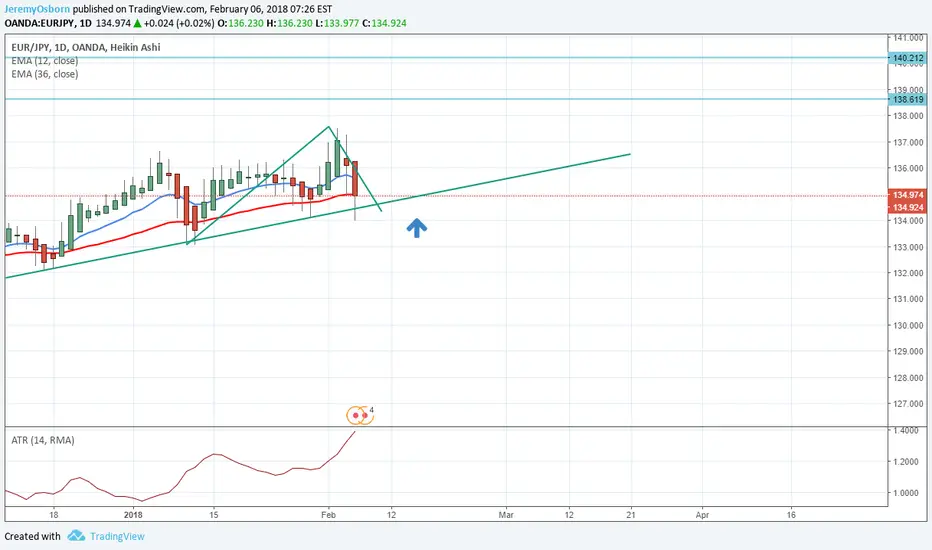
Buy after next 'good' green candle on uptrend continuationTrend continuation. Buy after next 'good' green candle on uptrend.
possible sl: 133.524
1st two targets: 138.619 - 140.212
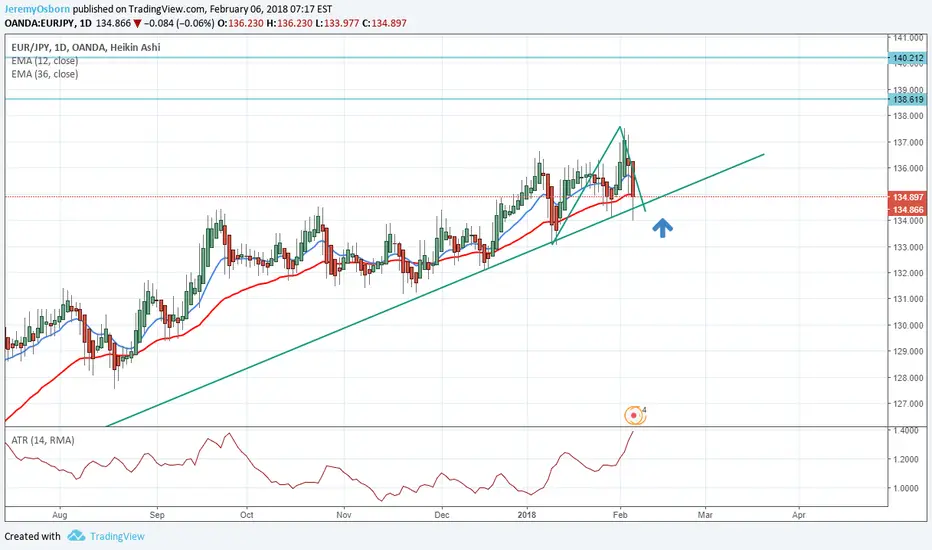
Upward trend continuation for EUR/JPYUpward trend continuation for EUR/JPY. ABC/123 in-play.
Buy at close of the next 'good' green Daily HA candle.
SL: 133.762
1st target: 138.619
2nd target: 140.212
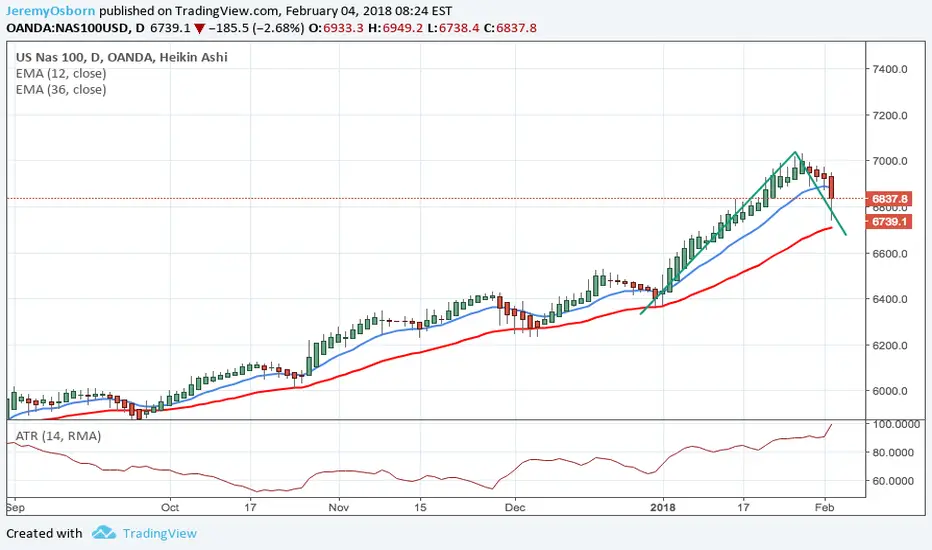
Wait for the next HA green candle to go longClassic 123 / abc. Wait for the next good HN green candle to go long.
1st target: 7021
sl: 6627

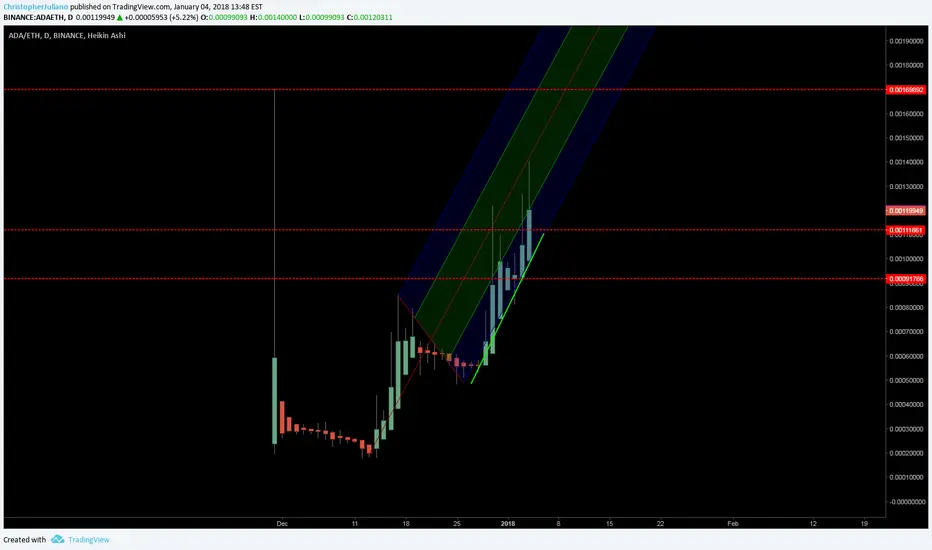
ADA Daily Chart with Strong Heikin Ashi Candles BINANCE:ADAETH
Great buying indication from the Daily Chart using Heikin Ashi Candles, Pitchfork, and trend lines
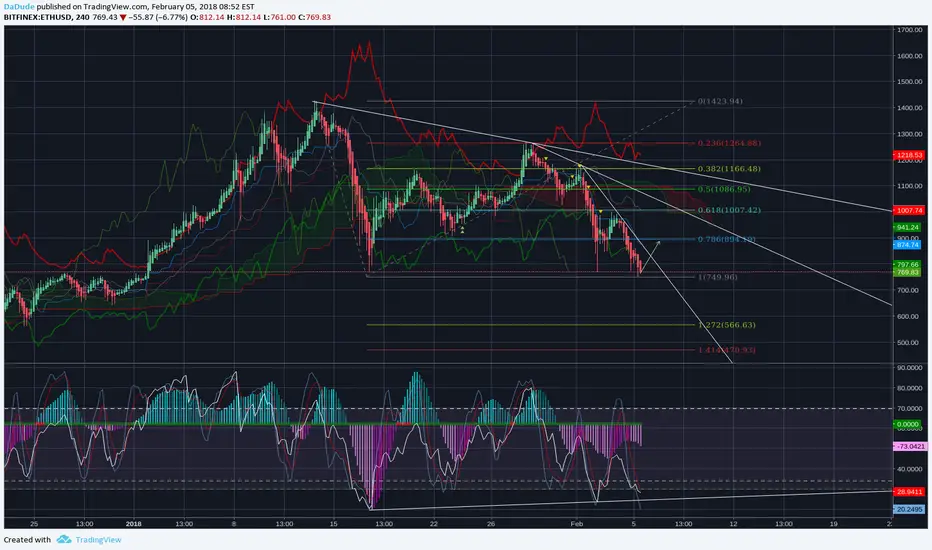
ETHUSD Long after 4h pullback completionEnter long after close of next green, 4h Heikin Ashi candle, likely between 800 and 810. 1st target 846