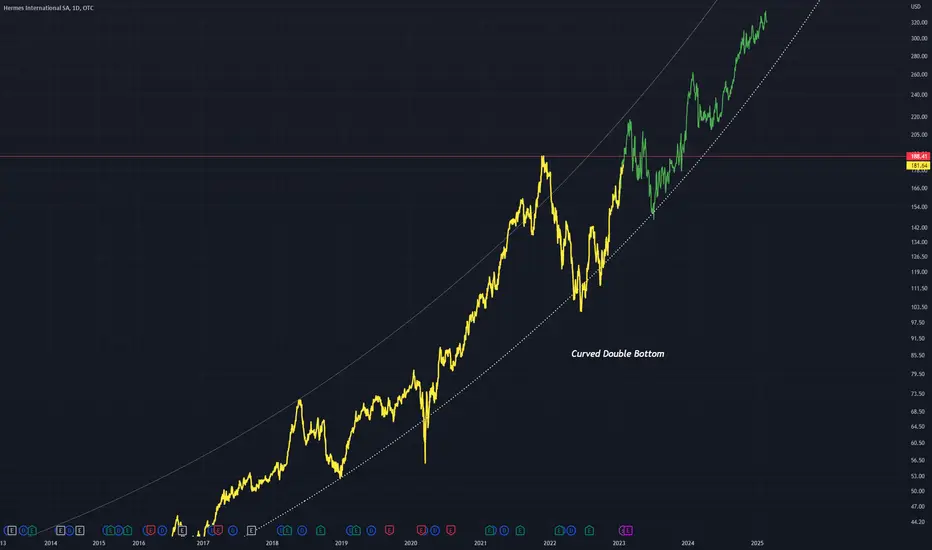
HESAY - Double BottomHESAY on this Logarithmic chart has gone parabolic
A slanted double bottom can be observed
This will push price up towards a double top (red horizontal)
The double top might occur but the parabolic trend will likely not break
Hence the continuation bars pattern in green