Fundamental analysis on PYPL! Disclaimer: I do not hold any PYPL and may not hold them going forward as well. But, 17% drop over earnings got my interest into having a look into fundamentals. Please note all the analysis done here are derived from the scripts I have written - all of them are open source and free to use.
Let's dig deeper.
🎲 Earnings
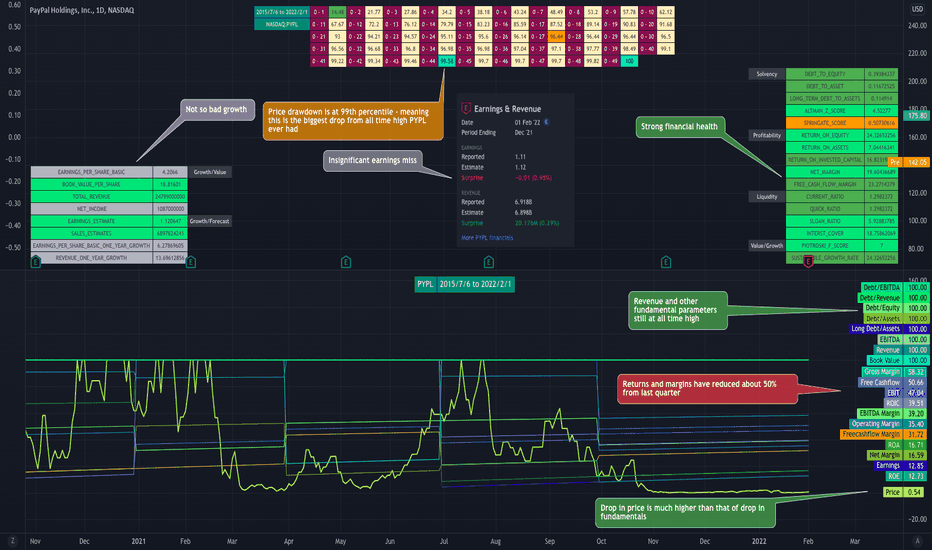
News items highlights poor earnings and economic outlook. While economic outlook is unchanged, earnings can be read as below
Earnings miss by 1% 🟠
Revenue exceeds by 0.29% 🟡
Future earnings is expected to go down by 10% 🔴
Future revenue is expected to drop by 5% 🔴
Overall 10-20% drop can be considered as expected. We need to also keep in mind that for growth based stocks, revenue is more important than earnings. But, we cannot exactly say how much of this is already priced in as the stock had significant drop from last 6 months.
🎲 Financial Health
This is derived from the open source script Quality-Screen . The script colour codes the financial metrics listed based on what is considered as healthy/unhealthy as per norms.
We can say overall health of company is very good. 🟢
🎲 Growth Trajectory
Overall growth trajectory is still up. This is derived from open source script Relative-Growth-Screen . Script plots financial growth parameters on Bollinger bands to identify the overall trajectory over long term. This makes sure that short term weakness in growth numbers does not impact the overall stats.
Overall revenue and book value per share seems to be increasing. However, EPS and YoY revenue growth seems to be stagnating. Reduced revenue can have higher impact on stock price for growth stocks.
With this, we can say overall growth trajectory is mildly low. 🟠
🎲 Drawdown from All time high
Below stat is derived from an open source script Drawdown-Range
The stats percentile dropdown from ATH. As we can see in the outcome. PYPL at present is down 44% from ATH. It is still not considering pre-market price. Otherwise, the drawdown from ATH is 55%. As we can see in the chart, this is at 100th percentile. Which means, very rarely PYPL had such kind of drawdown from its all time high in its history of stock price.
This means, price is at record discount level. Which can be very good for value investors. 🟢
🎲 Drawdown from ATH of fundamentals
This is again another fundamentals based stat derived from the open source script Percentile-Price-vs-Fundamentals
The script compares drop in fundaments with that of drop in price to understand if the price drop is justifiable or if it is an overreaction.
From the details highlighted, it does indeed look like price drop is bit overreaction. 🟢
This stat does not consider earnings and revenue estimates into picture. Hence, the impact of this may be limited if there is huge variation between present earnings and estimated guidance for next earnings.
My views on this stock is neutral as being trend follower, I never try to catch a falling knife. But, if you are looking for value based bargains, this can be good pick for you.
All the best and let me know your views in the comments :)
Hewhomustnotbenamed
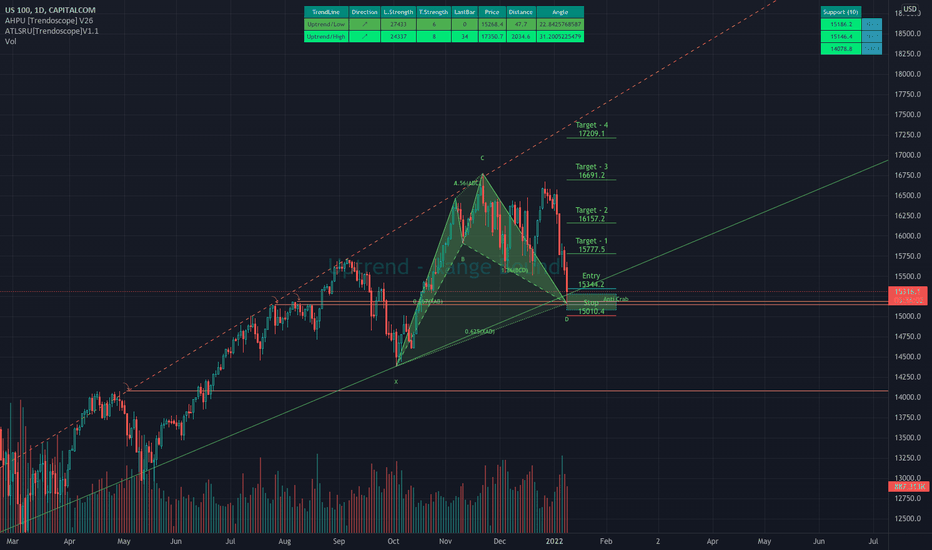
The game is ON!!Negatives
Broken trendline
Unhealthy trend over past two years
Bearish sentiment over increase in interest rate
Positives
Just above a critical support area
In potential reversal zone
Too much bearish sentiment and possible exhaustion
Probabilities
If drops below 15000, can slip another 1k
close above 15350 either today or tomorrow might lead to quick recovery
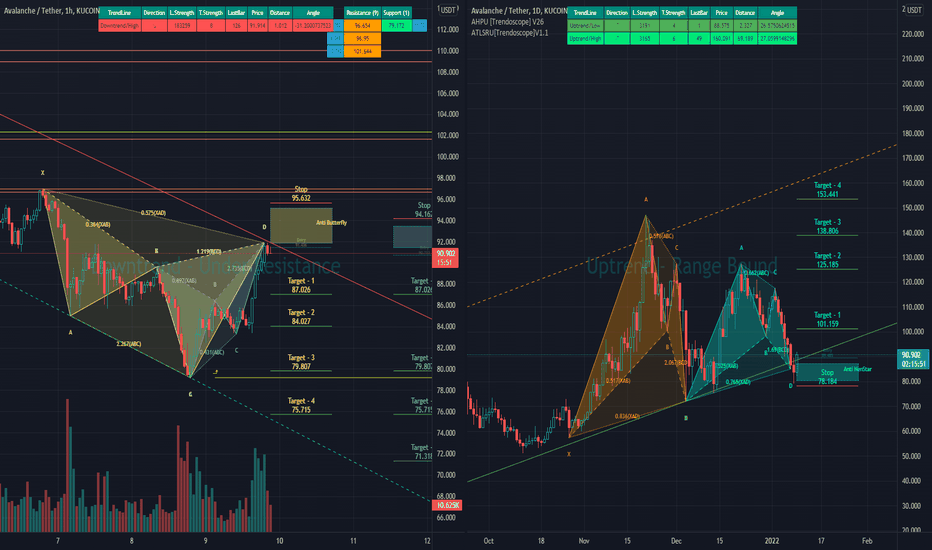
AVAX - interesting situationReally interesting scenario where hourly timeframe has complete opposite trend of daily
If you look at hourly chart,
Clear visible downtrend channel
Price is just below upper trendline of downtrend channel
Multiple bearish patterns suggesting downward price movement
If you look at daily chart,
Clear visible uptrend channel
Price just above lower trendline of uptrend channel
Multiple bullish patterns suggesting upward price movement.
How to play
Go short based on lower timeframe.
Wait for price to hit 79.80 which is target level based on multiple patterns and support line. Daily timeframe stoploss is around 78. Hence, this can be perfect reversal zone. Go long based on HTF once you take profit.
Stop loss around 95.5 - If you hit stoploss shift to long trade based on HTF.
Note that higher time frame position means wider stoploss - may need to adjust the risk accordingly.
Scenarios
Best case : Short position hits take profit level at 79.8 and price reverse to resume daily uptrend.
Worst case : Hit short position stop 95.5 and then go on to hit long position stop at 78.8
Lets see how this plays. I am going with a small risk.
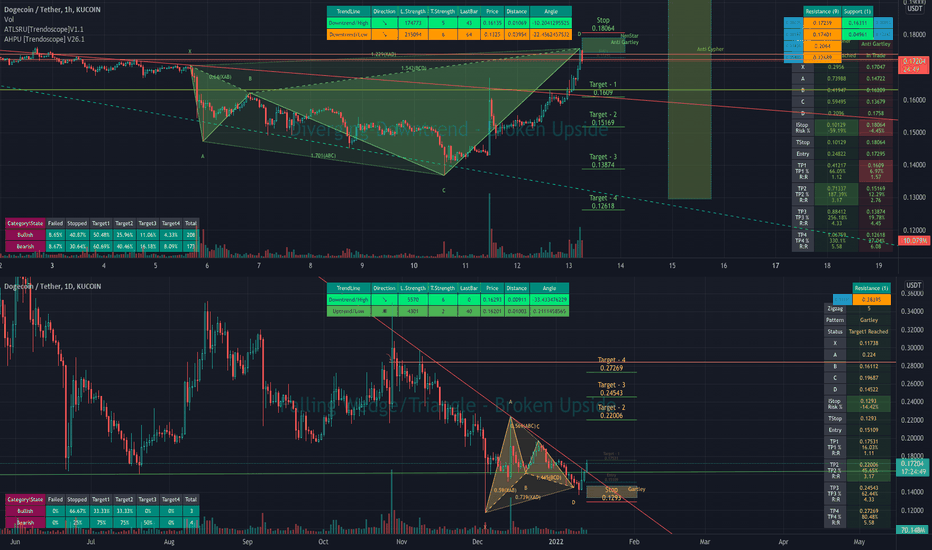
DOGE - Hourly vs DailyDaily Chart - Bullish Sentiment
Broken resistance
Broken declining pivot high trendline
Bullish Gartley pattern setup - but already have run up to target 1
Hourly Chart - Mildly bearish sentiment
Seems to be rejecting under horizontal resistance
High volume on previous extreme candle - may signify temporary exhaustion
Bearish Harmonic Patterns in play
Support ahead from both trend lines and horizontal support level.
Trading plan
Short position followed by long position as shown in the chart below.
You can skip short position and just place a limit order for retest.
Plan B - if short position hits stoploss
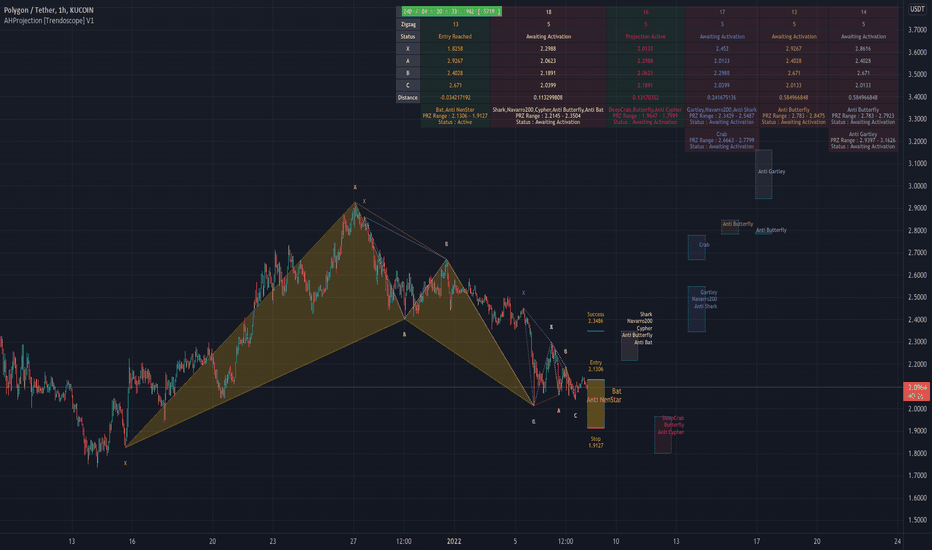
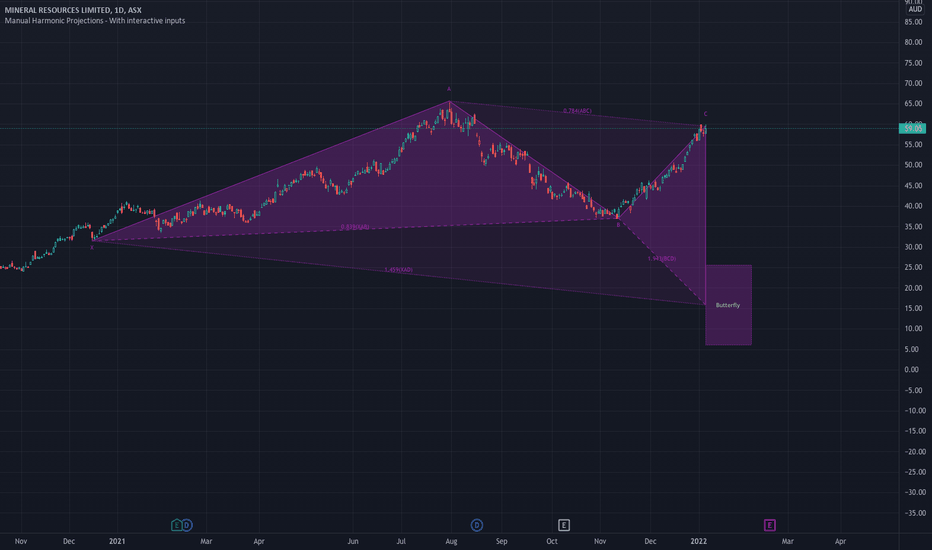
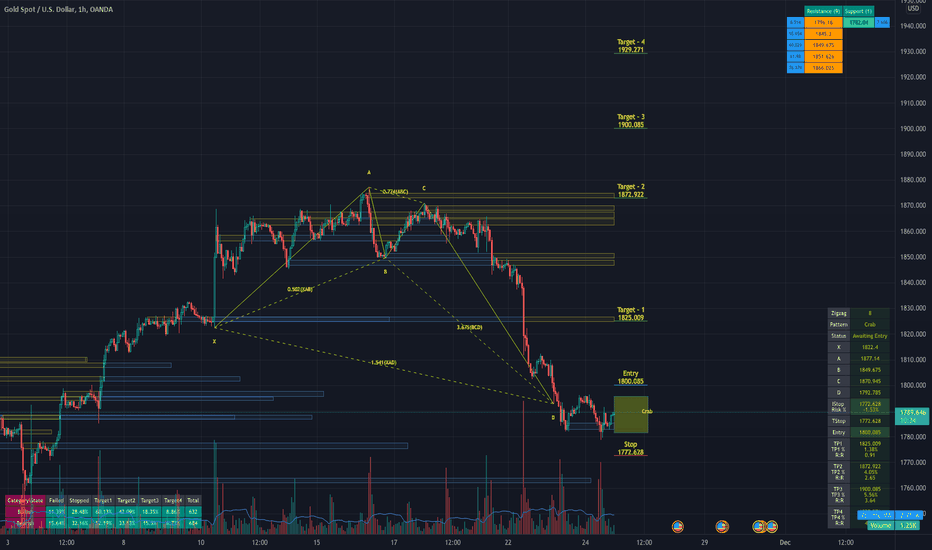
HOW-TO: Auto Harmonic Projections - Ultimate [Trendoscope]Have made this video to give brief demonstration on Auto Harmonic Projections. Hope you enjoy the video and the indicator. Please let me know if you have any questions.
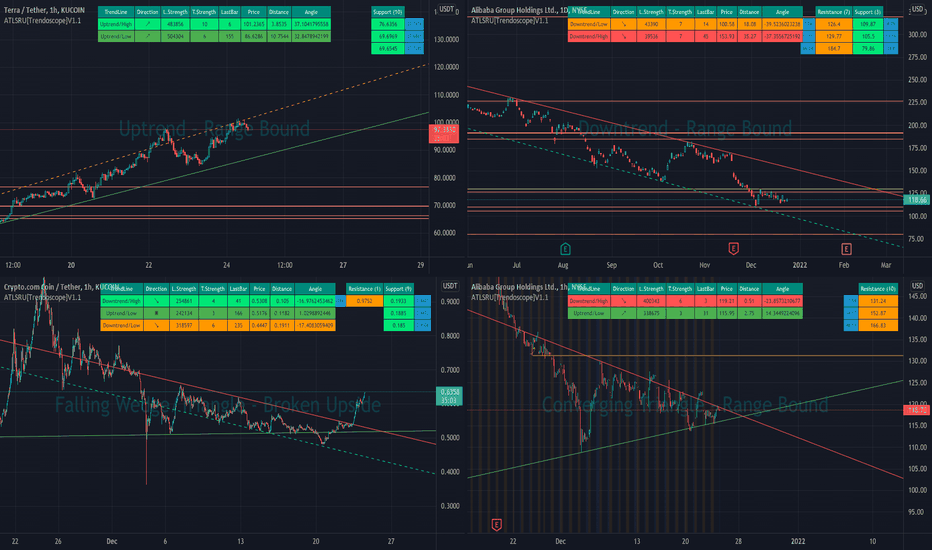
HOW-TO: Auto Trendlines and Support Resistance [Trendoscope]Hello Traders,
This video provides a brief explanation on the latest indicator Auto TrendLines and Support Resistance-Ultimate
Most of the things about settings is already available in the description.
Hope you enjoy the video and learn few things from it. Merry Christmas and Wish you happy new year :)
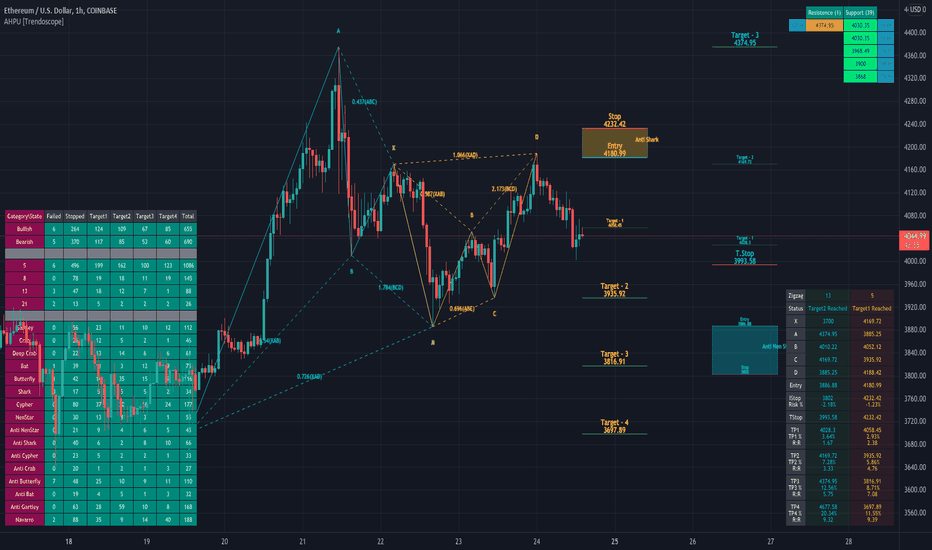
HOW-TO: Auto Harmonic Pattern - Ultimate [Trendoscope]Thanks for watching the video. I will just highlight the key differences between Auto-Harmonic-Patterns-V2 and Auto-Harmonic-Pattern-Ultimate-Trendoscope . Most of the other information is already available in the description of the script. Please read through them and let me know if you have any questions.
Key improvements on new version are:
▶ Whole pattern scanning logic is rewritten based on pine v5 feature to make it more efficient. It uses libraries and other features of pine 5 such as while loop to enhance performance of the scanning
▶ Zigzags - not using multi level zigzags as we found it to be inconsistent and often buggy - specially for harmonic patterns.
▶ Wait for confirmation flag is removed permanently. @CryptoArch_ has convinced me that we should not use this for harmonic patterns
▶ Search depth - Higher search depth and vairable search depth based on zigzag
▶ Optimized target and trailing based on each individual patterns
▶ More options for enabling/disabling patterns
▶ Support and resistence information and ability to use it for pattern filtering
▶ Improved stats for open and closed trades
