THETA TOKEN HAS HIDDEN BULLISH DIVERGENCETHETA TOKEN: HIDDEN BULLISH DIVERGENCE
IN THIS WEEKLY CHART. Theta has been super bullish for nearly 600 days, yes we
did see a long consolidation period, but its coming to a decision time on
the weekly chart. looking at the RSI, its about to break resistance and
remain bullish for a large move up. If history would repeat itself, look
at the projected numbers from a bars pattern perspective. Another note
is that THETA LABS is the only crypto that has the patents to expand
broadband internet. They have said to have nearly 100 patents in the
future. just looking at the chart and some fundamentals. not advice, just
charts here. If you look at what Solana has done, these #'s are possible.
look at the comments listed on the chart for more details.
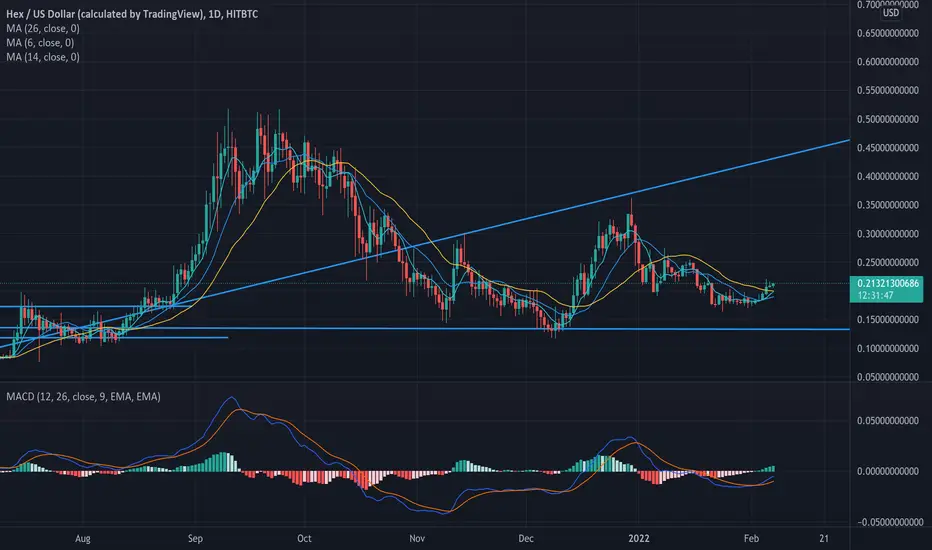
HEX

BCH weekly chart still Intact?BCH on the weekly chart is still intact. The DeMark 9 indicator reads
it has hit the bottom.
If BCH can get some buying volume, it has to break the Hull Suite Indicator
and it then can move up to above trendline and
pursue its way to previous 2021 Highs at $1600. BCH must not break support
at $336 and then $248, I dont believe it will happen but the RSI is at the bottom
of the trendline as well.

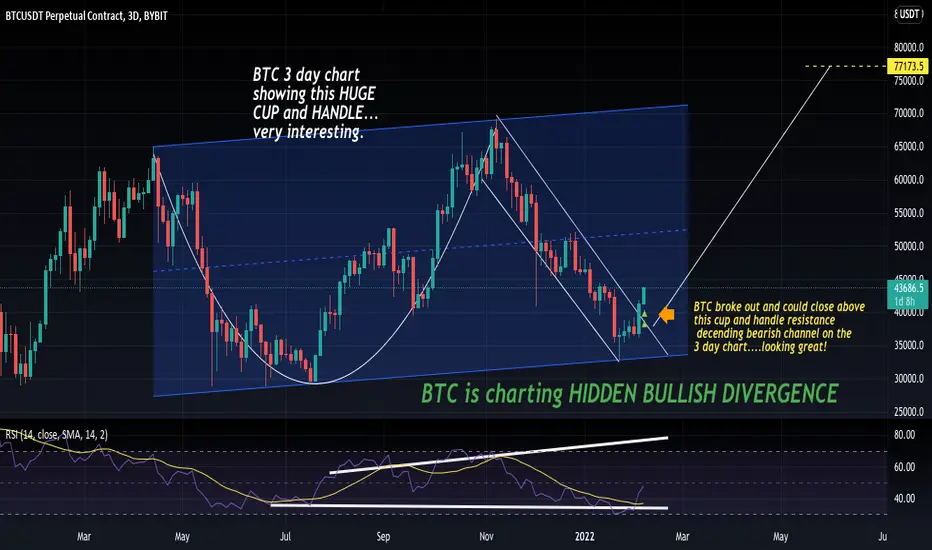
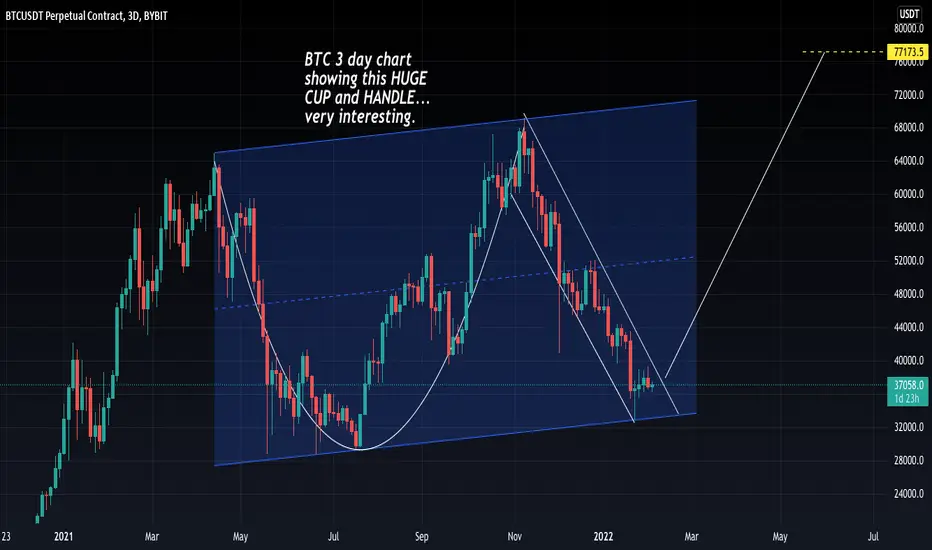
BTC 3 day Huge Cup and Handle UpdateBTC 3 day chart
showing this HUGE
CUP and HANDLE...
very interesting. more notes listed on the chart
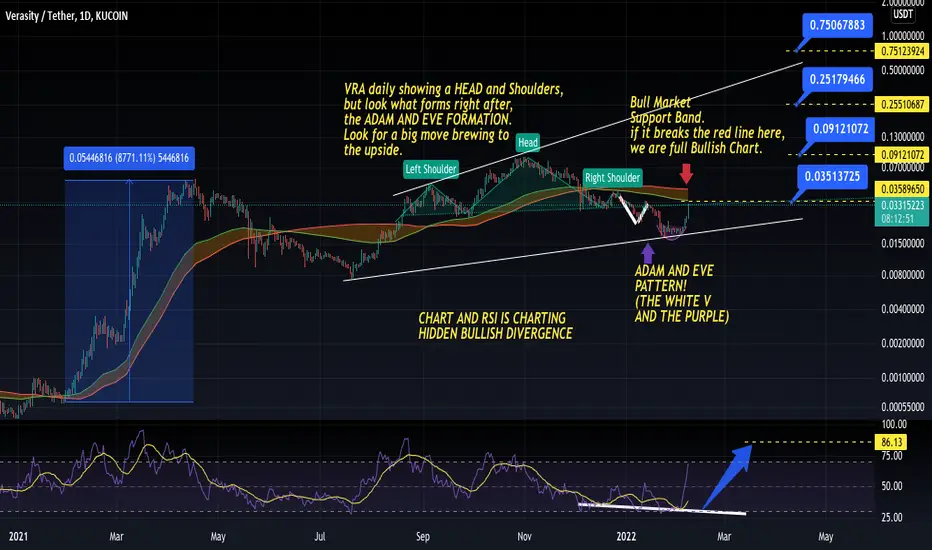
VRA daily showing Head and Shoulders and Adam and EveVRA daily showing a HEAD and Shoulders,
but look what forms right after,
the ADAM AND EVE FORMATION.
Look for a big move brewing to
the upside. I HAVE OTHER NOTES ON THE CHART
TAKE A CLOSE LOOK
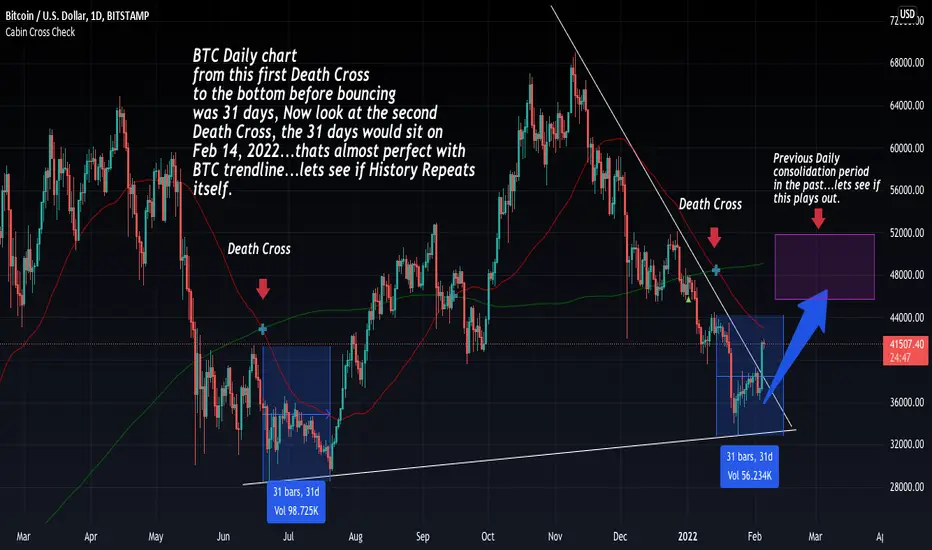
BTC death cross technicals are playing outBTC death cross technicals are playing exactly as i charted thus far....the key date is February 14th, that would be the last day "technically" where the death cross method would end...it should be bullish into the purple box before next leg.

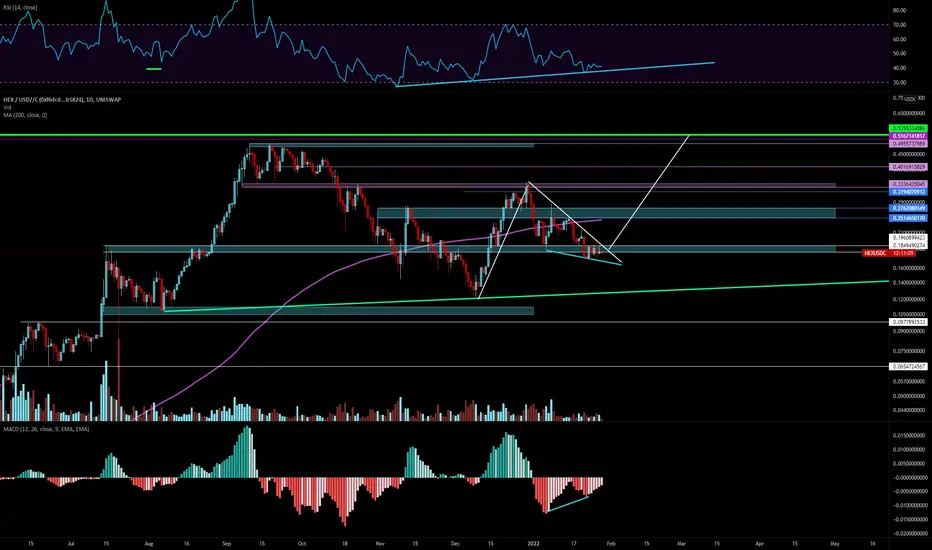
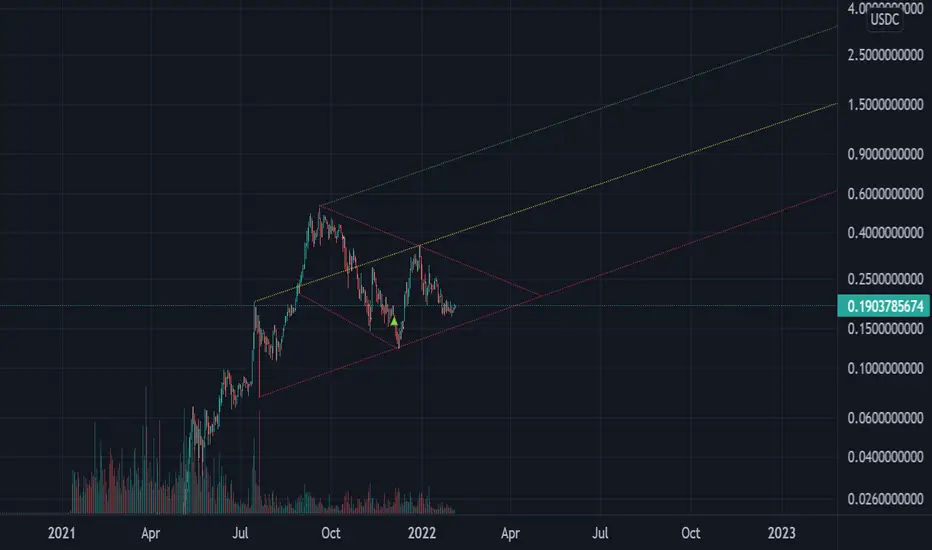
HEXUSD ForecastingHi fellow traders,
Since Hex is relatively young, hence it's harder to analyze. Once we have more data, we'll be able to do more accurate predictions. For now this all I got.
We have a huge symmetrical triangle forming. There are more bull flags forming in the short term. Overall I'm pretty bullish actually.
The blue dashed lines are possible price action trend trajectory. Higher the opacity, higher the chance of happening.
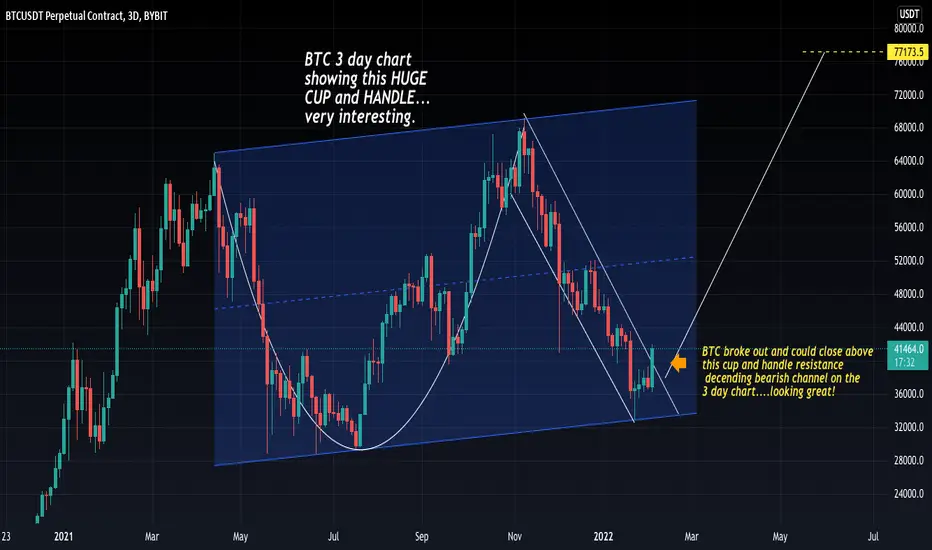
BTC HUGE CUP AND HANDLEBTC broke out and could close above
this cup and handle resistance
decending bearish channel on the
3 day chart....looking great!
BTC death cross theory looking amazingBTC Daily chart
from this first Death Cross
to the bottom before bouncing
was 31 days, Now look at the second
Death Cross, the 31 days would sit on
Feb 14, 2022...thats almost perfect with
BTC trendline...lets see if History Repeats
itself.
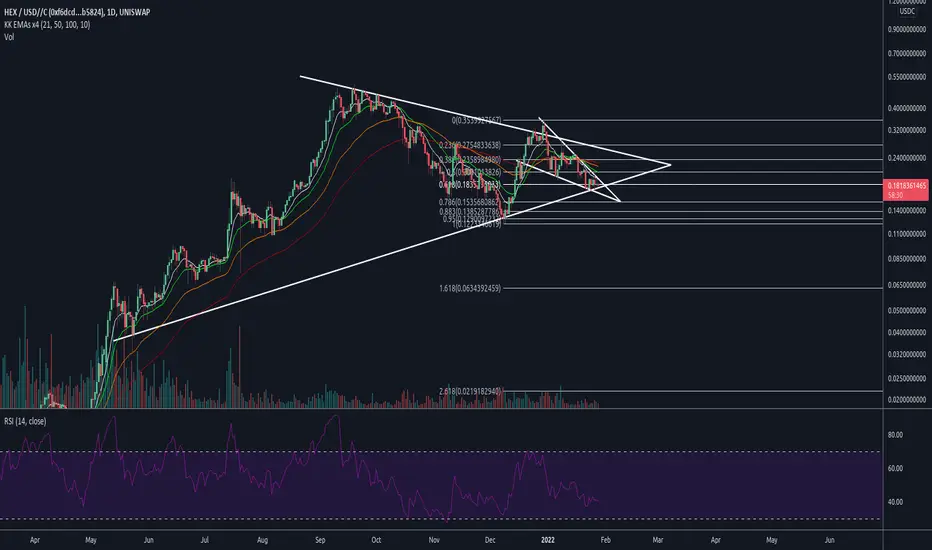
Hex patterns on the daily...Hi all, not an expert by any means, fairly new to reading charts (6 months) and for sure not financial advice.
I've applied a new trend line on the daily chart with a top middle and bottom, showing where price seems to find support or resistance. I have a feeling the long term trend line is broken (lets be honest is couldn't continue that way forever). I see the downward channel is still in play but the (new) longer term trend line is being honored. So I am keeping a close eye on the formation - expecting some kind of breakout from the downward channel in the near future.
HEX 3 day chart looking bullish as everHEX 3 day chart looking Phenomenal. Continues to
stay in the bullish channel for over 2 years. HUGE
things for this token including the launch of
PULSECHAIN and PULSEX. HEX needs to bust thru
the Hull Suite Indicator and make the next leg up.
Im sticking to my chart and with the fundementals,
I see HEX hitting all time highs within the next 3-4
weeks. too much amazing things happening
with this eco-system.

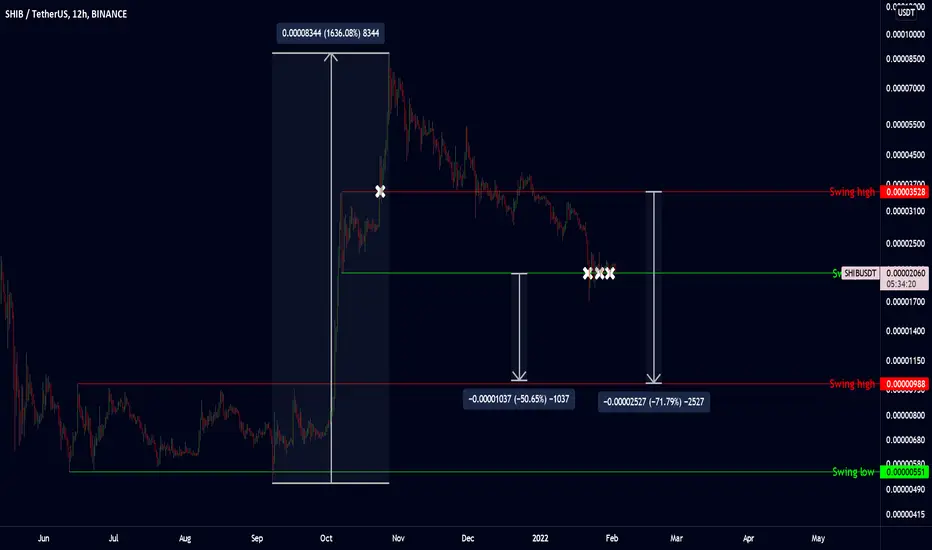
SHIB bearish, don't look at this chart!!! 6-Month TragedyI'm not short but i'm definitely not touching this.
Most of the tokens #altcoins look really sad.
Gains have already been made. Prepare for bear market.
The only thing worth being in besides maybe a stable coin is a $HEX stake! #HEX
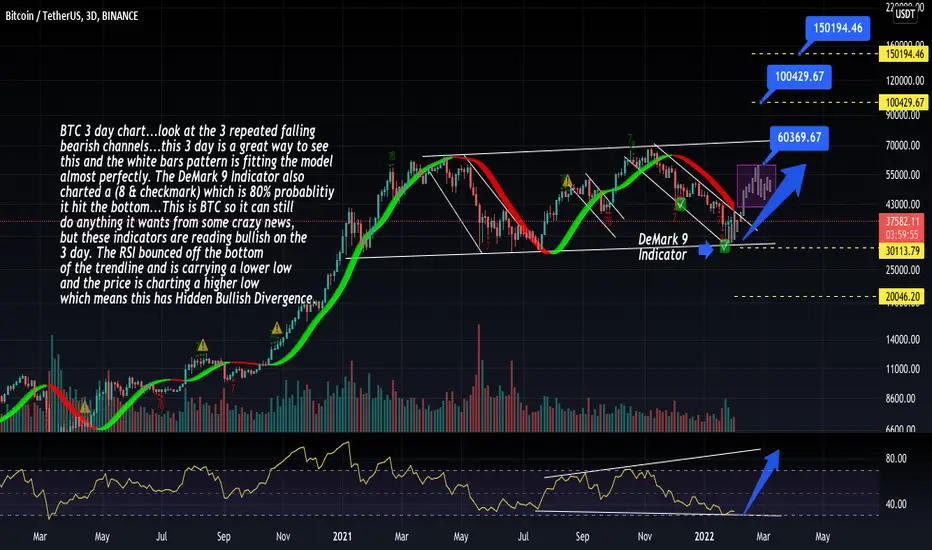
BTC 3 day chart looking bullish?BTC 3 day chart...look at the 3 repeated falling
bearish channels...this 3 day is a great way to see
this and the white bars pattern is fitting the model
almost perfectly. The DeMark 9 Indicator also
charted a (8 & checkmark) which is 80% probablitiy
it hit the bottom...This is BTC so it can still
do anything it wants from some crazy news,
but these indicators are reading bullish on the
3 day. The RSI bounced off the bottom
of the trendline and is carrying a lower low
and the price is charting a higher low
which means this has Hidden Bullish Divergence.
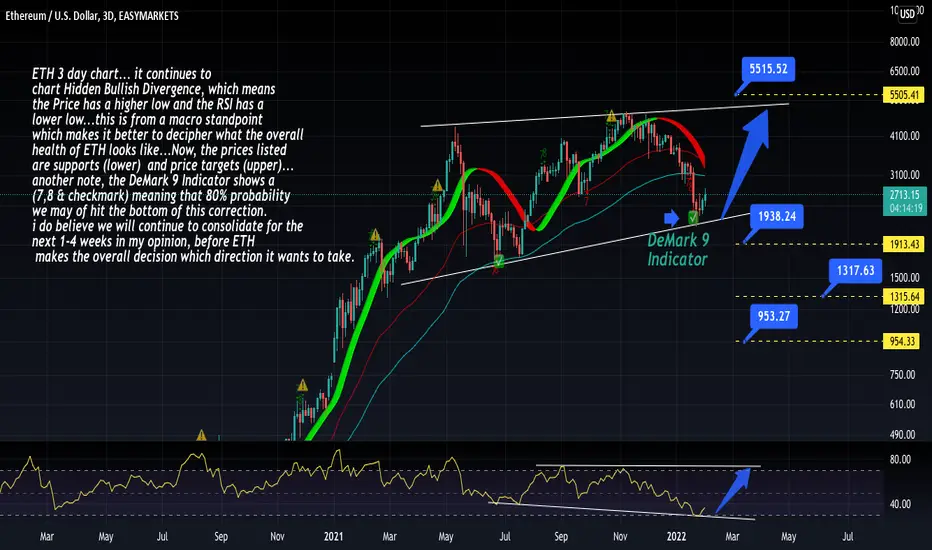
ETH 3 day chart looking bullish?ETH 3 day chart... it continues to
chart Hidden Bullish Divergence, which means
the Price has a higher low and the RSI has a
lower low...this is from a macro standpoint
which makes it better to decipher what the overall
health of ETH looks like...Now, the prices listed
are supports (lower) and price targets (upper)...
another note, the DeMark 9 Indicator shows a
(7,8 & checkmark) meaning that 80% probability
we may of hit the bottom of this correction.
i do believe we will continue to consolidate for the
next 1-4 weeks in my opinion, before ETH
makes the overall decision which direction it wants to take.
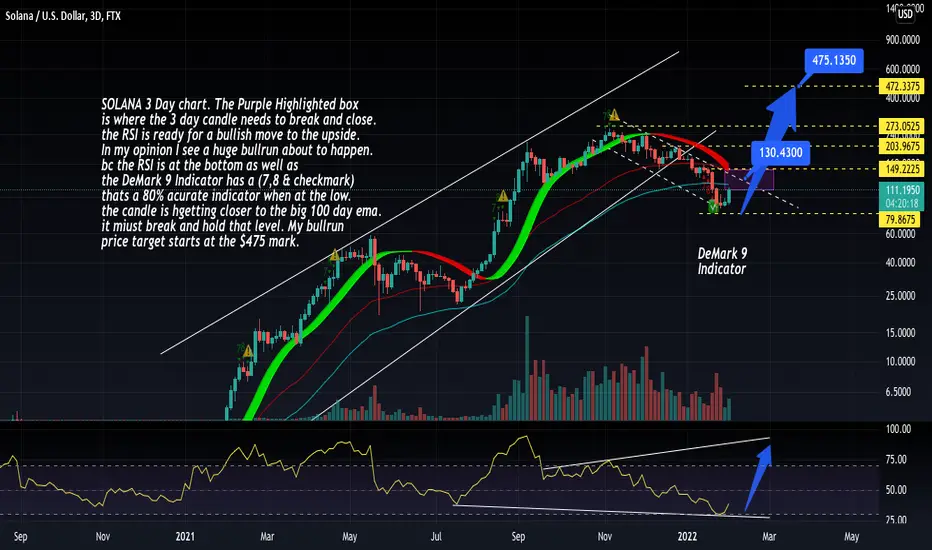
SOLANA 3 day chart looking bullishSOLANA 3 Day chart. The Purple Highlighted box
is where the 3 day candle needs to break and close.
the RSI is ready for a bullish move to the upside.
In my opinion I see a huge bullrun about to happen.
bc the RSI is at the bottom as well as
the DeMark 9 Indicator has a (7,8 & checkmark)
thats a 80% acurate indicator when at the low.
the candle is hgetting closer to the big 100 day ema.
it miust break and hold that level. My bullrun
price target starts at the $475 mark.
The Hex price dipped perfectly into my blue boxIn this TA I showed that the HEX price was about to briefly dip into a buy zone before taking off for new all-time highs.
Did anyone buy this dip? Enjoy all your profits if you did. :) (this is not financial advice, just an opinion)
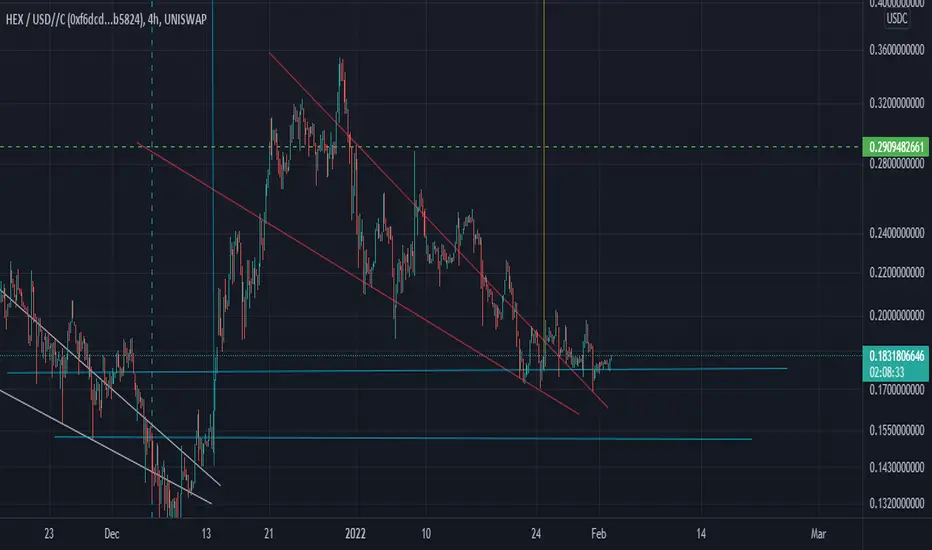
HEX quick updateIn the past couple of months ,HEX chart already looked like AIDS .Now AIDS got Cancer to .It`s bad . I`s very bad...Price got rejected from daily 21 EMA multiple times .
This EMA is sloping down on every time frame. Even on the weekly . This is full blown-bear market.
Price is resting on.17-.18c ,which, as you already know from my last updates ,is support .
This support was tested over and over again and now I expect to break in a big way!
Target1: 0.085c
Invalidation :23.5c.Anything under .23c (and thats on a weekly candle close) is a dead cat bounce and price will most probably fall into a death spiral.

CRO daily chart still intact?CRO (Crypto.com) daily chart still looking intact?
Im staying Nuetral at the moment bc its charting a
bear pennant but the RSI had hit the very bottom,
and the DeMark 9 Indicator aslo is reading it
hit the very bottom which is a 80% probablilty,
that Bars Pattern you see would be what it looks like
if the same bull run it has had in the past would repeat
again. look how it matched exaclty up where
the DeMark showed that its ready to move upward.
the price targets are shown on the right side above
the current price, supports are listed on the right below
the current price. Im actually leaning more bullish
than bearish...I see us begin to move upward from now to the next 4 wweks
for a bull run..

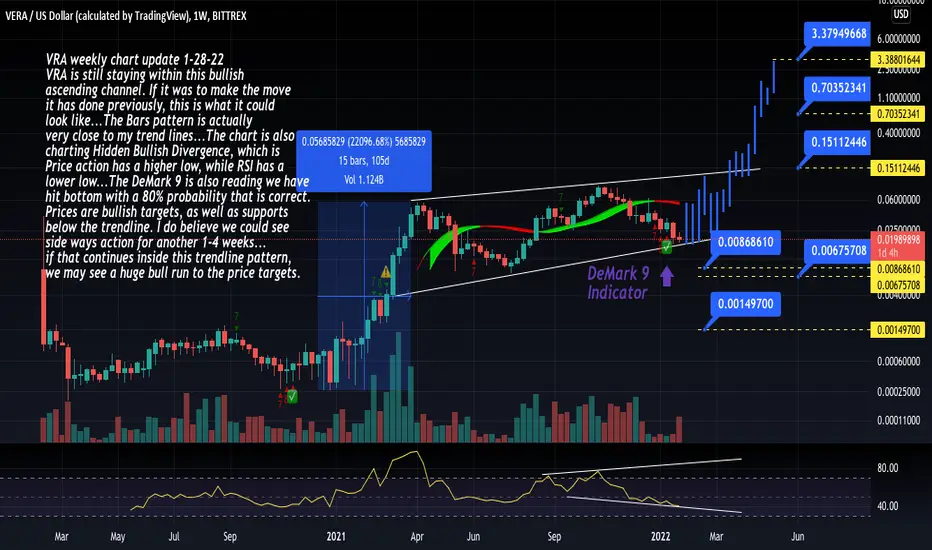
VRA weekly chart is it intact for a bullrun?VRA weekly chart update 1-28-22
VRA is still staying within this bullish
ascending channel. If it was to make the move
it has done previously, this is what it could
look like...The Bars pattern is actually
very close to my trend lines...The chart is also
charting Hidden Bullish Divergence, which is
Price action has a higher low, while RSI has a
lower low...The DeMark 9 is also reading we have
hit bottom with a 80% probability that is correct.
Prices are bullish targets, as well as supports
below the trendline. I do believe we could see
side ways action for another 1-4 weeks...
if that continues inside this trendline pattern,
we may see a huge bull run to the price targets.
HEX ApexHex is now coming up to an apex between a shorter term descending wedge in a greater symmetrical triangle. It's also currently sitting on the 0.618 of the most recent wave. Expect movement soon! Looks more bullish than most of the crypto sphere.
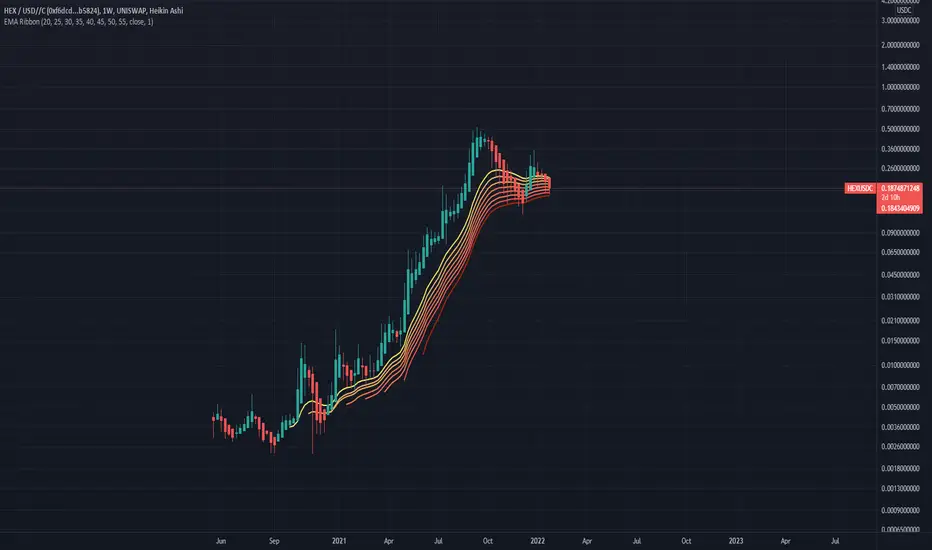
HEX EMA Ribbon ModelHi there!
The Weekly HEX EMA Ribbon Model Shows where support areas are. So far EMA 55 would be the last level to hold that formation to the topside.
The model shows that every time price gets back into Ribbon, it finds more support here!
Take it easy!
HEX LongJust looking at the only thing that isn't completely dead, still has some signs of life..
12 hour and daily bullish div on macd and falling wedge take this with a grain of salt just an idea.