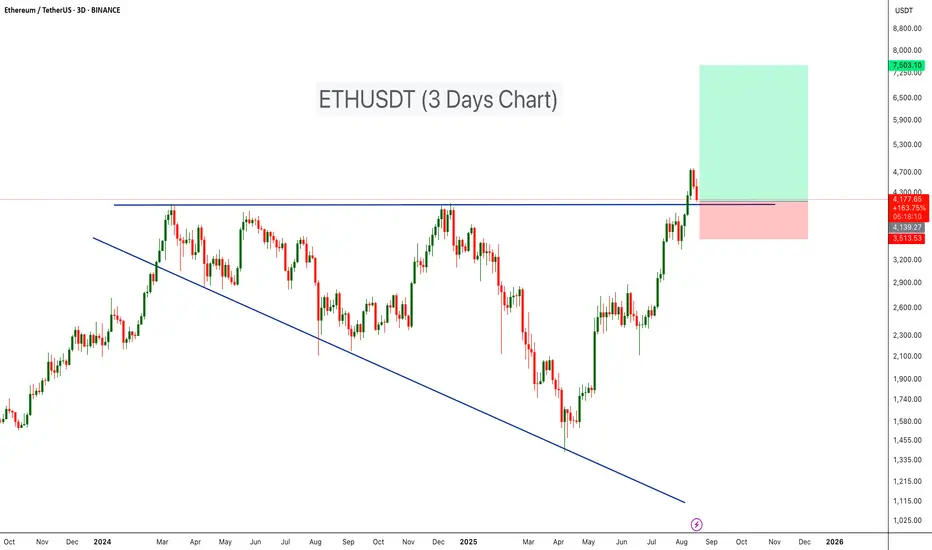
Ethereum Retesting Major Breakout ZoneBINANCE:ETHUSDT has completed a major breakout from a Broadening Wedge Pattern and is now retesting the wedge’s resistance line as support — a bullish continuation signal on the higher timeframe.
- Broadening Wedge Formation: ETH traded within a large broadening wedge throughout 2024 into early 2025, forming expanding highs and lows.
- Breakout Confirmation: The breakout above wedge resistance ($4,10) confirms bullish momentum and shifts market structure in favor of buyers.
-Retest in Progress: Price is currently pulling back, testing the former wedge resistance as fresh support — a textbook technical setup.
-Volume Validation: The breakout was accompanied by a surge in volume, strengthening the case for continuation.
🔷Entry Zone: $4,100 – $4,300
🔷Stop Loss: Below $3,500 to protect against a failed retest.
🔷Targets: $6,500 – $7,500
Cheers
Hexa
Hexatrades
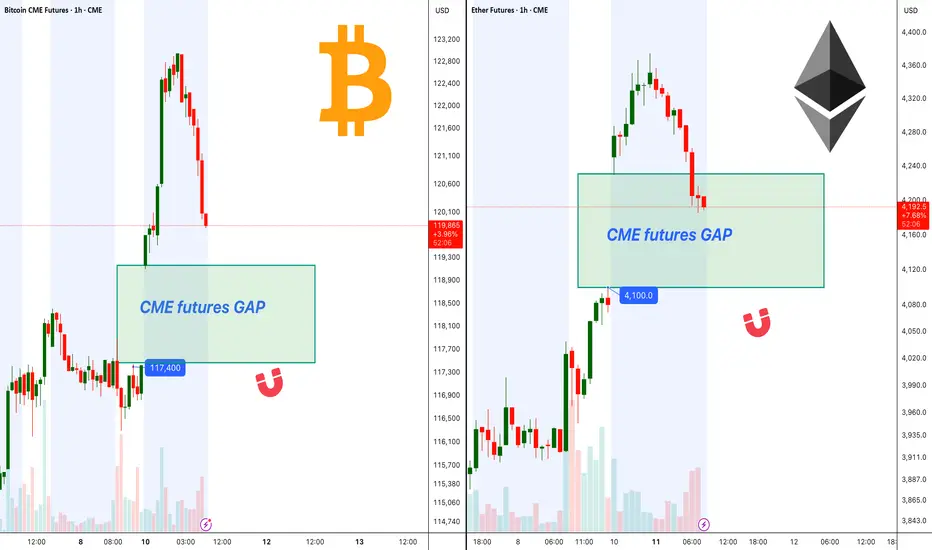
BTC, ETH CME Gaps Could Fill Before Bullish Continuation!Ethereum CME futures currently show a visible gap around $4,100 . Price is approaching this level, and based on historical behavior, CME gaps often act as magnets, drawing price in to fill them before a continuation in trend.
Bitcoin CME futures also have a gap sitting near $117,400. The recent rally has brought BTC close to this zone, increasing the probability of a short-term retracement to fill the gap before any significant breakout attempts.
Both gaps are key areas to watch, as a clean fill followed by strong buying pressure could set the stage for the next bullish wave in BTC and ETH.
Cheers
Hexa
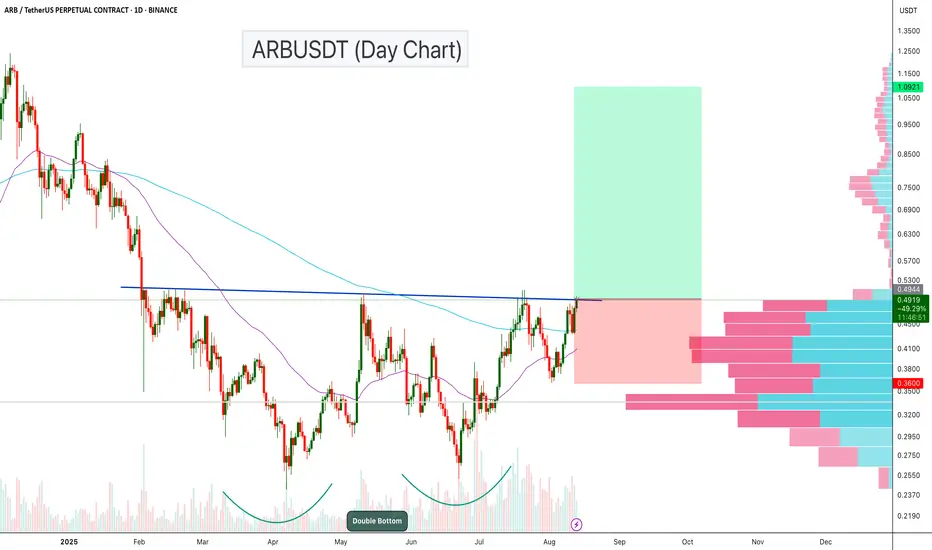
ARBUSDT – Double Bottom Breakout Loading?ARBUSDT is showing a strong bullish structure on the daily chart, with a classic Double Bottom pattern forming over the past few months. Price is now pressing against the neckline resistance, which, if broken, could trigger a powerful upside move.
Key Points:
Double Bottom Formation: The pattern started in April 2025 and completed its second bottom in July, indicating a potential long-term reversal setup.
Neckline Resistance: Price is currently testing the $0.49–$0.50 zone, which aligns with previous swing highs and marks the breakout level for the pattern.
Volume Profile: The visible range volume profile shows low-volume nodes above $0.50, suggesting a potential “thin air” move toward higher targets if the breakout is confirmed.
The chart is setting up for a potential trend reversal. A confirmed breakout from the double bottom neckline could propel ARBUSDT toward the $1+ zone
Cheers
Hexa
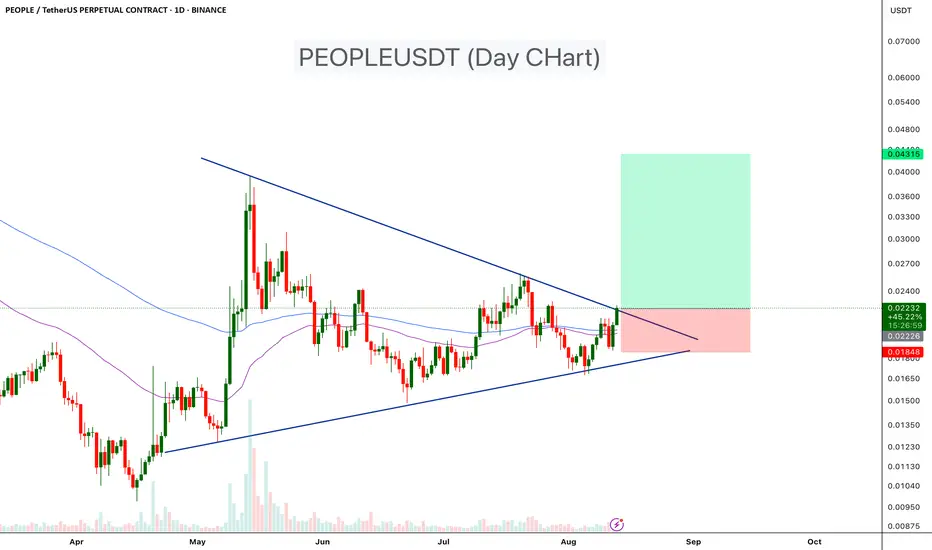
PEOPLEUSDT Breaking Out of Multi-Month Triangle!PEOPLE is currently showing a bullish breakout from a Symmetrical triangle resistance on the daily chart, accompanied by increasing volume.
Technical Highlights:
-Pattern: Symmetrical triangle formation that has been developing since early May.
-Breakout: We can confirm the breakout once the day's candle closes above the trend resistance line
-Moving Averages: Trading above the 50 EMA and 100 EMA.
-Volume: Noticeable spike in buying volume, confirming breakout strength.
If bullish momentum sustains above the breakout zone, we could see a 50-100% bullish move coming weeks.
Stop loss : $0.0185
Resistance 1: $0.0255
Resistance 2: $0.0305
Resistance 3: $0.0430
Cheers
Hexa
Disclaimer: This analysis is for educational purposes only and not financial advice. Always do your own research and manage risk accordingly.
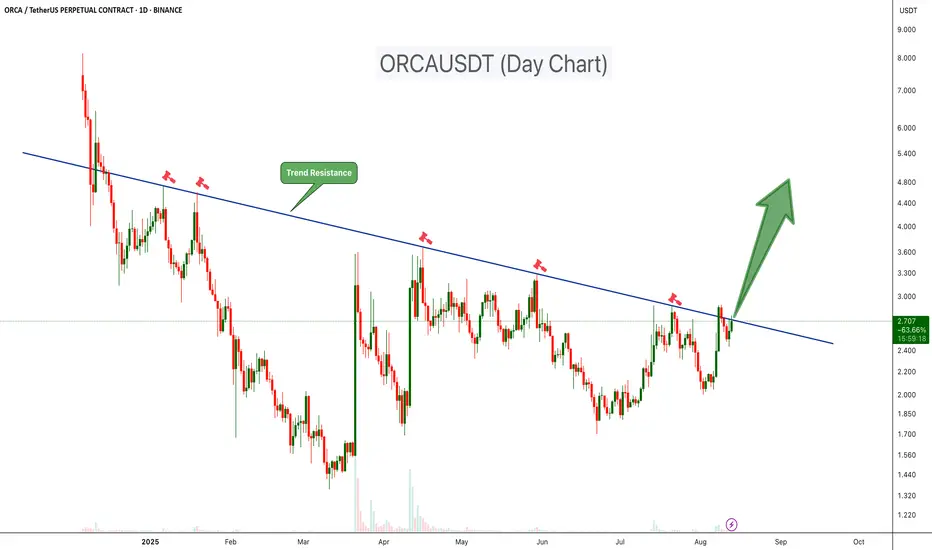
ORCAUSDT at Key Trendline: Big Move Loading!ORCAUSDT has been trading under a clear descending trendline resistance since late 2024, with multiple failed breakout attempts marked by sharp rejections. This trendline has consistently acted as a strong supply zone, pushing prices lower each time it was tested.
Key Points:
-Trend Resistance: Price is once again testing the long-term descending trendline. This level has rejected rallies multiple times in the past (January, March, May, and early August 2025).
-Volume Pickup: Recent price action shows increasing bullish volume, suggesting growing buying pressure as the resistance level is approached.
-Potential Breakout Setup: A strong daily close above $2.90 could signal a confirmed breakout, flipping long-term resistance into support.
Upside Target: If a breakout is confirmed, we could expect a 50%-200% move coming weeks
Risk Factor: A rejection from this zone could see price revisit support at $2.20–$2.00 before any renewed attempt higher.
Buy Level: Above $2.90 (After daily breakout)
ORCA is at a crucial decision point. This is the fifth test of the descending trendline since early 2025; a breakout now could trigger a significant bullish move, while another rejection may extend the consolidation phase.
Cheers
Hexa
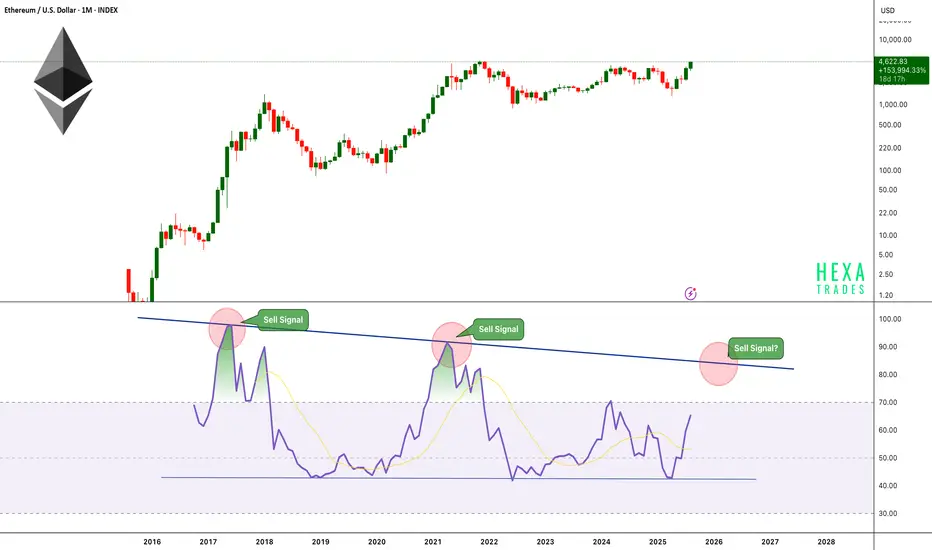
ETH Monthly RSI Approaches Cycle Top? Ethereum is showing strong momentum on the monthly timeframe, pushing toward levels not seen since its previous all-time highs. However, a critical technical indicator, the Monthly RSI is currently at 65 and steadily approaching its historically reliable sell zone between 83–85.
Key Observations:
-The monthly RSI has been capped by a descending trendline resistance since 2017.
-Each time RSI touched this resistance — in 2017 and 2021 — ETH reached a cycle peak, followed by a significant multi-month correction.
-Price is rallying strongly, but RSI still has room to rise before hitting the critical 83–85 zone.
Historical Pattern:
-2017: RSI rejection led to a ~90% decline.
-2021: RSI rejection triggered a ~75% drawdown.
-Now (2025): RSI is climbing toward this zone for the third time, potentially signaling a major profit-taking window once reached.
When the RSI reaches the trend resistance level of 83–85, the price could potentially touch the $7,500–$9,000 range.
Cheers
Hexa
SLERFUSDT Triangle Squeeze – Breakout Imminent!SLERFUSDT has been trading inside a symmetrical triangle formation on the daily chart since April 2025, with higher lows meeting lower highs as price coils toward the apex. This tightening price action often leads to a decisive breakout in either direction once volatility returns.
Currently, SLERF is testing the triangle’s upper trendline near the $0.086 level. A decisive daily close above this resistance, backed by strong volume, would confirm a bullish breakout, potentially opening upside toward $0.105, $0.135, and $0.18.
Cheers
Hexa

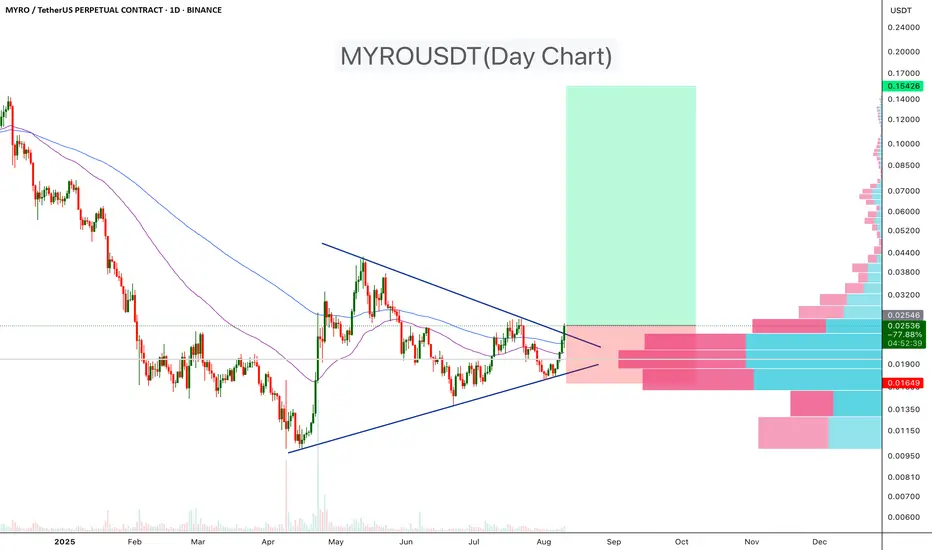
MYROUSDT Bullish Breakout Above Triangle Resistance!MYROUSDT has been trading within a symmetrical triangle pattern for the past few months. Today, the price has broken above the upper trendline, signaling a potential bullish breakout. The breakout is supported by increased volume and a clear move above both the 50-day and 100-day EMAs, suggesting strengthening bullish momentum.
Pattern: Symmetrical Triangle (Bullish breakout)
Breakout Confirmation: Price closed above the upper trendline with increased volume
Moving Averages: Trading above the 50 EMA and 100 EMA – bullish bias
Target: 150%–500%
Stop-loss: Below triangle support (~$0.0165)
Cheers
Hexa
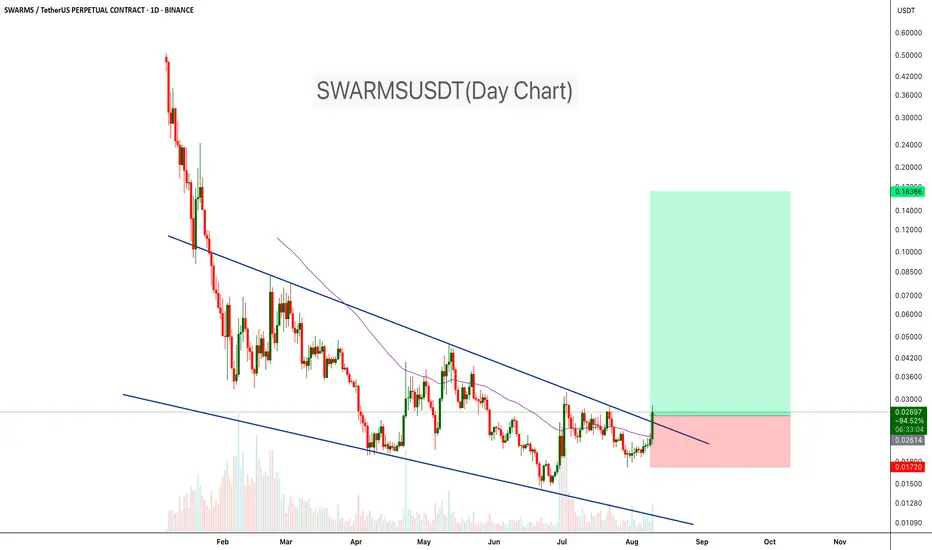
SWARMS Breaks Out of Descending ChannelSWARMSUSDT has been trading within a descending channel since February, with price consistently respecting both the upper resistance and lower support trendlines. Recently, the market broke above the channel’s resistance with a strong bullish candle, backed by a noticeable increase in buying volume. Once the breakout confirms, we can expect a 150%- 500% move in the coming weeks.
Resistance 1: $0.040
Resistance 2: $0.075
Resistance 3: $0.16
Support level: $0.017
Cheers
Hexa
Bitcoin Traps Bulls and Bears – Real Move Next?Bitcoin is trading in a descending channel on the 4H chart, with two recent fakeouts — one above resistance and one below support — trapping traders on both sides. After reclaiming support, BTC is pushing toward the upper boundary with rising volume, hinting at strong demand. A breakout above $119K could drive a rally toward $125K–$135K.
Cheers
Hexa
BINANCE:BTCUSDT BITSTAMP:BTCUSD

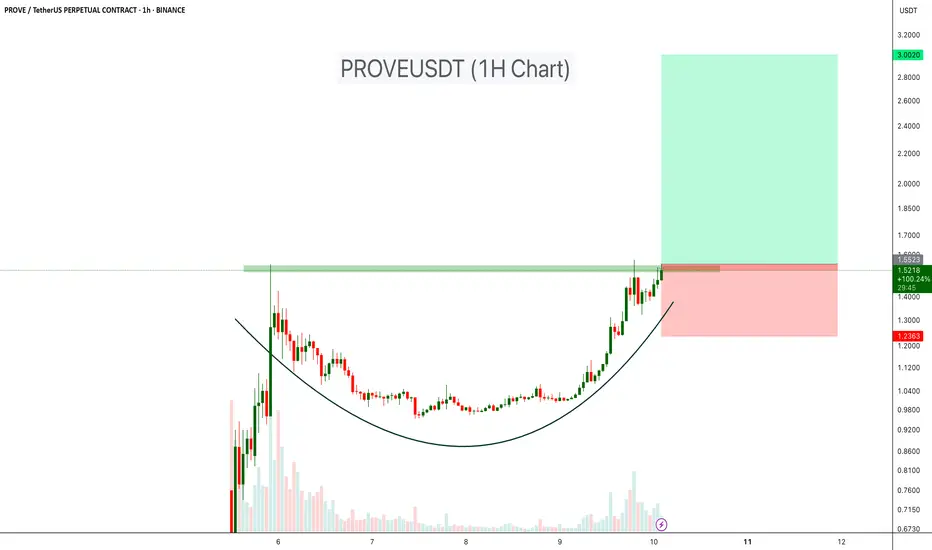
PROVEUSDT About to Break Out of Cup Formation!BINANCE:PROVEUSDT has formed a well-defined Cup pattern on the 1-hour chart, signaling strong accumulation after a prolonged consolidation phase. Price declined sharply before bottoming out and gradually curving upward, creating the classic rounded base that reflects a shift from selling pressure to steady buying interest.
The breakout zone is around $1.55, which has acted as a key resistance level. A confirmed close above this level, supported by strong volume, would validate the pattern and could spark a move toward the projected target near $3.00 - $4.00 level.
Cheers
Hexa
BINANCE:PROVEUSDT.P
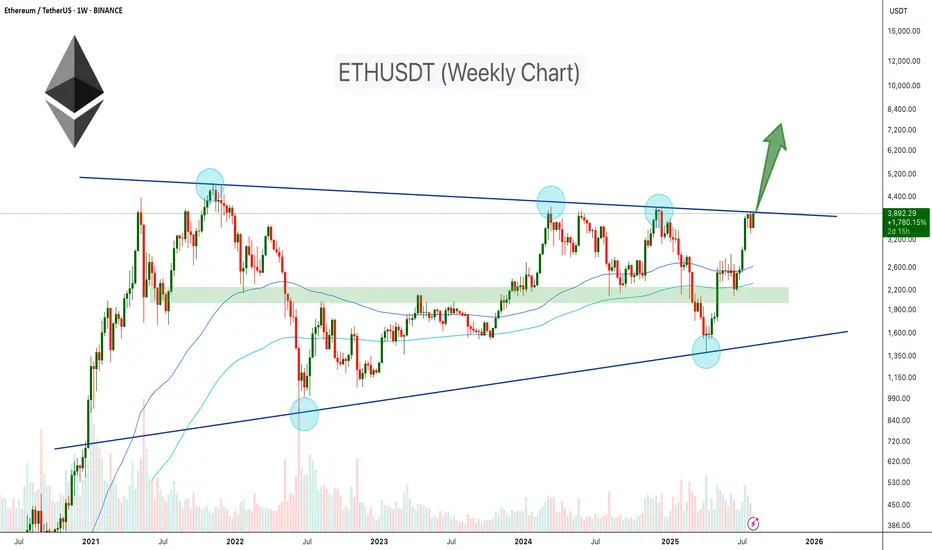
ETH Testing Critical $4K Resistance!BINANCE:ETHUSDT is trading inside an ascending triangle on the weekly chart, with price compressing between the resistance line and a rising support line. After a strong rally from the $1,500 demand area, ETH has reclaimed the 100- and 200-week EMAs and is testing the triangle’s upper trendline with increasing volume.
A weekly close above $4,000–$4,200 would confirm a triangle breakout and open upside toward $6,000–$7,500, while a rejection could send price back toward $3,200–$3,000 for further consolidation. Wait for a clear weekly close and volume confirmation.
Cheers
Hexa
BITSTAMP:ETHUSD CRYPTOCAP:ETH
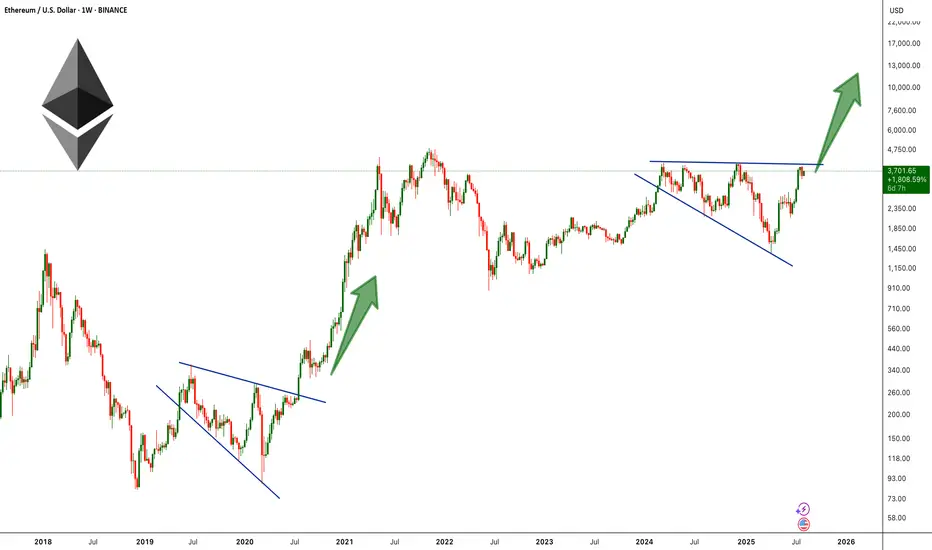
ETH Broadening Wedge Formation !BINANCE:ETHUSDT is forming a broadening wedge pattern on the weekly chart, a structure that often signals high volatility and strong momentum once the price breaks out. This setup is reminiscent of ETH’s 2019–2020 pattern, which also formed as a broadening wedge before breaking to the upside and triggering a historic rally to new all-time highs.
Currently, ETH is pressing against the upper resistance line of the wedge near the $3,900–$4100 zone, a level that has acted as major resistance multiple times in recent months. A decisive breakout above this barrier could ignite strong bullish momentum, opening the path toward the $6,000–$10,000 range.
Cheers
Hexa
MYXUSDT Triangle Breakout!MYXUSDT is breaking out of a well-defined symmetrical triangle on the 4-hour timeframe, after weeks of consolidation between tightening trendlines. The breakout is occurring just above a high-volume node, as shown on the right-side volume profile, which now acts as a strong demand zone and potential support for continuation.
Price is currently holding above the breakout level ($0.105), with solid momentum and improving volume, indicating a potential trend expansion toward the projected target zone near $0.35.
Cheers
Hexa

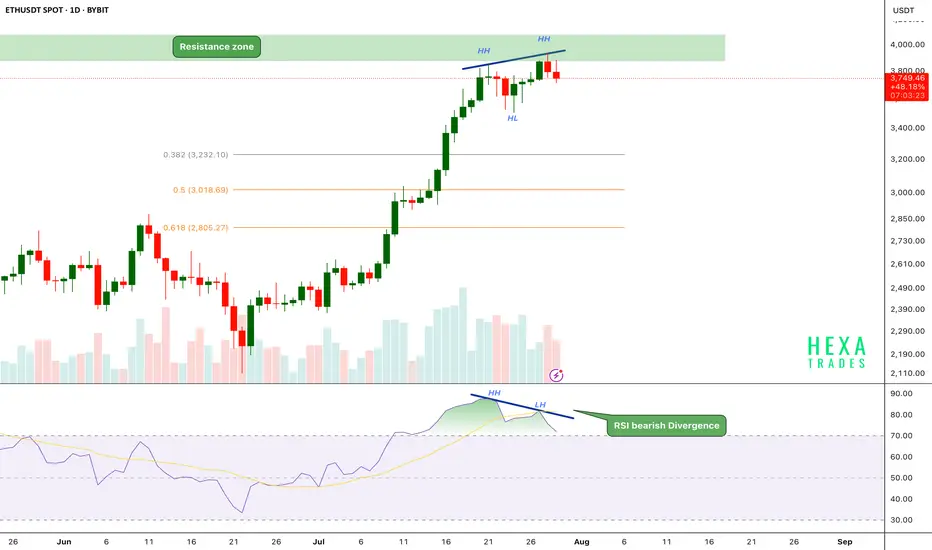
ETH Bearish Divergence!CRYPTOCAP:ETH has been in a strong uptrend, printing consistent higher highs (HH) and higher lows (HL). However, on the daily chart, the price has now reached a critical resistance zone near the $3,800–$4,000 range.
Key Points:
🔸 Bearish RSI Divergence
While price action has formed a new higher high, the RSI has printed a lower high, signaling bearish divergence.
This indicates that upward momentum is weakening even as price attempts to push higher — a common early warning of a possible short-term reversal.
🔸 Fibonacci Retracement Levels
The fib 0.382 at $3240 and 0.5 and 0.618 retracement levels are sitting around $3,000 and $2,800, respectively, potential targets if a correction follows.
🔸 Volume Profile
Volume is gradually declining as price approaches resistance, suggesting buyer exhaustion.
If the price breaks above the $4,000 psychological resistance, we could see a strong bullish move.
ETH is facing strong resistance after a powerful rally, with RSI bearish divergence and weakening momentum hinting at a possible short-term pullback. We should be cautious entering fresh longs here without confirmation.
Support: $3,200, $3,000, and $2,800
Cheers
Hexa
BINANCE:ETHUSDT BITSTAMP:ETHUSD
PUMPUSDT Diamond Pattern PUMPUSDT has been consolidating within a diamond chart pattern on the 4 hour timeframe, following a prolonged downtrend. This type of structure signals potential reversal when occurring after a decline.
Diamond Formation: Price is compressing inside converging and diverging trendlines, creating a symmetrical diamond pattern.
Volume Profile Support: Significant volume support is visible in the $0.00240–$0.00250 range, which may act as a strong demand zone.
EMA Resistance: 50 EMA is currently positioned above the price, serving as dynamic resistance.
Breakout Potential: A breakout above the diamond resistance, especially with increased volume, could target the $0.005 –$0.007 zone, representing a major upside move.
Cheers
Hexa
NYSE:PUMP BYBIT:PUMPUSDT

BTC Next Move Toward $150K?Bitcoin recently broke out above a long-standing resistance zone ($110K–$115K), supported by a clean move through the volume profile high node. After testing local highs, BTC is now pulling back to retest the breakout area, a critical level that could act as new support.
Key Points:
Breakout Retest: Price has pulled back into the breakout zone around $114K, aligning with strong previous resistance that may now flip to support.
Volume Profile: A strong high-volume node is visible below ($105K–$110K), which reinforces this area as a major demand zone.
EMA Confluence: The 50-day and 100-day EMAs are trending upward and aligning near the retest area, providing additional support.
If this level holds, BTC could resume its bullish leg toward the $150K level.
Cheers
Hexa

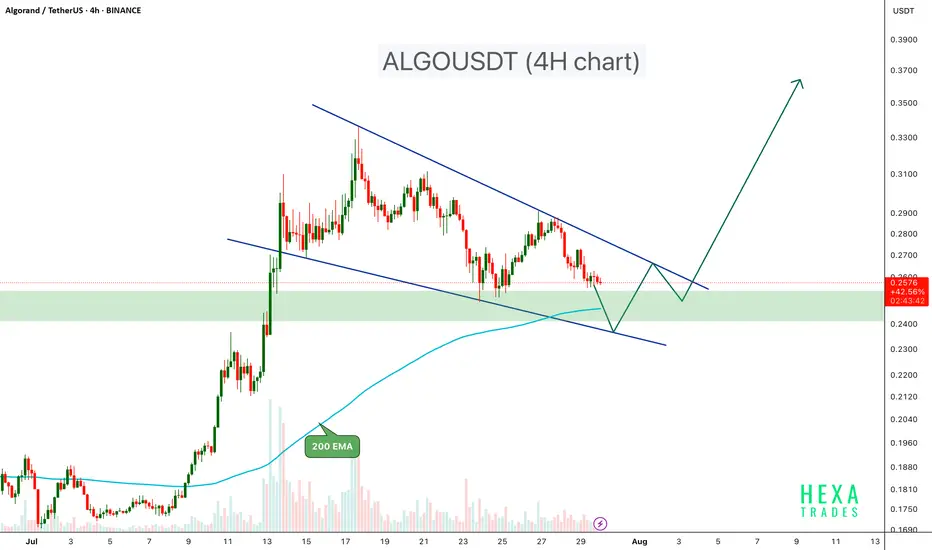
ALGOUSDT Forming Bullish Flag ALGOUSDT is currently trading inside a well-defined bullish Flag pattern on the 4-hour chart, a structure known for its bullish breakout potential. The price recently tested a significant demand zone, which previously acted as a base for a strong upward move earlier in July.
Key Points:
Bullish Flag Structure: Price is compressing within converging trendlines, forming lower highs and lower lows a classic bullish flag pattern.
Support Zone: The $0.24 – $0.255 area has acted as a strong demand zone, providing reliable support.
Bounce Potential: A bullish reaction from the lower flag boundary and demand zone could lead to a move toward the upper trendline and potentially trigger a breakout.
200 EMA Support: The 200 EMA is currently providing dynamic support, reinforcing the bullish setup.
Breakout Confirmation: A breakout above the flag resistance with strong volume could initiate a rally toward the $0.30 – $0.40 zone.
Cheers
Hexa
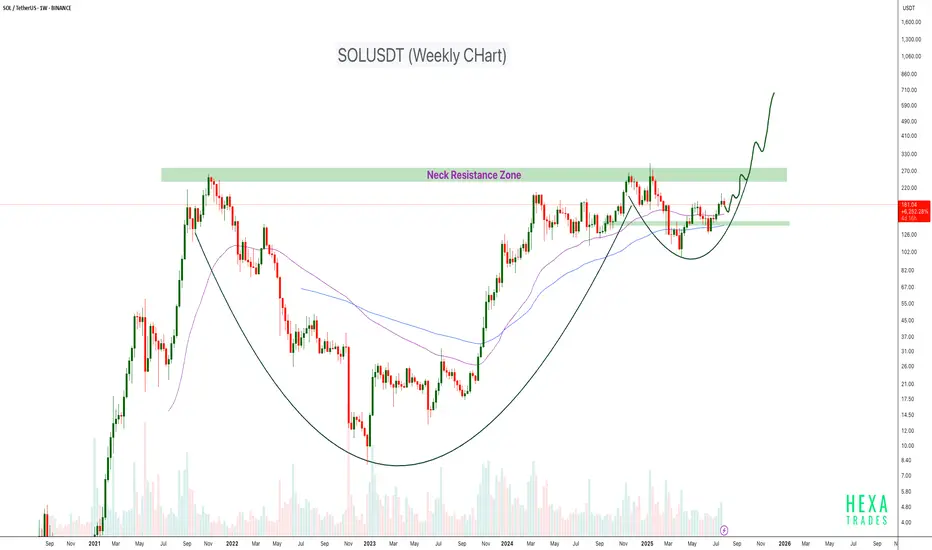
SOLUSDT Cup & Handle Formation CRYPTOCAP:SOL is forming a large Cup and Handle pattern on the weekly timeframe, a classic bullish continuation structure. Price is currently approaching the neckline resistance zone around the $250–$280 level. This area has acted as a major barrier in the past, rejecting the price multiple times, but the structure suggests it's now being retested with greater momentum.
If the neckline breaks cleanly with strong volume, the projected target could push SOL into the $600–$700+ range over the coming months.
Cheers
Hexa
BINANCE:SOLUSDT COINBASE:SOLUSD
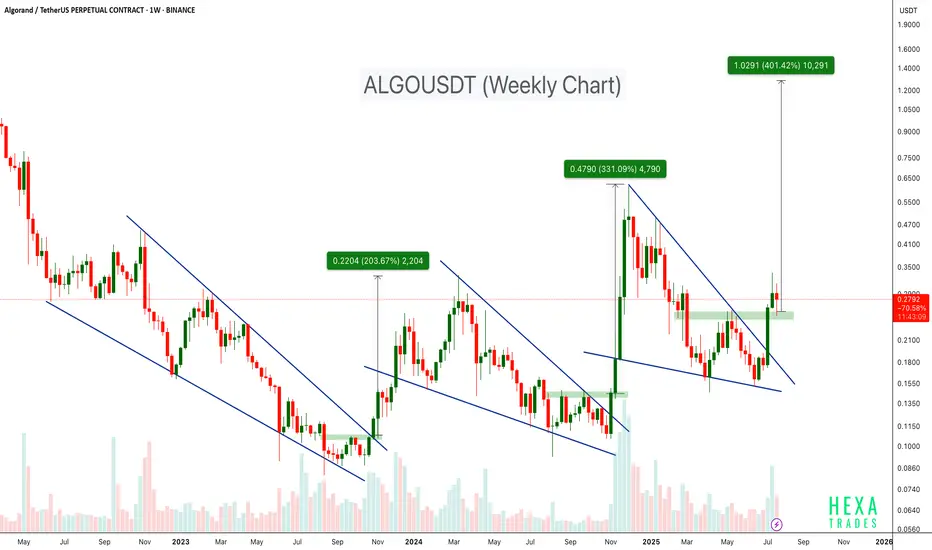
ALGO Breaks Out of Falling Wedge – 400% Target Ahead?BINANCE:ALGOUSDT has consistently followed a bullish pattern on the weekly timeframe. Each major rally has been preceded by a falling wedge breakout, as shown by the three highlighted instances on the chart.
- First breakout: ~200%+ move
- Second breakout: ~300%+ move
- Current breakout projection: Potential target up to +400%
The price has just broken above the wedge and is currently retesting the breakout zone. If history repeats itself, ALGO may be poised for a strong upside move from its current levels.
Cheers
Hexa🧘♀️
COINBASE:ALGOUSD EURONEXT:ALGO
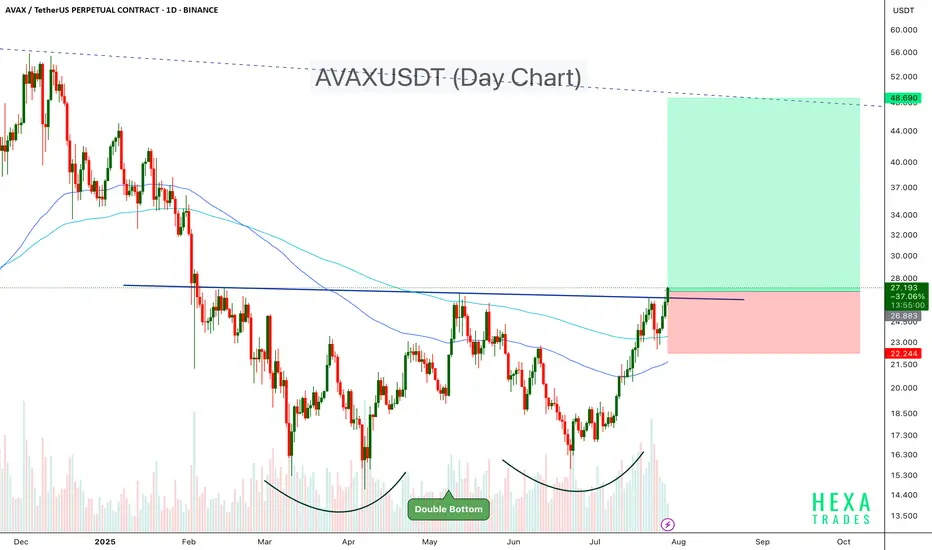
AVAXUSDT Double Bottom Confirmation.AVAX has formed a textbook double bottom pattern on the daily chart, signaling a potential reversal after months of downtrend. The neckline around the $27 zone has been broken decisively, confirming the bullish breakout.
Key Points:
- Double Bottom Structure: A strong bullish reversal pattern with a clean neckline breakout.
- Breakout Level: $27, which was acting as resistance for the past several weeks.
- Volume Surge: Noticeable increase in volume during the breakout, adding strength to the move.
- Target: $48–$50 region. ( Channel resistance)
-Stop-Loss Idea: Below $22.0
AVAX appears ready to trend higher as momentum builds. If bulls hold above the breakout zone, the rally may accelerate in the coming weeks.
Cheers
Hexa
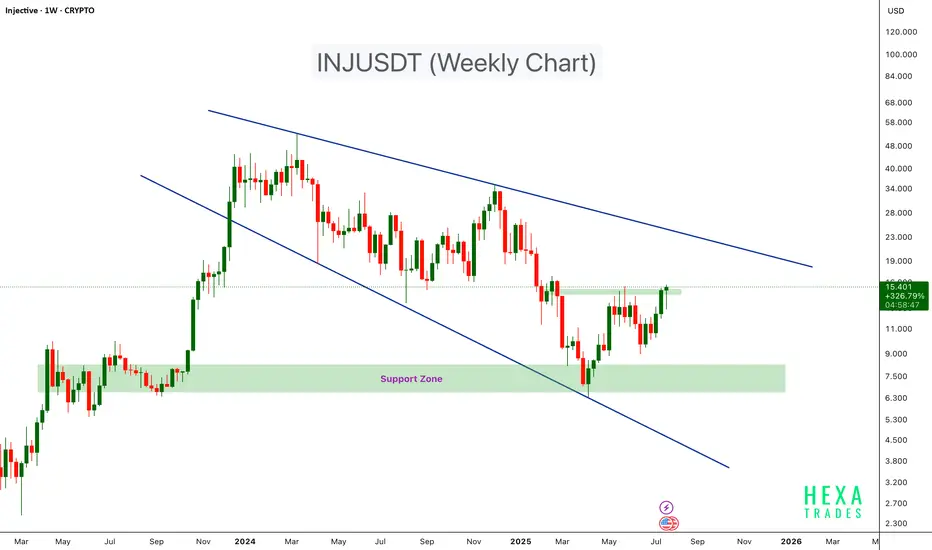
INJUSDT Descending Broadening WedgeINJUSDT is showing signs of a potential bullish breakout after rebounding from the lower boundary of a descending broadening wedge classic reversal pattern.
The price bounced from strong support around the $7.5–$9 zone, which aligns with historical buying interest. After bouncing from this key demand area, INJ has pushed higher and is now approaching a critical resistance level near $15.5. If the resistance breakout confirms, we can expect a bullish continuation towards the $25-$50. level
Cheers
Hexa
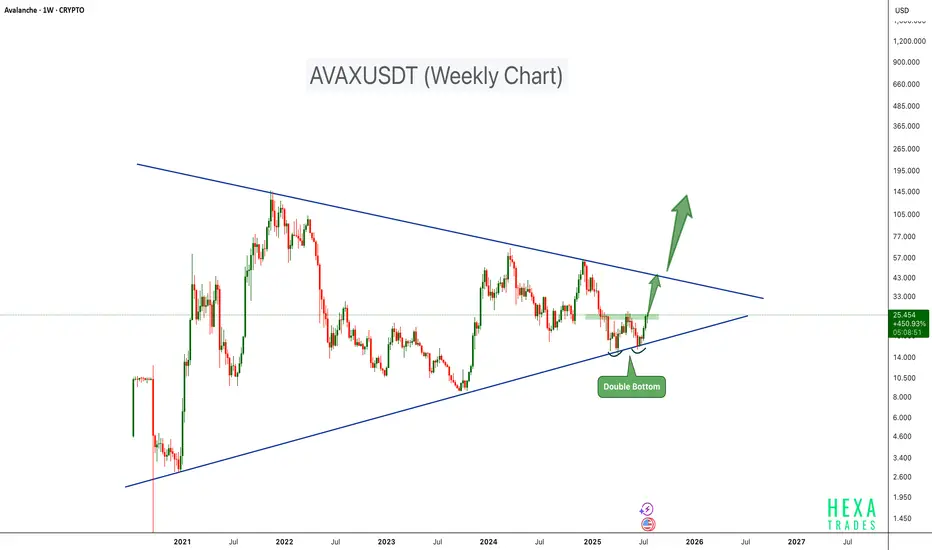
AVAX Bull Run Loading!AVAX is showing signs of a strong bullish setup on the weekly chart, forming a double bottom pattern right at the lower support trendline of a long-term symmetrical triangle. This technical formation often indicates a potential trend reversal when confirmed with breakout and volume support.
Key Points:
-Double Bottom Support around $12–$14 with bullish momentum.
-Symmetrical Triangle structure compressing price for breakout.
-Breakout Zone near $27, a close above this level may trigger strong upside.
-Upside Target: Short-term Target- $45; Long Term Target - $125
Invalidation: A Break below $15 support could negate the setup.
Cheers
Hexa
CRYPTOCAP:AVAX BINANCE:AVAXUSDT