When to Book Profits in Bitcoin?Bitcoin technical analysis update
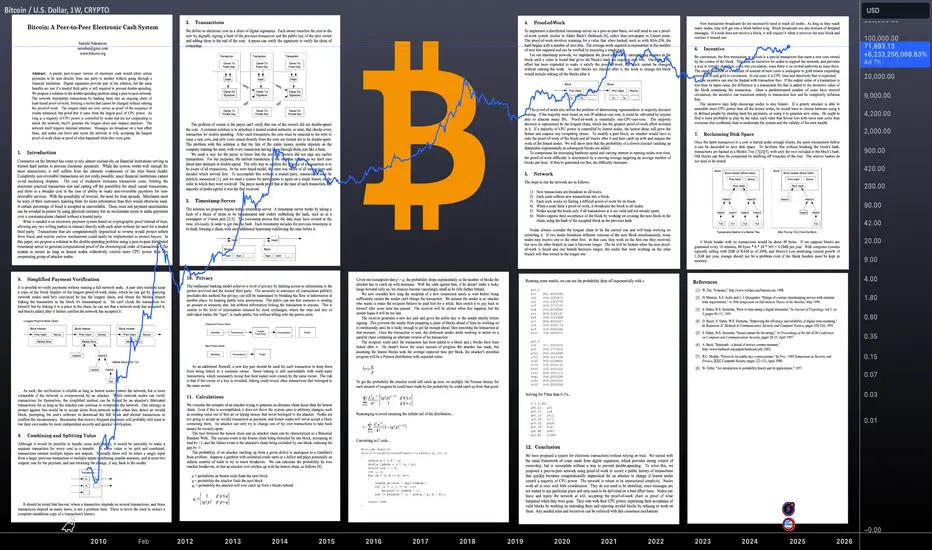
Historically, when Bitcoin's monthly RSI reaches overbought levels, the price tends to drop. In 2013, the RSI peaked at 97, in 2017 it reached 95, and in 2021, it topped at 92.5, forming a higher low divergence on the monthly chart. This time, if the RSI reaches the 90 level, it could signal another peak for Bitcoin. When the RSI reaches the 89-90 range on the monthly chart, it’s typically a good time to start booking profits. Currently, the RSI is at 63, suggesting there is still room for a price increase in the coming months.
Regards
Hexa
Hexatrades

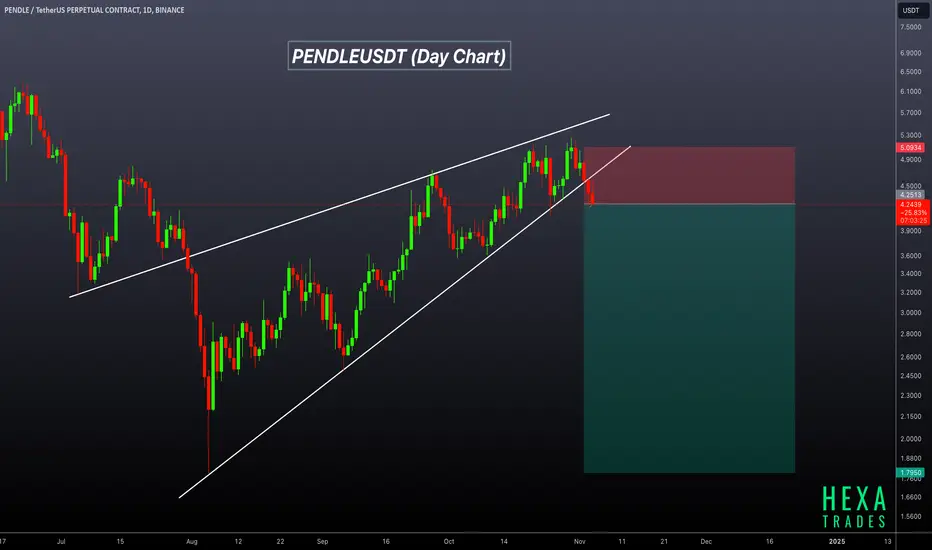
PENDLEUSDT Bearish Wedge PatternPENDLEUSDT Technical analysis update
PENDLE has formed a Raising wedge pattern on the daily chart, and the price has recently broken below the wedge's support line in day chart. This breakdown suggests potential bearish momentum in the coming days, with a possible decline toward lower support levels.
ETHUSDT: Next Strong Support at $2,100ETHUSDT Technical analysis update
ETH has been trading within a triangle pattern for the past 90 days, with the price repeatedly testing the triangle’s support line. If the price breaks below this support, a rapid drop to the $2,100 level could occur before any potential rebound. On the weekly chart, the 100 EMA is acting as a support level for the current triangle pattern.

ZETAUSDT Bearish Continuation.ZETAUSDT TEchnical analysis update
ZETA has formed a bearish triangle pattern on the 4-hour chart. A breakdown below the triangle's support level has been confirmed, suggesting increased bearish momentum. With this breakdown, the price may potentially drop to the $0.34 level as the next support target. If selling pressure continues, further declines could occur before any signs of a reversal emerge.

FTMUSDT: Bearish Head and Shoulders PatternFTMUSDT Technical analsysis update
BINANCE:FTMUSDT has formed a bearish head and shoulders pattern on the daily chart, with price moving the support level below. If a breakdown is confirmed on the daily chart, we could expect a potential drop of 20%-60% in FTM. Additionally, the price has fallen below the 100 EMA, adding further confirmation of a bearish trend.
Short level: Above $0.58
Stop loss : $0.675
Target 1 : $0.530
Target 2 : $0.420
Target 3: $0.260

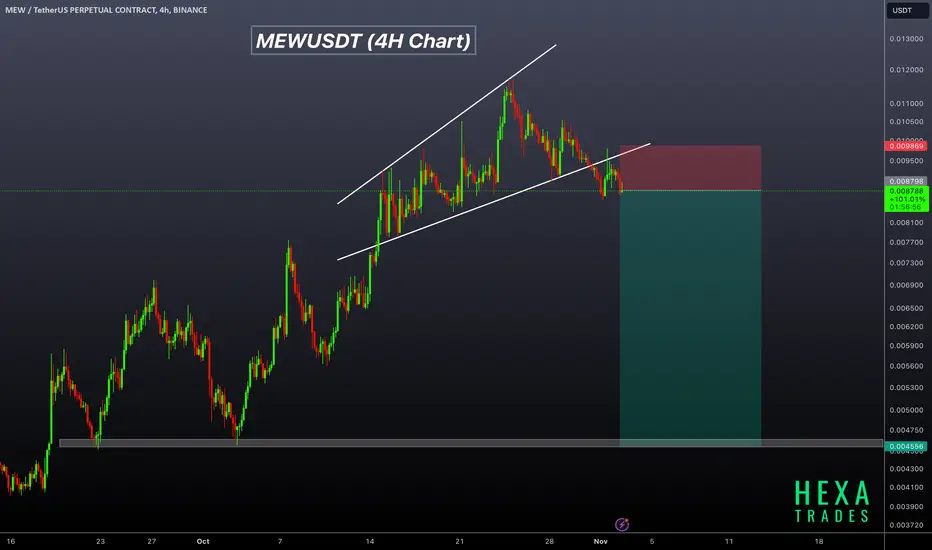
MEWUSDT Bearish Wedge!MEWUSDT TEchnical analysis update
MEWUSDT has formed an ascending broadening wedge pattern at the peak, indicating potential bearish momentum. The price breakdown has been confirmed on the 4H chart, and a retest of the breakdown level has been completed, reinforcing the bearish outlook. The price is now moving steadily toward the lower levels of the pattern, suggesting further downside potential if selling pressure continues.
Regards
Hexa
Happy Bitcoin White Paper Day! Happy Bitcoin White Paper Day! 📜✨
Today marks an essential day in digital assets and decentralized finance. On October 31, 2008, Satoshi Nakamoto introduced Bitcoin to the world through a revolutionary nine-page white paper, "Bitcoin: A Peer-to-Peer Electronic Cash System." This blueprint set the foundation for the first decentralized digital currency, fundamentally reshaping our view of money and unlocking new pathways to financial freedom.
As we celebrate this milestone, it’s inspiring to reflect on Bitcoin’s evolution from a bold idea to a powerful global asset that has transformed finance and decentralized ownership. Whether you’re a dedicated HODLer or actively trading, today serves as a reminder of what makes this space truly unique. Let’s honor Satoshi’s vision of decentralization and financial empowerment as we look ahead to Bitcoin’s promising future. Cheers to Bitcoin’s past, present, and all that’s yet to come!
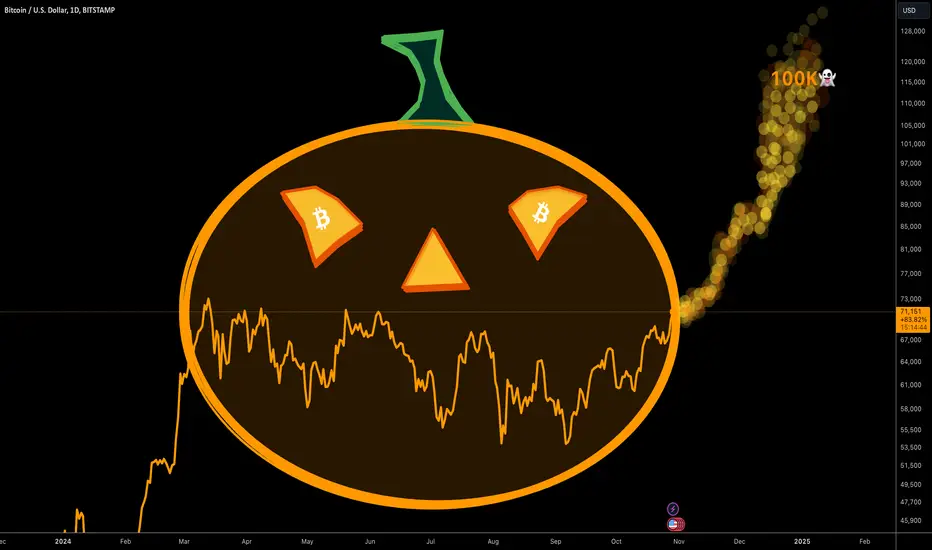
BTC Tricks & Treats: Will We See 100K? Will Bitcoin hit the ghostly 100K milestone? This chart playfully shows the journey, with BTC carving out its path like a Halloween pumpkin, aiming for the top with some holiday spirit.
Happy Halloween to all HODLers! 🎃👻
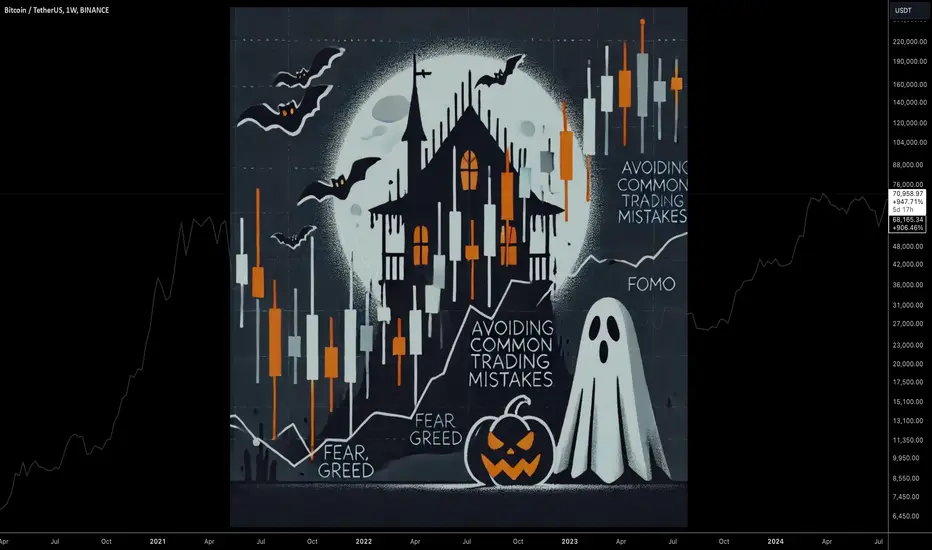
Halloween Horror: Avoiding Common Trading MistakesAs Halloween approaches, it’s the perfect time to reflect on the common “frights” that can scare traders away from success. Just like ghosts and ghouls lurking in the shadows, trading mistakes can be sneaky and unexpected. This post will highlight some of the most common trading mistakes, drawing parallels with Halloween themes, and provide strategies for avoiding these pitfalls.
🎃Fear of Missing Out (FOMO)
Many traders experience FOMO, which can lead to impulsive decisions, such as chasing after rapidly rising stocks or jumping into trades without proper analysis. This behavior often results in buying at peak prices and facing losses when the stock inevitably corrects.
Set Clear Entry and Exit Points: Establish specific criteria for entering and exiting trades to avoid emotional decisions.
Stick to Your Plan: Have a trading plan that includes risk management strategies. Review your plan regularly, especially in volatile market conditions.
👻 Overtrading
In an attempt to capitalize on every opportunity, some traders overtrade, leading to excessive fees, emotional fatigue, and ultimately poorer performance. Overtrading can resemble a Halloween party gone wild, with too many participants causing chaos.
Limit Your Trades: Set a maximum number of trades per week or month. Focus on quality over quantity.
Take Breaks: Allow yourself time away from the screen to recharge and refocus. This helps in making more rational decisions.
🕷️Ignoring Risk Management
Trading without proper risk management is akin to wandering through a haunted house without a flashlight. You’re likely to encounter unexpected dangers. Failing to set stop-loss orders or to size positions appropriately can lead to catastrophic losses.
Implement Stop-Loss Orders: Set stop-loss orders at a predetermined level to limit potential losses.
Diversify Your Portfolio: Spread your investments across different asset classes and sectors to mitigate risk.
👺 Emotional Trading
Trading decisions driven by emotions such as fear, greed, or panic can lead to disastrous results. Emotional trading is like letting a ghost dictate your path through a dark forest—it's unpredictable and often leads to mistakes.
Keep a Trading Journal: Document your trades, including the reasoning behind them and your emotional state at the time. This will help you identify patterns and triggers in your decision-making process.
Practice Mindfulness: Incorporate techniques like meditation or deep breathing to remain calm and focused during trading hours.
🦇Neglecting Research and Analysis
Many traders skip the crucial step of research and analysis, relying instead on tips or rumors—much like believing in urban legends without questioning their validity. This can lead to uninformed trades and unexpected losses.
Conduct Thorough Analysis: Use both technical and fundamental analysis to make informed trading decisions. Stay updated on market news and trends.
Leverage Trading Tools: Utilize platforms like TradingView to access charts, indicators, and community insights.
[b 🕸️Chasing Losses
After experiencing losses, some traders attempt to "revenge trade," trying to quickly recover their losses by taking high-risk trades. This often results in deeper losses and a vicious cycle of frustration.
Accept Losses as Part of Trading: Understand that losses are inevitable. Learn from them rather than trying to immediately recover.
Take a Step Back: If you find yourself in a negative trading streak, consider taking a break to reassess your strategies and mental state.
👽 Not Adapting to Market Conditions
The market is constantly changing, and clinging to outdated strategies can be dangerous. This is similar to wearing the same costume year after year—eventually, it becomes stale and ineffective.
Stay Flexible: Be willing to adapt your trading strategies based on current market conditions. Regularly review and refine your approach.
Educate Yourself: Continuously seek knowledge through courses, webinars, and market analysis to stay informed about new trends and strategies.
As the Halloween season creeps in, it’s time to face the spooky realities of trading! By identifying and confronting common trading frights, you can transform potential pitfalls into stepping stones for success. Remember, every trader encounters challenges, but preparation, discipline, and continuous learning are your best defenses against the ghouls of the market.
So, this Halloween, don’t let fear haunt your trading journey. Embrace the tricks of the trade, sharpen your skills, and turn those frights into fruitful opportunities! Here’s to a successful and spooktacular trading experience!🎃👻🕸️
Bitcoin: Cup and Handle Breakout PotentialBTCUSD technical analysis update
BTC has formed a Cup-and-handle pattern on the weekly chart over the last 1,100 days and is currently trading at $67,000, approaching a key resistance level. A breakout above this resistance would signal a potential upward trend. Once the breakout occurs, we could see a strong bullish move, with the potential for a 100% to 200% increase.
Regards
Hexa

BTCUSDT Golden Cross Signals Strong BullishBINANCE:BTCUSDT daily chart shows a Golden Cross, a pattern that has historically been a strong indicator of bullish momentum. A Golden Cross occurs when the 50-day moving average (MA 50, in purple) crosses above the 200-day moving average (MA 200, in blue). This crossover is generally viewed as a signal of a long-term trend reversal, suggesting that bullish momentum is building. Whenever this crossover has occurred in the past, Bitcoin has experienced substantial upward price movement in the following months.
Currently, CRYPTOCAP:BTC has broken through broadening wedge resistance levels on the daily chart and is trading near $71,000. This price action aligns with the Golden Cross, reinforcing the potential for a continued bullish move. With BTC consolidating above key levels, a breakout above $70K could trigger further buying interest and sustain the uptrend.
If BTC can hold its position above the 200-day MA and breakthrough additional key resistance levels, the price could continue to climb. Potential targets range from 100-200% gains from this level, similar to past Golden Cross rallies.
Regards
Hexa

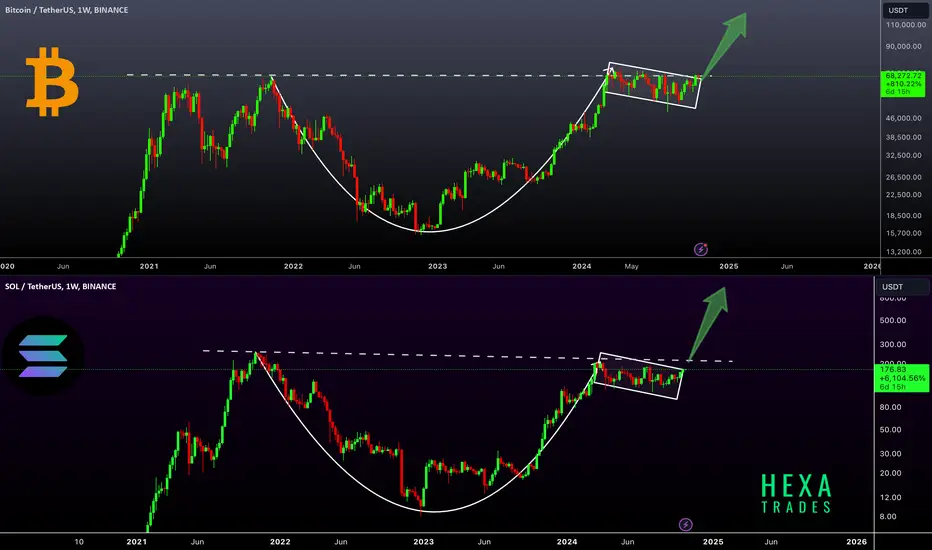
BTC and SOL Form Bullish Cup and Handle PatternBINANCE:BTCUSDT and BINANCE:SOLUSDT technical analysis update.
BTC and SOL are showing similar chart patterns, each forming a cup and handle. Currently, both SOL and BTC prices are trading within the handle, moving toward a potential breakout. If this breakout occurs, we could see a strong bullish move in both assets.
SOL has already risen 2600% from its bottom, and a breakout could potentially lead to a further 200-500% increase. BTC, on the other hand, has gained 360% from its bottom, and a breakout from this cup and handle pattern could yield an additional 100-200% upside.
SOLUSDT Cup and Handle Pattern Suggests Potential Bullish MoveSOLUSDT Technical analsysi uopdate
SOLUSDT has formed a cup and handle pattern on the weekly chart over the past 1080 days, which is a bullish signal. The price is currently forming the handle, and once it breaks above the handle's resistance, we can expect a strong upward move, signaling the continuation of the long-term uptrend.
Regards
Hexa

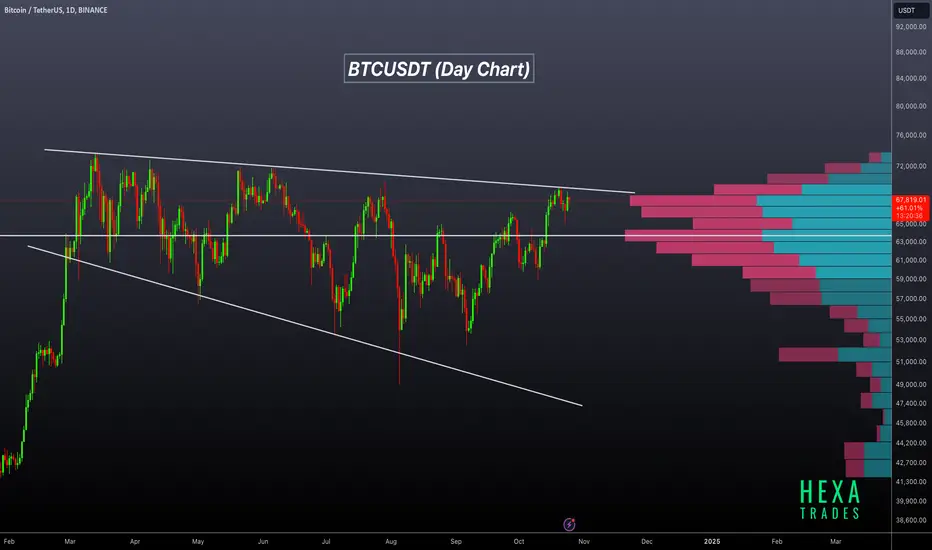
BTCUSDT Strong support at $65,000BINANCE:BTCUSDT on the daily timeframe is forming a descending broadening wedge, with the price currently testing the upper resistance trendline. This pattern often suggests a potential bullish breakout if the price successfully surpasses the resistance. The volume profile shows significant trading activity between $65,000 and $67,000, indicating this range as a key support zone. Additionally, lower trading volume above the current price may suggest lighter resistance if the price moves higher.
The $65,000 level is acting as strong support, while $69,000 serves as potential resistance. A breakout above the wedge could signal the start of a bullish rally.
Regards
hexa
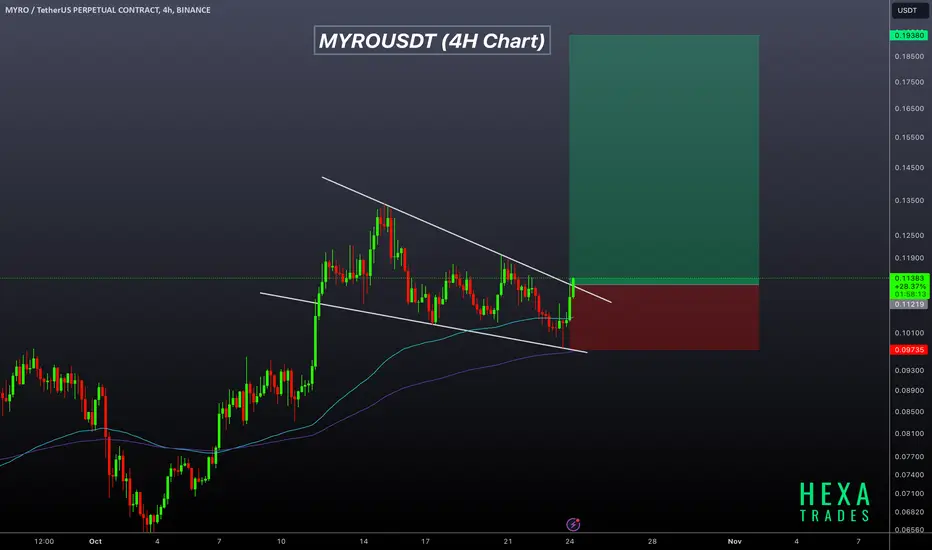
MYROUSDT Bullish Flag!MYROUSDT Technical analsysi update
MYRUSDT is forming a bullish flag pattern on the 4H chart, and the price is now breaking out of the flag. On the daily chart, the previous resistance zone is acting as support, with the 100 and 200 EMAs providing support at the flag's bottom. A strong bullish move can be expected.
Buy zone : Below $0.113
Stop loss : $0.0975
Take Profit 1: $0.124
Take Profit 2: $0.140
Take Profit 3: $0.20
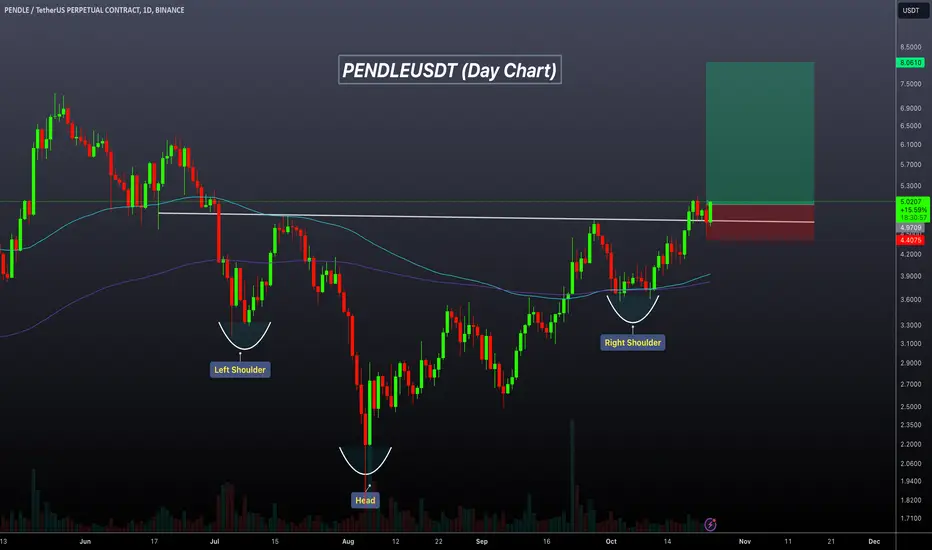
PENLDEUSDT Bullish Head and Shoulders Pattern.PENDLEUSDT Technical analysis update
PENDLE's price is breaking the inverse head and shoulders neckline on the daily chart, with the 100 and 200 EMAs acting as support for the right shoulder. We can expect a potential bullish move in PENDLE
Buy zone : Below $5.00
Stop loss : $4.40
Take Profit 1: $5.48
Take Profit 2: $6.15
Take Profit 3: $8.00
Regards
Hexa
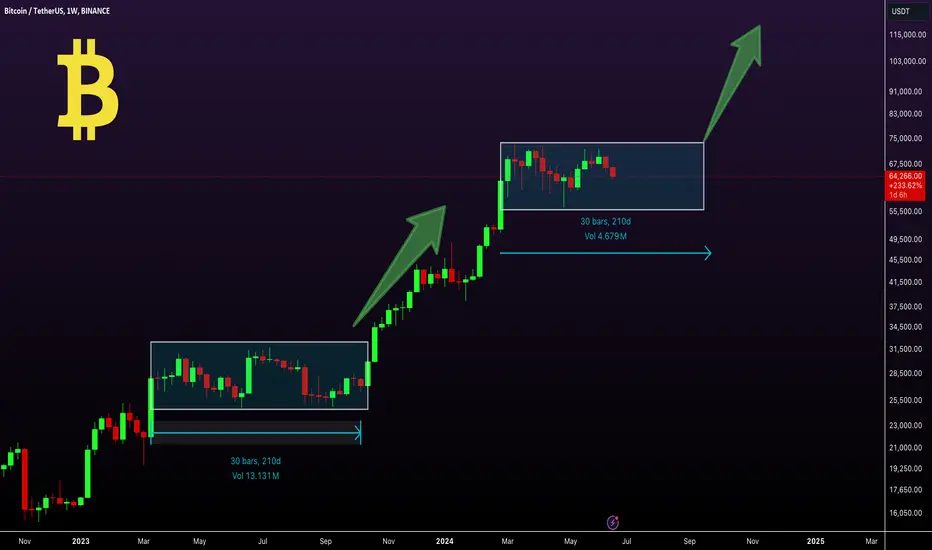
Will Bitcoin Take Off?Bitcoin's price has been moving sideways for the last 114 days after reaching a new ATH. Now, the price has dropped below the previous ATH.
In the early stage of the bull run, Bitcoin's price moved sideways for 210 days before making a significant bullish move. This time, we can expect a similar pattern, with the price likely continuing to move sideways for the next 1-2 months.
We can expect a bullish move in the middle or end of the third quarter of 2024.
Regards
hexa
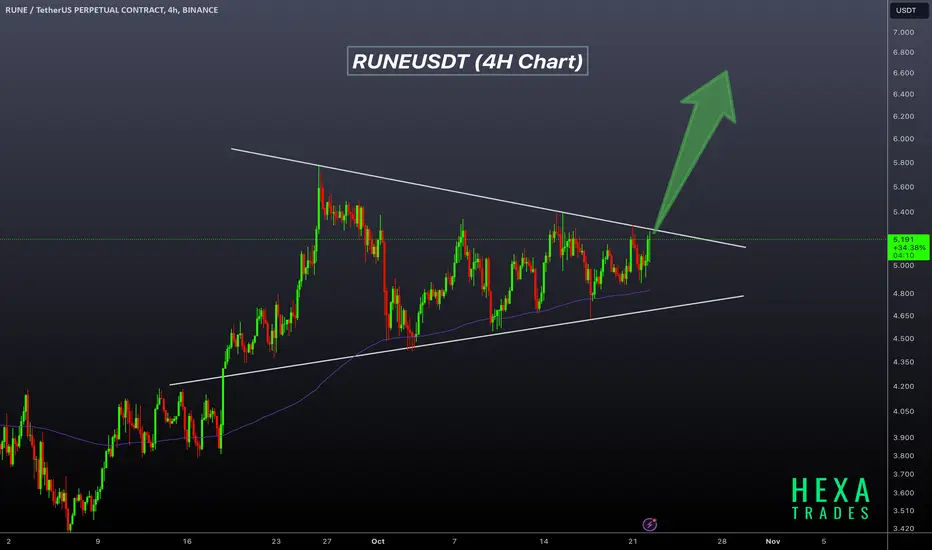
RUNEUSDT Forms Bullish Triangle PatternRUNEUSDT Technical analysis update
RUNE has been trading inside the triangle for the last 30 days and is now moving toward the breakout on the 4-hour chart. If the breakout occurs, we can expect a significant bullish move. The price is trading above the 100 and 200 EMA on the daily chart, which act as support for the current triangle.
FEAR: Your Biggest Trading EnemyFear is a natural emotion that affects all traders, whether beginners or experienced professionals. In trading, fear often stems from uncertainty, the potential for losses, and the volatility of financial markets. Left unchecked, fear can lead to poor decision-making, impulsive actions, and even significant financial losses. However, by understanding fear and learning how to manage it effectively, traders can improve their performance and build confidence over time.
Steps to Overcome Fear in Trading
Develop a Trading Plan
Having a well-structured trading plan provides clarity and reduces fear. A plan should include specific rules for entry and exit, risk management strategies, and profit targets. When you follow a plan, you take emotions out of decision-making and rely on data-driven strategies.
Stick to your plan: Trusting your trading strategy can reduce emotional decision-making, especially during times of market volatility or uncertainty.
Use Risk Management
Effective risk management can alleviate fear because it limits the potential downside of any trade. Traders should:
Set a stop-loss: Predetermine the maximum amount you are willing to lose on any trade. This not only limits losses but also takes the emotional pressure off monitoring trades.
Control position sizing: By using small position sizes relative to your account balance, you minimize the impact of any one trade, which can reduce fear and emotional stress.
Focus on Process, Not Outcomes
Instead of focusing on whether an individual trade is profitable, concentrate on executing trades according to your plan. Understand that losses are part of trading and that a single trade doesn't define your overall success.
Avoid emotional attachment to trades: Treat trading as a probabilistic game where losses and gains balance out over time if your strategy is sound.
Build Confidence with Knowledge
Fear often stems from uncertainty. The more knowledge and experience you gain, the more confident you’ll feel in your trading decisions. Spend time improving your understanding of:
Technical analysis: Learn to read charts, patterns, and indicators to make informed decisions.
Fundamental analysis: Understand the economic factors that drive market movements.
Regularly review your past trades, both successful and unsuccessful, to learn from mistakes and build confidence in your abilities.
Practice Patience and Discipline
Patience is crucial to avoid overtrading or jumping into trades impulsively. Fear can push you into making quick decisions, but staying disciplined ensures you wait for the right setups.
Discipline in following your trading plan and sticking to risk management rules can help control the emotional swings that come with fear. Staying patient allows trades to develop fully and increases the chances of success.
Accept Losses as Part of the Process
No trader wins 100% of the time, and understanding that losses are a natural part of trading can help reduce the fear of losing. Treat each loss as a learning experience rather than a failure.
Reframe your mindset from avoiding losses to managing losses. When you accept that losses will happen but you can limit their impact, fear becomes easier to handle.
Control Emotional Reactions
Mindfulness techniques: Practices like deep breathing, meditation, or taking regular breaks can help traders stay calm during high-pressure situations.
Avoid overreacting: If you experience a significant loss, avoid the temptation to enter a "revenge trade" to recover quickly. Emotional decisions can compound losses. Take a step back, review your plan, and re-enter the market with a clear mind.
Use a Trading Journal
Keeping a trading journal helps track your emotions, thought processes, and decision-making patterns. Over time, this can help identify fear-based behaviors and allow you to adjust accordingly. By reviewing your journal regularly, you can improve self-awareness and make better decisions.
Fear is a natural part of trading, but it doesn't have to control your actions. By developing a solid trading plan, practicing effective risk management, and building knowledge and discipline, traders can overcome fear and make more rational decisions. Over time, learning to accept losses and focusing on long-term strategies will help you manage fear and improve your overall trading success. Remember, the key to overcoming fear is consistent practice, self-awareness, and developing confidence in your abilities as a trader.
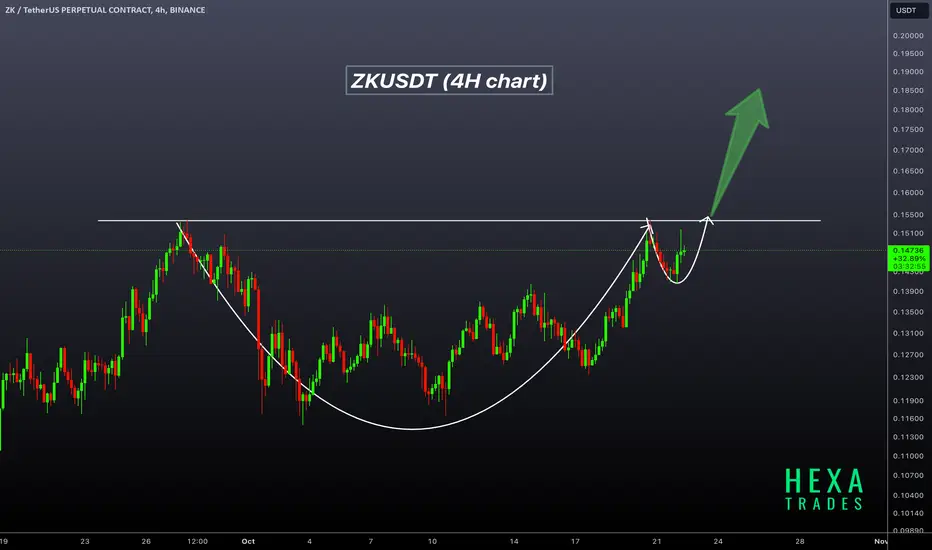
ZKUSDT Bullish Cup and handle PatternZKUSDT technical analysis update
ZKUSDT price has formed a cup and handle pattern on the 4H chart and is currently forming the handle. Once the price breaks the cup and handle neckline, we can expect a strong bullish move.
Buy Level: after breakout confirmation 4H chart, above $0.155
Stop Loss: $0.140
Regards
Hexa
Open Interest ExplainedOpen interest (OI) is a critical concept in the world of trading, particularly in the futures and options markets. It represents the total number of outstanding contracts that have not been settled or closed. Understanding open interest can provide valuable insights into market sentiment, liquidity, and potential price movements. In this article, we will explore what open interest is, how it affects trading, and what traders should consider when analyzing it.
What is Open Interest?
Open interest is defined as the total number of outstanding derivative contracts—such as futures and options—that have not yet been settled. Each time a new contract is created (when a buyer and seller enter into a new agreement), the open interest increases. Conversely, when a contract is settled or closed, the open interest decreases.
For example, if a trader buys a futures contract, open interest increases by one. If another trader sells the same contract to close their position, open interest decreases by one.
Why is Open Interest Important?
Open interest provides insights into market activity and can indicate the strength of a price trend. Here are some key reasons why open interest is important for traders:
Market Sentiment:
Open interest can help traders gauge market sentiment. Rising open interest, especially alongside rising prices, suggests that new money is entering the market and that the bullish trend may continue. Conversely, increasing open interest with falling prices may indicate that bearish sentiment is growing.
Liquidity Indicator:
Higher open interest generally indicates greater market liquidity. This means that traders can enter and exit positions more easily, which is especially important for large institutional traders who need to manage large orders without significantly impacting the market price.
Potential Price Movements:
Analyzing open interest trends can help traders predict potential price movements. For instance:
- Increasing Open Interest + Rising Prices: This combination suggests that new bullish positions are being established, indicating a potential continuation of the uptrend.
-Increasing Open Interest + Falling Prices: This scenario may indicate that new bearish positions are being taken, suggesting a potential continuation of the downtrend.
-Decreasing Open Interest: A decline in open interest, particularly in conjunction with rising prices, may suggest that traders are closing their positions, which can signal a weakening trend.
How to Analyze Open Interest
When analyzing open interest, traders should consider several factors:
[ b]Contextual Analysis: Always consider open interest in conjunction with price movements. Relying solely on OI without considering price action can lead to misleading interpretations.
Volume Comparison: Compare open interest with trading volume. High volume alongside increasing open interest is generally a positive sign for a trend, while high volume with decreasing open interest may signal trend exhaustion.
Market Events: Be aware of upcoming economic reports, earnings announcements, or other events that may impact market sentiment and influence open interest.
Different Markets: Open interest can behave differently across various asset classes. For example, in commodity markets, high open interest might reflect hedging activity, while in equity options, it could indicate speculative interest.
Open interest is a valuable tool for traders to assess market sentiment, liquidity, and potential price movements. By analyzing it alongside price action and volume, traders can gain deeper insights into market trends and make more informed trading decisions. However, like any trading indicator, it works best when combined with other forms of analysis for a well-rounded strategy.
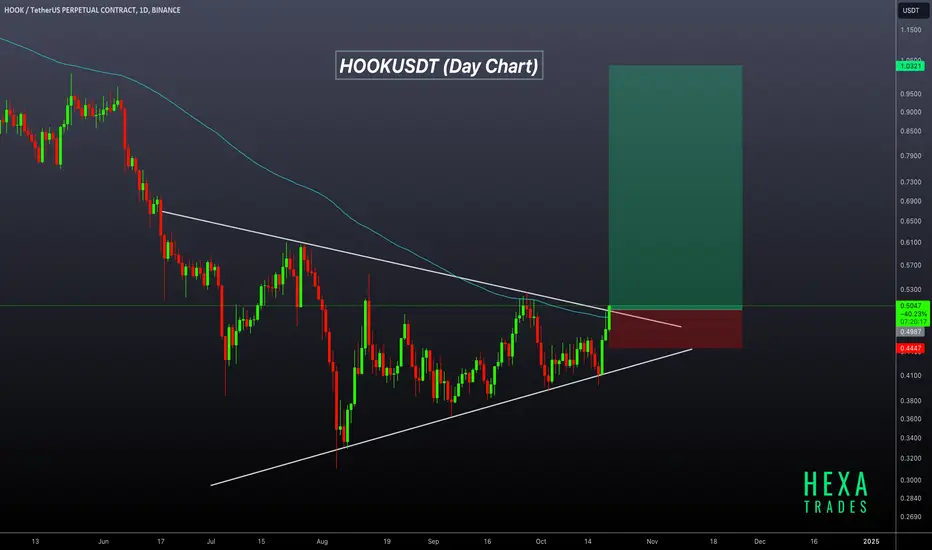
HOOKUSDT: Bullish SignalHOOKUSDT technical analysis update
HOOKUSDT has formed a triangle pattern on the daily chart, and the price is now moving towards a breakout. It has also crossed above the 100 EMA on the daily chart. A bullish move can be expected once the triangle breakout is confirmed.
Buy level: $0.50
Stop Loss: $0.44
Regards
Hexa
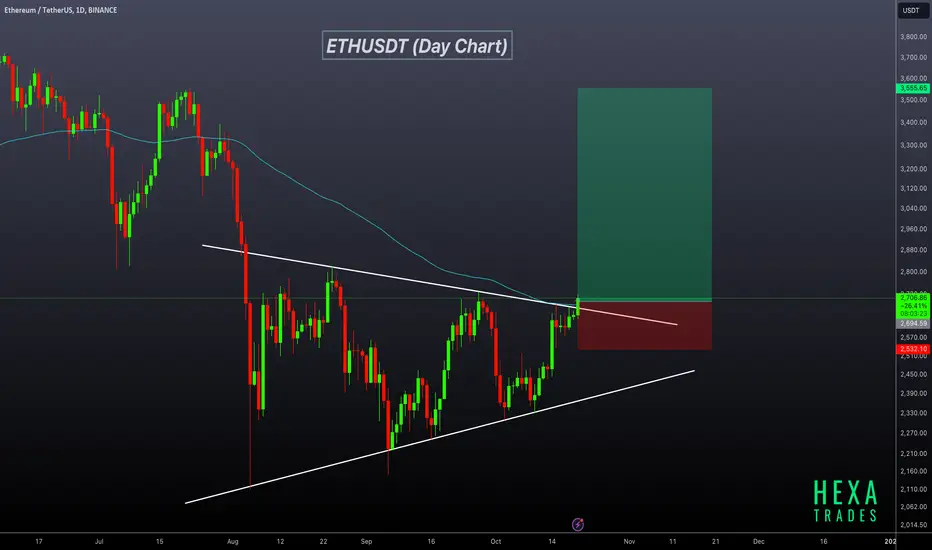
ETHUSDT Bullish Triangle Breakout!ETHUSDT Technical analysis update
ETH has been forming a symmetrical triangle pattern over the last 75 days. The price has now broken the triangle's resistance on the daily chart and crossed above the 100 EMA. In the coming days, we can expect a strong bullish move in ETH
Buy zone : Below $2700
Support: $2525
Take Profit 1: $2850
Take Profit 2: $3125
Take Profit 3: $3550
Regards
Hexa