Learning#05 : Decoding Highs and Lows📚 Learning#05 : Decoding Highs and Lows
- A Trader’s Guide to Reading the Market - Simple Yet Important
If the market were a book, the trend would be its storyline — and as traders, our job is to read that story without skipping pages. Trading with the trend puts the odds in your favor because you’re flowing with the market’s natural momentum, not fighting it.
Whether it’s an uptrend, downtrend, or a sideways grind, spotting it early gives you a big edge in deciding when to enter, when to exit, and when to simply step aside.
One of the simplest yet most reliable ways to read that story?
👉 Story of Highs and Lows
Let’s break it down.
📚 Understanding Highs and Lows in Trading
In technical analysis, highs and lows are the market’s way of leaving breadcrumbs.
A high is a peak before the market pulls back.
A low is a trough before the market bounces.
Track these points over time and you start to see patterns that reveal the market’s mood — bullish, bearish, or indecisive.
This isn’t about guessing; it’s about observing price action as it is.
📌 The Four Key Building Blocks of Market Structure
1️⃣ Higher Highs (HH)
Each new high is higher than the one before.Paired with higher lows, this signals an uptrend. Buyers are in control, and demand is pushing price upward.
Example: Nifty rallies from 22,000 to 22,200, pulls back to 22,100, and then rallies to 22,350. That second high (22,350) is higher than the first, confirming bullish momentum.
2️⃣ Higher Lows (HL)
Each pullback low is higher than the last.This tells you that sellers tried to push the market down — but buyers stepped in sooner this time, showing strength.
HLs often precede trend continuation and give great spots for entering long positions with tight risk.
3️⃣ Lower Lows (LL)
Each new low is lower than the previous one.Paired with lower highs, this marks a downtrend. Selling pressure is in charge, and rallies are being sold into.
4️⃣ Lower Highs (LH)
Each bounce high is lower than the last.This shows weakening buying pressure and often leads to another push lower.
Think of it like climbing stairs vs. walking down a hill:
📌 HH + HL = Stairs up → Bull trend.
📌 LL + LH = Hill down → Bear trend.
📈 HH+HL : Bullish Setup :
📉 LL+LH : Bearish Setup :
📌 Why It Matters for Traders
Price action is the most honest information in the market — no lag, no magic, no guesswork.
HH/HL → Bulls in control → Look for long setups.
LL/LH → Bears in control → Look for short setups.
Spotting these patterns on the fly means you can align with the dominant side instead of fighting it.
🧩 Combining HH & LL With Other Tools
📏 Fibonacci Retracements
Once you’ve identified the trend:
In an uptrend, draw Fibonacci from the latest HL to HH for pullback buying zones.
In a downtrend, draw from the latest LH to LL to find shorting opportunities.
⛰️ Fractals for Clarity
Fractals help pinpoint swing highs and lows without guesswork. I personally track HH/HL/LL/LH on a 1-minute chart for intraday trading — this keeps me in sync with the micro-trend while avoiding sideways traps.
🔀 Trendlines & VWAP
Trendlines show the bigger path, VWAP confirms intraday balance. When HH or LL aligns with these, you’ve got high-confluence setups.
🥷 Kiran’s Approach
For intraday, I start by mapping the structure: HH, HL, LL, LH. This gives me the immediate trend bias and alerts me to potential reversals early. I track them on a 1-min chart, combine with Fibonacci and trendlines, and trail stops as the structure unfolds.
It’s simple, visual, and keeps me out of bad trades and warns me to stay out of a sideways market situation, too.
🔑 Key Takeaway
Market structure is like a language — HH, HL, LL, and LH are its alphabet. Once you learn to read it, you’ll never trade blind again.
💡 “Trade what you see, not what you think. The chart always whispers first — you just have to listen.”
Start marking highs and lows on your chart tomorrow. Watch the story unfold. Trade in sync, and you’ll notice your entries become sharper, your exits cleaner, and your confidence higher.
See you in the next one — and until then:
Keep it simple. Trade with structure. Trust the levels.
— Kiran Zatakia
Hhhl
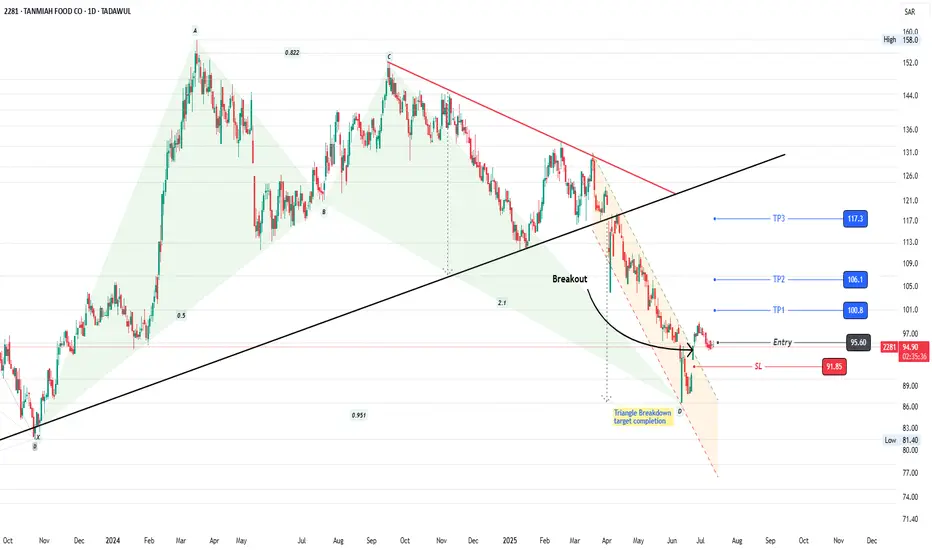
2281: Bullish Harmonic Pattern2281: Bullish Harmonic Pattern
2281 is struggling since last ATH in Sept 2024. Beautifully forming a Bullish harmonic pattern at significant support level.
Breakout of descending parallel channel is observed. Formation of HH and HL confluence is also favoring bulls.
Take Entry now or
After formation of another HH (breakout of psychological support level of 100)
Trail your stop loss accordingly.
Manage your risk.
Enjoy the ride!
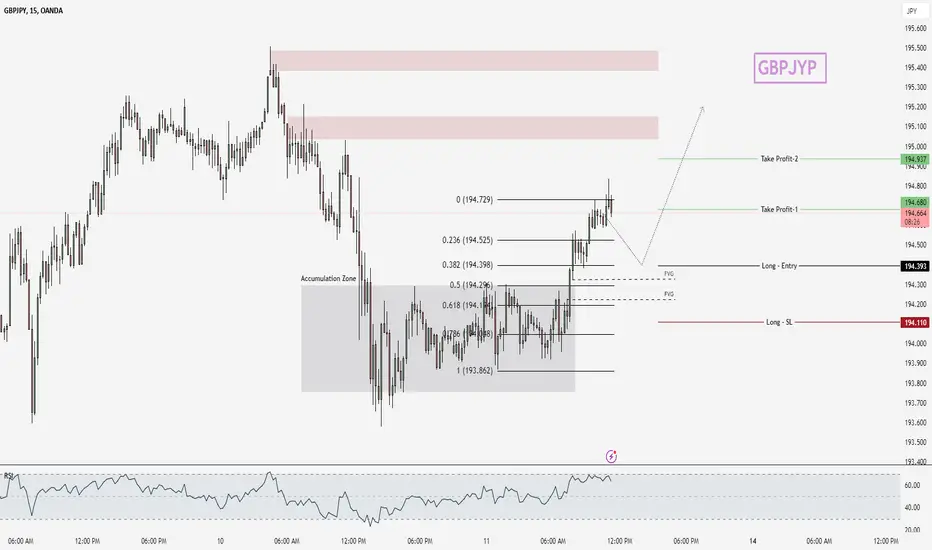
GBPJPY - Technical Analysis [Long Setup]🔹 GBPUSD Analysis on 15m chart
- The current Trend is BULLISH
- Simple trade on HHs HLs
🔹 Trade Plan
- Entry Level = 194.393
- Stop Loss = 194.110
- TP1 = 194.680
- TP2 = 194.937
🔹 Risk Management
- First TP is 1:1
- Second TP is 1:2
🔹 How to Take Trade?
- Only risk 2% of your portfolio
- Take 1% risk entry with 1:1 RR
- Take 1% risk entry with 1:2 RR
Like and subscribe to never miss a new idea! ✌🏼
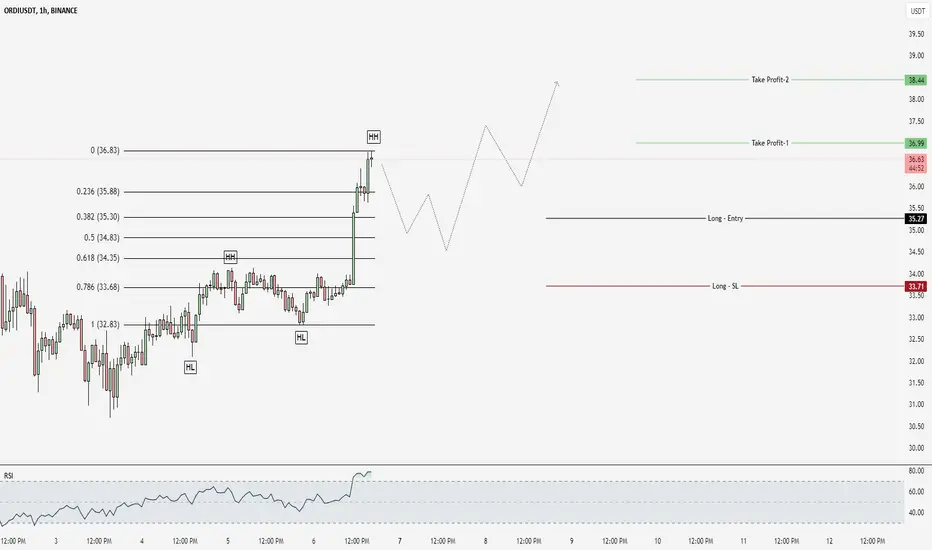
ORDIUSDT - Technical Analysis [Long Setup]🔹ORDIUSDT Analysis on 1HR chart
- The current Trend is BULLISH
- there is no divergences
- Lets take entry at HL
🔹Trade Plan
- Entry Level = 38.44
- Stop Loss = 33.71
- TP1 = 36.99
- TP2 = 1.578
🔹Risk Management
- First TP is 1:1
- Second TP is 1:2
🔹How to Take Trade?
- Only risk 2% of your portfolio
- Take 1% risk entry with 1:1 RR
- Take 1% risk entry with 1:2 RR
Like and subscribe to never miss a new idea! ✌🏼
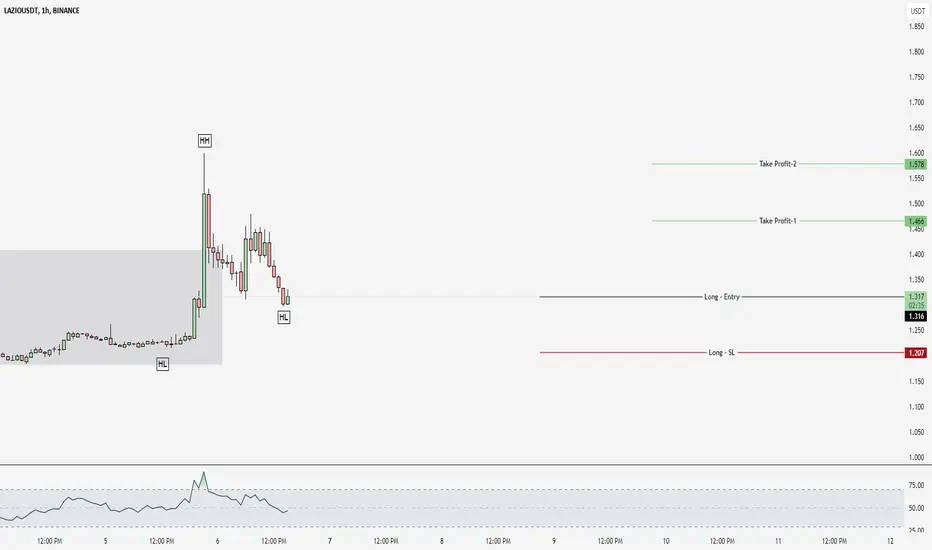
LAZIOUSDT - Technical Analysis [Long Setup]🔹 LAZIOUSDT Analysis on 1HR chart
- The current Trend is BULLISH
- there is no divergences
- Lets target next HH
🔹 Trade Plan
- Entry Level = 1.316
- Stop Loss = 1.207
- TP1 = 1.466
- TP2 = 1.578
🔹 Risk Management
- First TP is 1:1
- Second TP is 1:2
🔹 How to Take Trade?
- Only risk 2% of your portfolio
- Take 1% risk entry with 1:1 RR
- Take 1% risk entry with 1:2 RR
Like and subscribe to never miss a new idea! ✌🏼
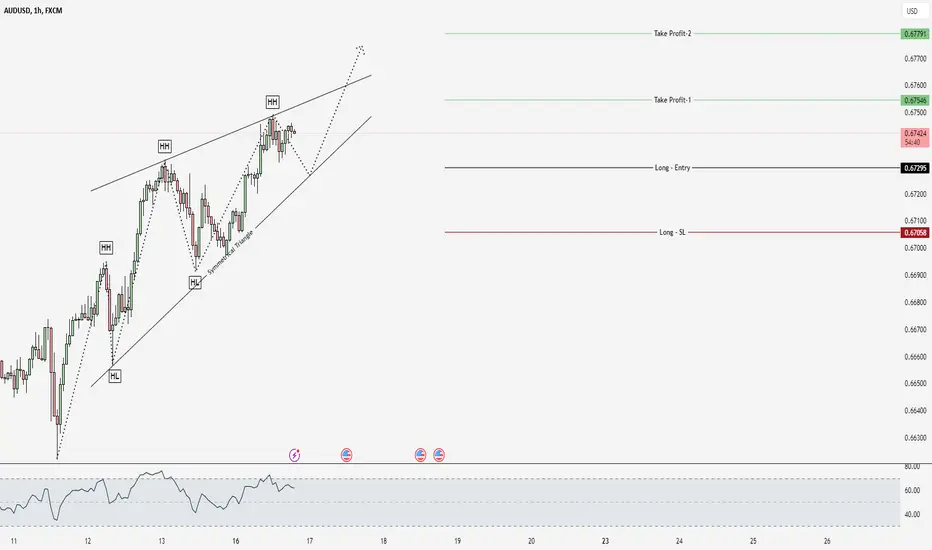
AUDUSD - Technical Analysis [Long Setup]🔹 AUDUSD Analysis on 1HR chart
- The current Trend is BULLISH
- there is no divergences
- Symmetrical triangle is form
🔹 Trade Plan
- Entry Level = 0.67295
- Stop Loss = 0.67058
- TP1 = 0.67546
- TP2 = 0.67791
🔹 Risk Management
- First TP is 1:1
- Second TP is 1:2
🔹 How to Take Trade?
- Only risk 2% of your portfolio
- Take 1% risk entry with 1:1 RR
- Take 1% risk entry with 1:2 RR
Like and subscribe to never miss a new idea! ✌🏼
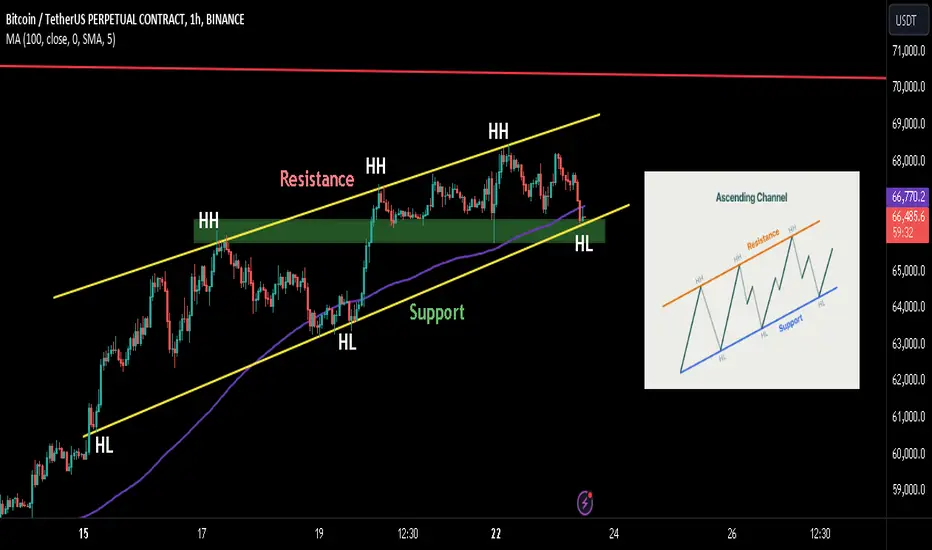
BTC: POTENTIAL ASCENDING CHANNEL FORMATION!Hey everyone!
If you enjoy this analysis, a thumbs up and follow would be greatly appreciated!
Welcome to this BTC quick update.
BTC is forming an ascending channel in 1hr and trading near the support trendline.
We can expect another bounce soon if it holds this support trendline and green support box.
Invalidation of the bullish scenario is if it breaks and closes below the support box ($65.8k)
What are your thoughts on BTC's current price action? Share your analysis in the comments below!
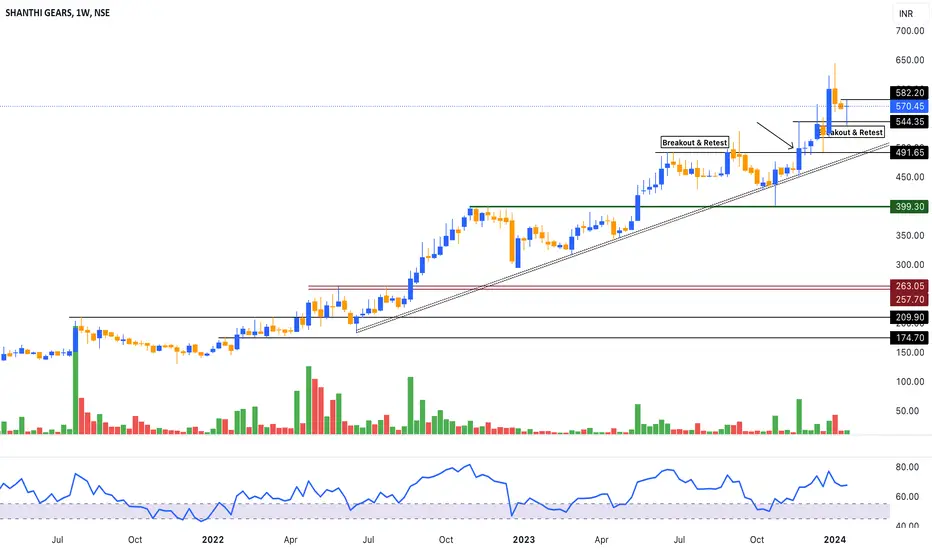
Shanti Gears Weekly Breakout shanti gear is moving in HH-HL Pattern
levels marked one chart
Positive RSI
Positive volume accumulation
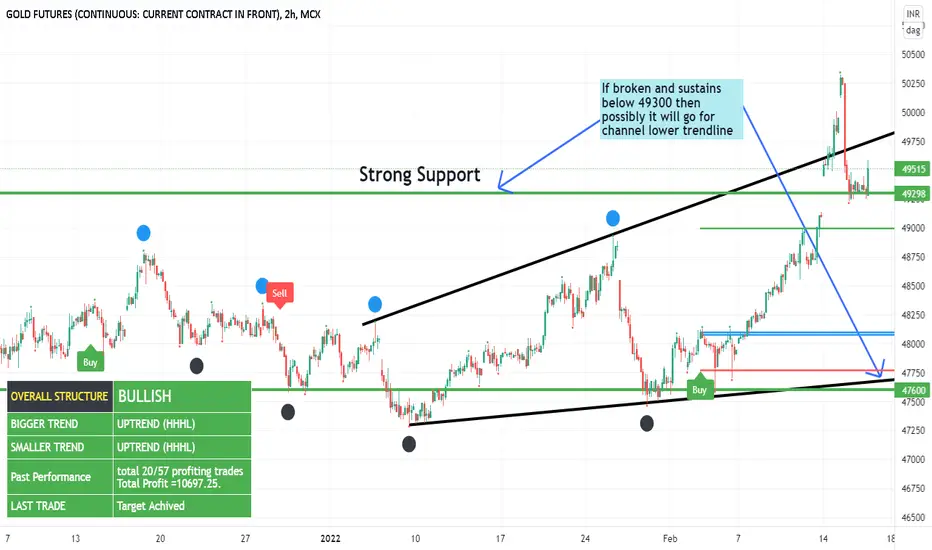
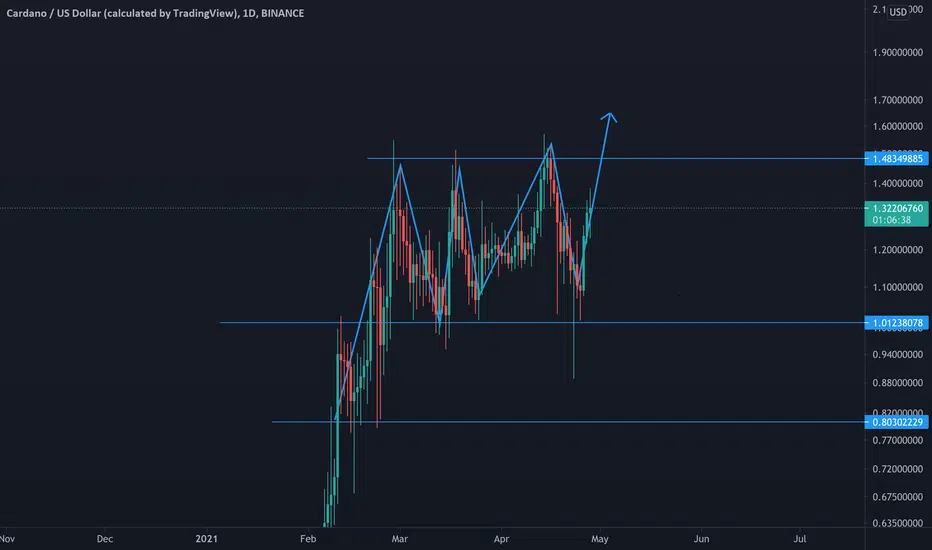
Higher highs Higher Lows setup in GoldGold is making Higher highs and Higher Lows (HHHL) structure and upward channel. If it sustains above 49300 then then will test 50500 again and if it breaks below it then it will take support and lower trendline of the channel.
You can keep 49300 (closing basis) as your Stoploss for the bullish position. Do go for short below with not more than 200 as your risk.
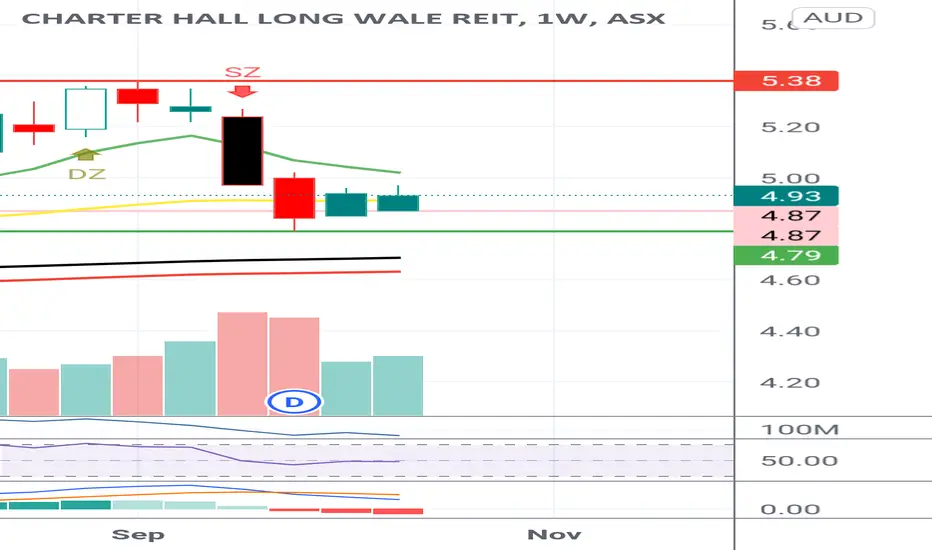
CLW HHHL setup Charter hall, Australia's largest pub owners with a HHHL setup on a quarterly and weekly chart.
With the lockdown ending in VIC and Christmas nearing, I think this stock will break out of the first door at 5.38 and possibilities to retest the $6 door come new years.
Buy after executing 11M or more this week and stop loss at 4.85.
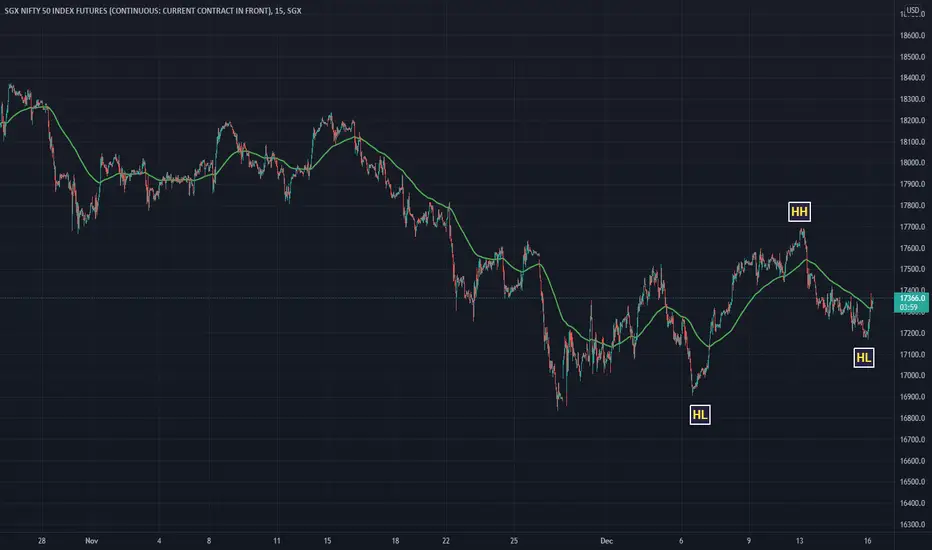
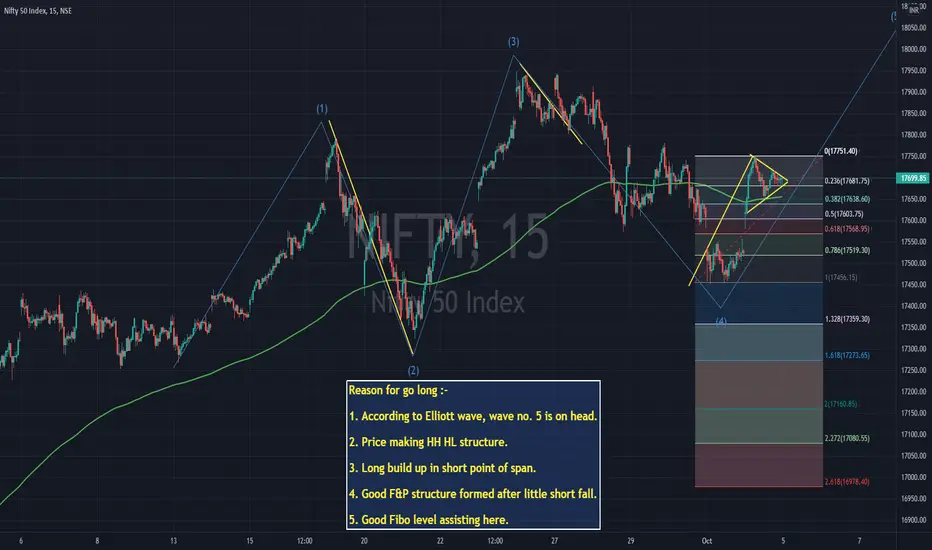
Nifty ViewLooking Nifty for long point of view. Possibility to make fresh High in upcoming sessions.
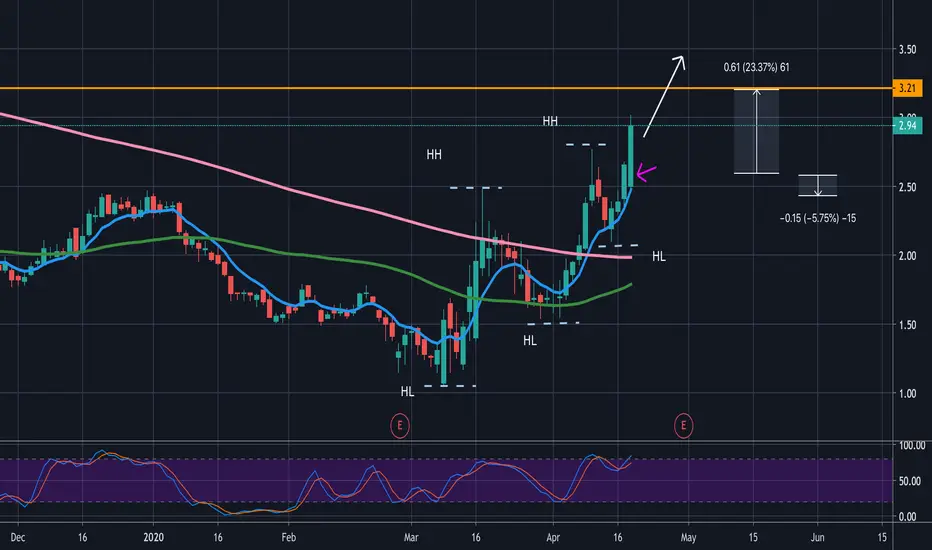
1inch is showing an hhhl construction!!1inch is showing an hhhl construction. we also have some good potentials because of the fundamentals. the new wallet that they launched could be make some momentum. so I say lets go for the ath🚀🚀🚀🚀🚀
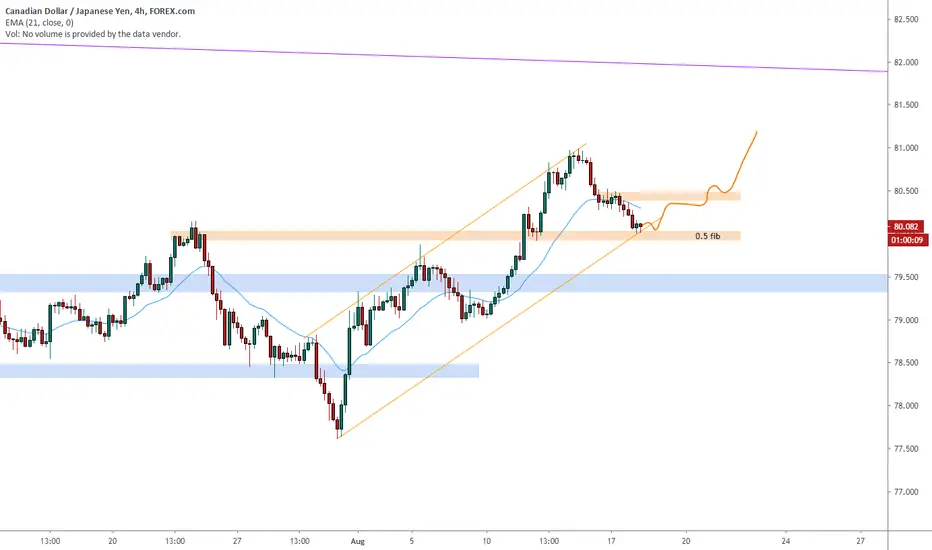
CADJPY on the fib level 🦐After our last call on this pair, we look for another opportunity.
The market has been moving in higher high higer low formation and now just retraced till the 0.5 fib of the previous leg on a previous 4h structure.
IF the market will give again a sign of inversion for a new leg up we can set a nice long order according with our strategy.
–––––
Follow the Shrimp 🦐
Here is the Plancton0618 technical analysis , please comment below if you have any question.
The ENTRY in the market will be taken only if the condition of Plancton0618 strategy will trigger.
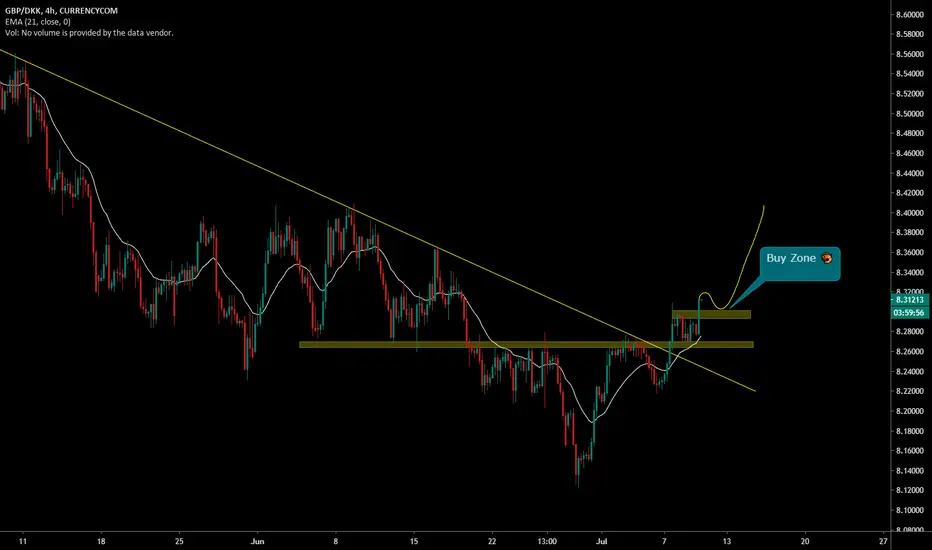
GBPDKK up in a higher high higher low 🦐The market after breaking the discending trendline has break above the lower resistance and retest it
Price now is pushing up to break the 2nd structure in hh hl move.
If the candle will close above the structure we can set a nice long order according with our strategy.
–––––
Follow the Shrimp 🦐
Here is the Plancton0618 technical analysis, please comment below if you have any question.
The ENTRY in the market will be taken only if the condition of Plancton0618 strategy will trigger.
StairwaysNYSE:SWN
Chart patterns are collective reflections of investor sentiments in the market.
Sold too early, but gain is gain. :)
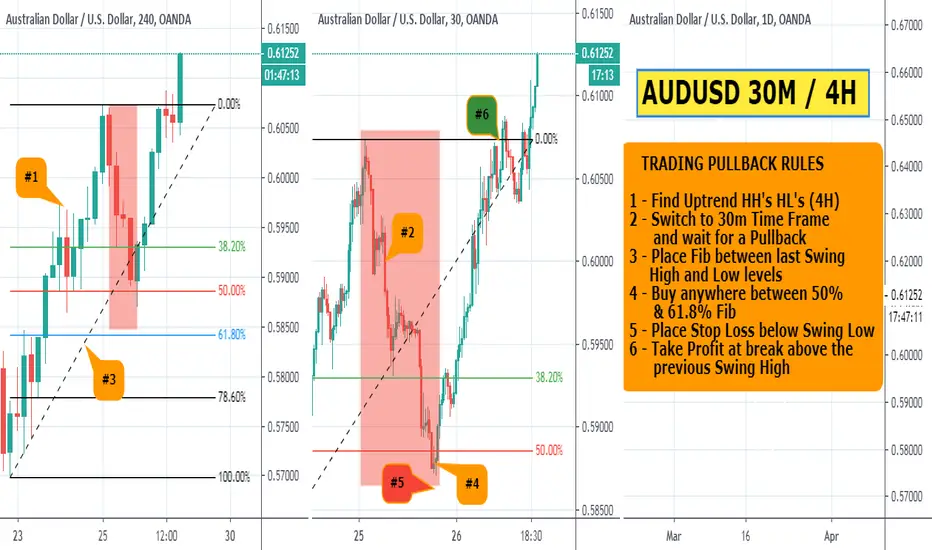
AUDUSD 30M / 4H PULLBACK LONG TRADETRADING PULLBACK RULES
1 - Find Daily uptrend with HH's & HL's.
2 - Switch to the 30m Time Frame
and Wait for a Pullback
against the Uptrend.
3 - Place Fib between last swing
high and low levels,
prior to the pullback.
4 - Buy Anywhere Between 50% and 61.8% Fib.
5 - Place Stop Loss below Swing Low.
6- Take Profit at break above the
previous Swing High.
Higher High and Higher low Uptrend stratagy + my thoughts on WTIthis is how I identify a reversal or uptrend and trade pullbacks.
works best on jpy pairs.

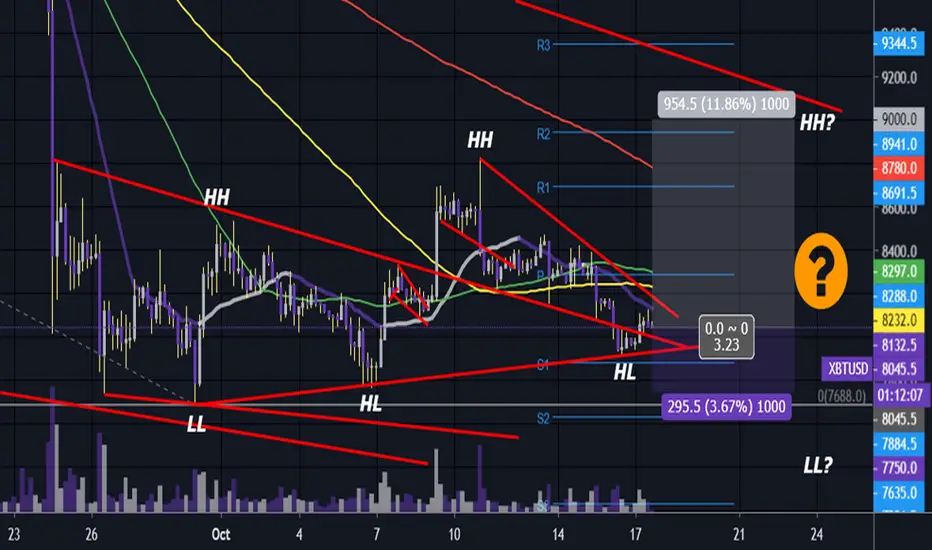
Bitcoin 5x Bottom's in Trade I'm taking a 5x long on Bitcoin here. Market sentiment is pretty bearish at the moment. Many traders on twitter and telegram are thinking 6k. Of course anything can happen, but I'm thinking we will hold the weekly 100ma @7765. We can see a sequence of HL and HH has been established.
Also Bitcoin has never closed below the 2day 241ma @6613.
A close below this level would mean doom in my opinion. But being 6 months away from the halving, the hashrate at an all-time high, and sitting on top of the weekly 100ma which is confluent with the previous resistance of early May of this year, I feel we are going up from here.