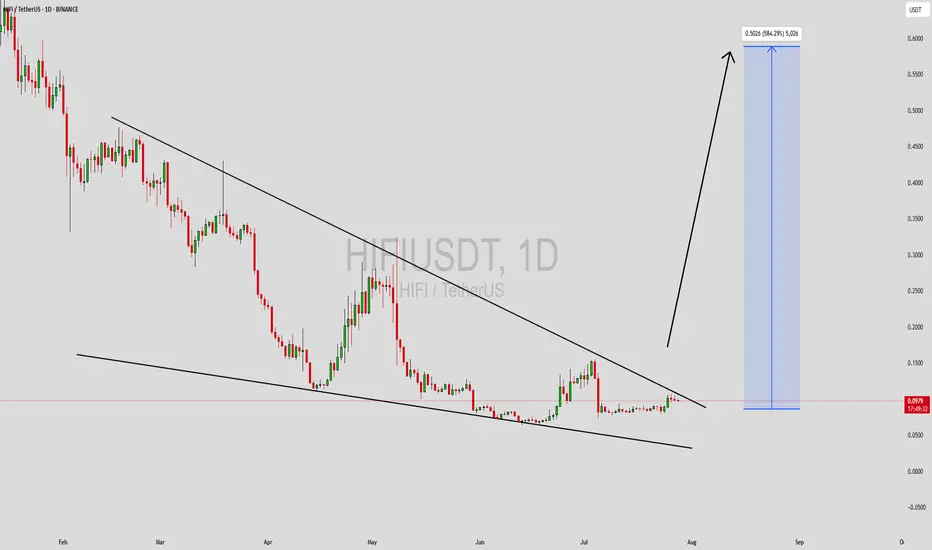
HIFIUSDT Forming Falling WedgeHIFIUSDT is currently displaying a classic falling wedge pattern, a powerful bullish technical setup that often precedes a major trend reversal. This pattern forms as price compresses within converging trendlines, indicating declining volatility and seller exhaustion. Falling wedges are known for their high breakout success rate, and the current structure on HIFIUSDT is pointing toward a potential explosive upside move once resistance is broken.
The volume profile also supports the bullish case. There has been a noticeable increase in buy-side activity around key support zones, reflecting renewed investor confidence and accumulation at lower levels. When paired with a falling wedge, this kind of volume behavior often marks the beginning of a strong upward rally. Traders and investors anticipating a breakout could potentially see a remarkable 490% to 500%+ gain if the momentum continues to build.
The market interest in HIFI is growing rapidly, with increased mentions across trading communities and social platforms. The fundamentals of the project, combined with this bullish technical setup, are attracting both short-term speculators and long-term holders. The current structure also aligns with historical breakout patterns seen in similar altcoins before major bull runs, making it a compelling chart to watch closely.
For technical traders, a confirmed breakout with above-average volume from the wedge resistance will likely trigger a wave of buying pressure. Managing entries on breakout retests and using proper stop levels will be key to navigating this setup with discipline.
✅ Show your support by hitting the like button and
✅ Leaving a comment below! (What is You opinion about this Coin)
Your feedback and engagement keep me inspired to share more insightful market analysis with you!
HIFIBTC
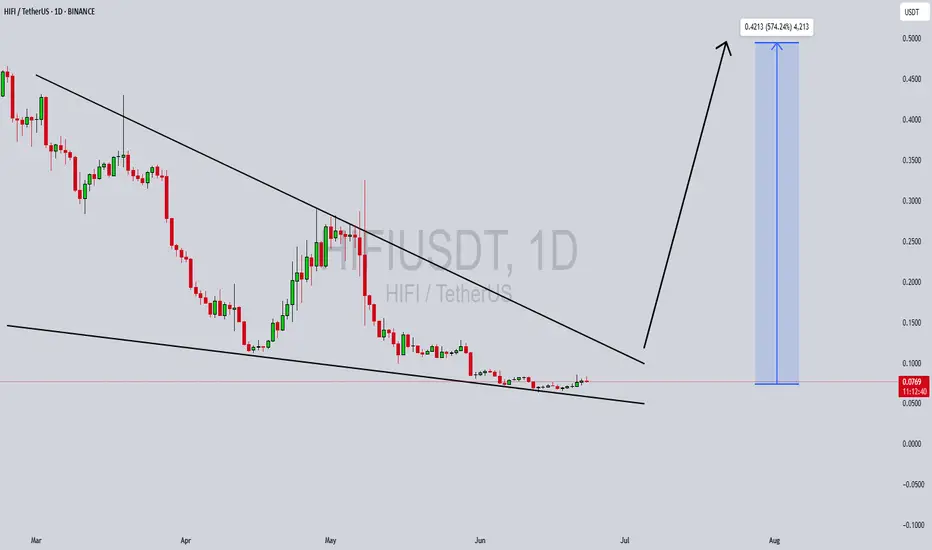
HIFIUSDT Forming Falling Wedge HIFIUSDT is forming a textbook falling wedge pattern on the chart, a classic bullish reversal signal that often precedes strong upside movement. This pattern occurs when price action consolidates between two downward sloping trendlines, gradually tightening before a breakout to the upside. The current structure on HIFIUSDT suggests that the selling pressure is losing momentum, and a breakout could trigger an explosive bullish run. With technical confirmation building and a tightening wedge structure, traders and investors alike are starting to take serious interest in this setup.
Volume analysis further supports the bullish bias. Despite the decline in price, volume has remained relatively stable, a sign that the coin is being quietly accumulated. This kind of price-volume divergence typically precedes major market moves. As the wedge approaches its apex, a breakout with strong volume could ignite a significant price surge. Given the historical price action and chart projections, HIFIUSDT has the potential to deliver an extraordinary 490% to 500% gain from current levels, making it one of the most promising technical plays in the market right now.
Market sentiment around the HIFI ecosystem is also improving, with increased social media engagement, partnerships, and on-chain activity. This suggests that both speculative traders and long-term holders are watching the project closely. As the broader crypto market leans bullish, coins with strong technical setups like HIFIUSDT are well-positioned to outperform.
With its current technical structure, strong community interest, and substantial upside potential, HIFIUSDT presents a rare opportunity for traders looking for high-reward breakout trades. Watch closely for a confirmed breakout from the wedge—this could be the signal that a major rally is beginning.
✅ Show your support by hitting the like button and
✅ Leaving a comment below! (What is You opinion about this Coin)
Your feedback and engagement keep me inspired to share more insightful market analysis with you!
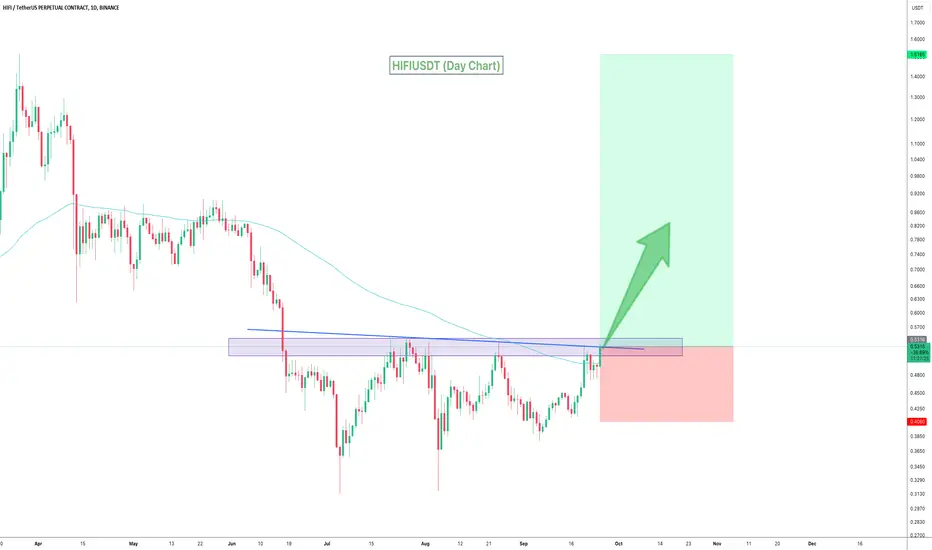
HIFIUSDT Strong Bullish!HIFIUSDT technical analysis update
HIFI's price is breaking resistance after a 100-day range-bound market, and it is currently trading above the 100 EMA on the daily chart. This can be considered a bullish signal for HIFI.
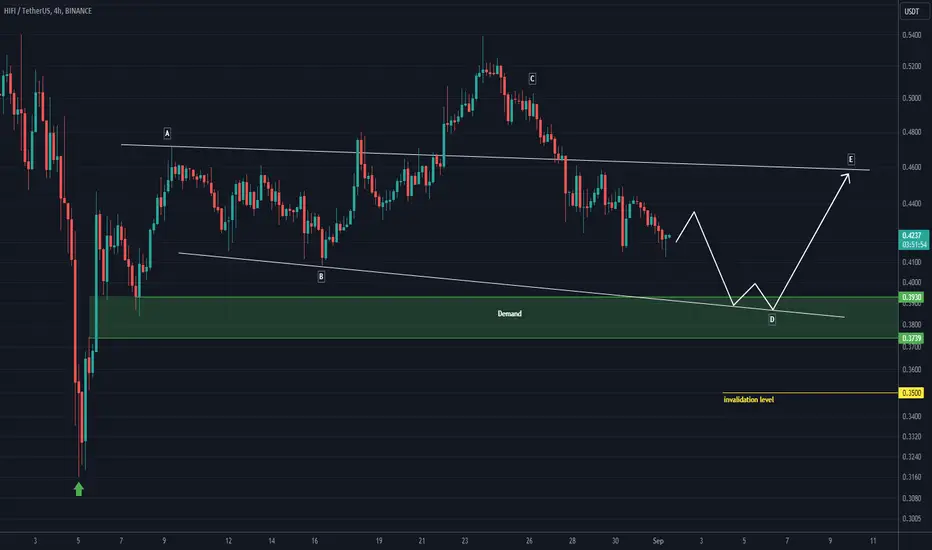
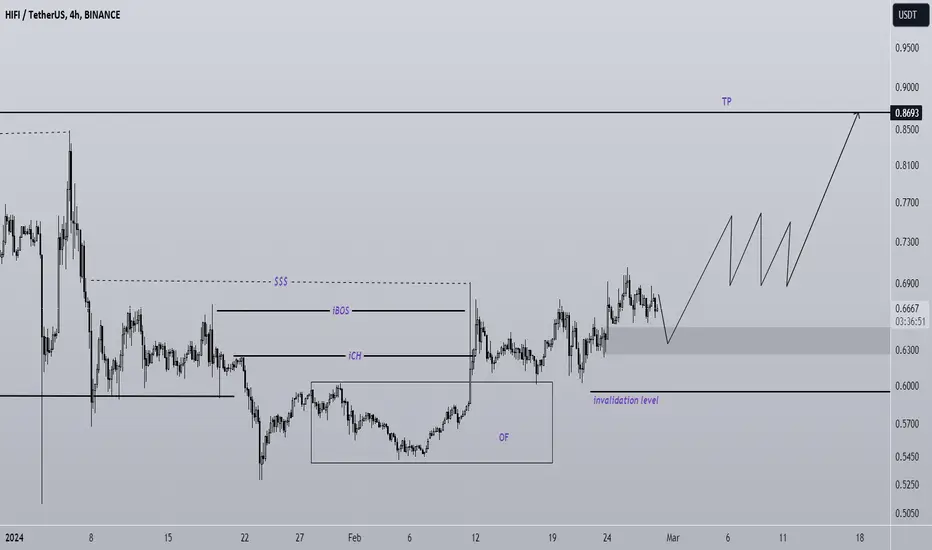
HIFI ANALYSIS (4H)From where we put the green arrow on the chart, it looks like a triangle is forming on the chart.
It seems that we are now in wave D of this triangle.
The E wave can start from the green range.
We are looking for buy/long positions in the green range.
Closing a daily candle below the invaliation level will violate the analysis.
For risk management, please don't forget stop loss and capital management
When we reach the first target, save some profit and then change the stop to entry
Comment if you have any questions
Thank You
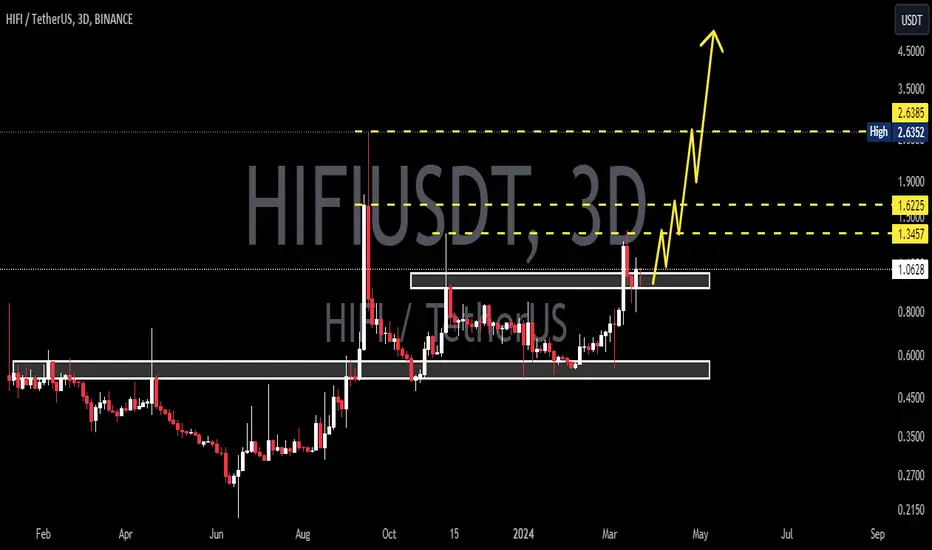
HIFIUSD 3DHIFI ~ 3D 📈
#HIFI Make purchases gradually from here, with a minimum target of 20%+. This is the LSE:RWA Sector, the Narrative of which will Evolve for the next few months.
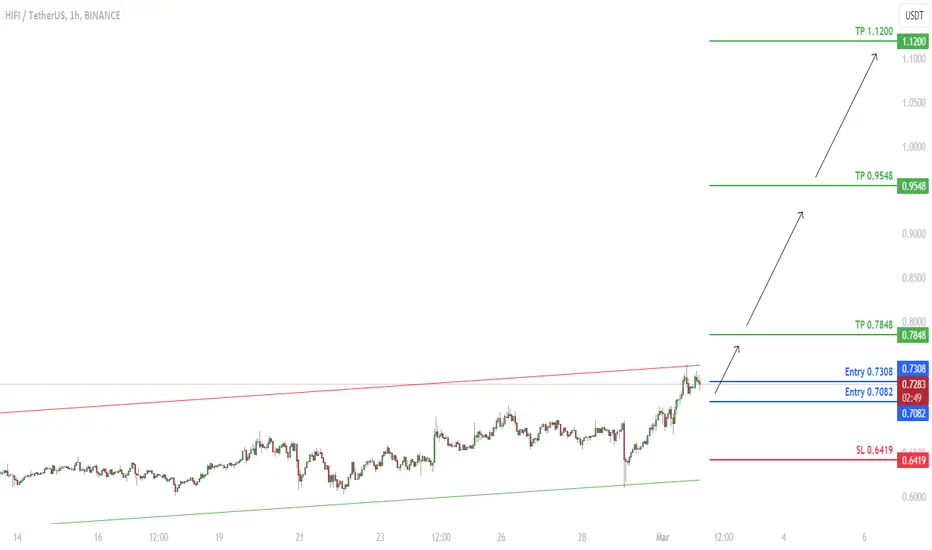
HIFI soon will break above the channelHIFI soon will break above the channel and it will continue to go up
🔵Entry Zone 0.7082 - 0.7308
🔴SL 0.6419
🟢TP1 0.7848
🟢TP2 0.9548
🟢TP3 1.1200
Risk Warning
Trading Forex, CFDs, Crypto, Futures, and Stocks involve a risk of loss. Please consider carefully if such trading is appropriate for you. Past performance is not indicative of future results.
If you liked our ideas, please support us with your likes 👍 and comments.
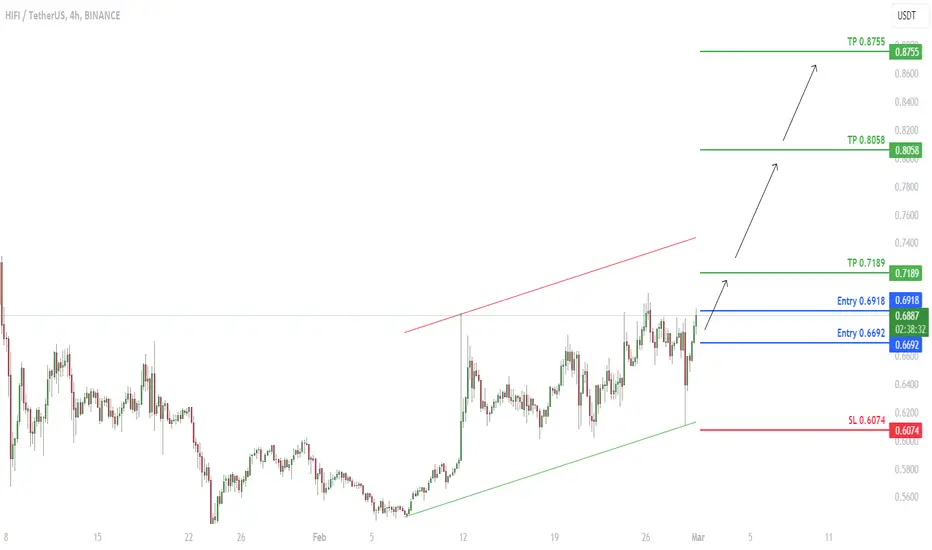
HIFI is going up in the uptrend channelHIFI is going up in the uptrend channel. I expect that it breaks above the channel line
🔵Entry Zone 0.6692 - 0.6918
🔴SL 0.6074
🟢TP1 0.7189
🟢TP2 0.8058
🟢TP3 0.8755
Risk Warning
Trading Forex, CFDs, Crypto, Futures, and Stocks involve a risk of loss. Please consider carefully if such trading is appropriate for you. Past performance is not indicative of future results.
If you liked our ideas, please support us with your likes 👍 and comments.
HIFI buy setupGiven the bullish CH, we have a bullish view on HIFI.
We have sevral liquidity pools above, which is expected to move from the demand range towards this pool.
Closing a daily candle below the invalidation level will invalidate this analysis.
Note that the financial market is risky, so:
Do not enter any position without confirmation and trigger.
Do not enter a position without setting a stop.
Do not enter a position without capital management.
When we reach the first TP, save some profit and try to move the stop continuously in the direction of your profit.
If you have any comments please post them, comments will help us improve our performance
Thanks
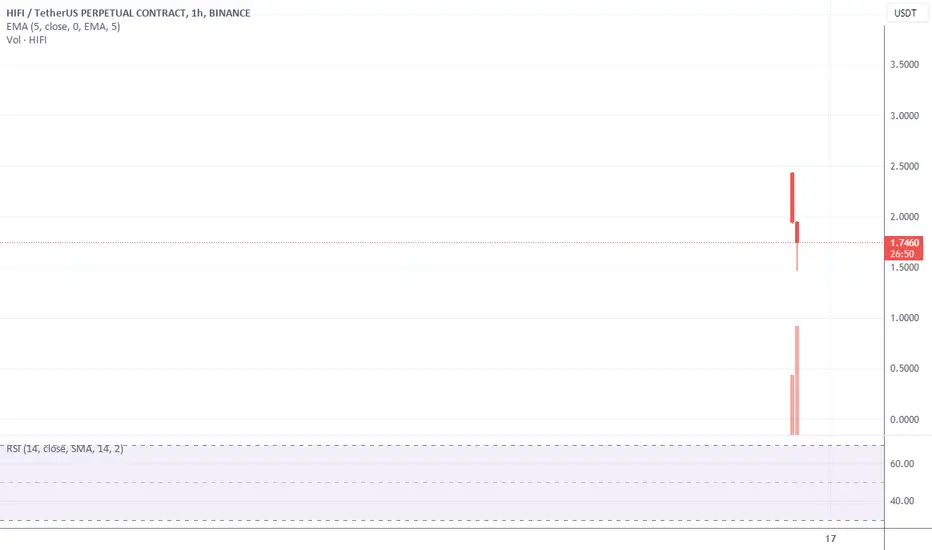
Short HIFIUSDT From 1.75Shorting HIFIUSDT from 1.75 with SL 2.3 and Initial TP 1.3 and will hold rest of 60%
HIFI bounce backed from 2.6, made huge gain of the that, rejecting from there and sharply fell shown then buyers has been out from game,
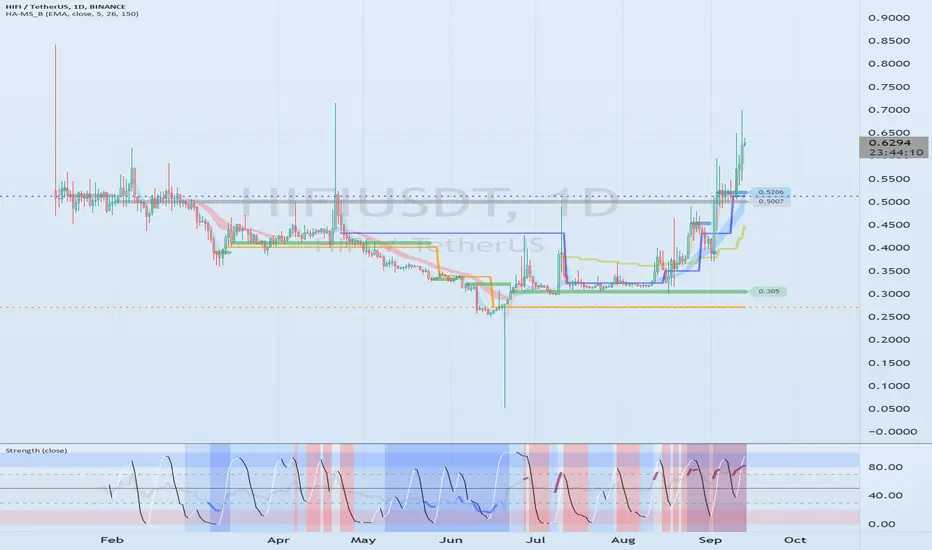
Important volume profile section: 0.5007Hello?
Hello traders!
If you "Follow" us, you can always get new information quickly.
Please also click “Boost”.
Have a good day.
-------------------------------------
(HIFIUSDT chart)
Since the chart was created recently, there is not much that can be learned from this chart.
However, it is important that it has risen above 0.5007, which is an important volume profile section in the current trend.
Currently, the 1M chart and 1W chart appear to be trying to establish a new volume profile section.
I think this shows that a lot of buying is currently on the rise.
-------------------------------------------------- -------------------------------------------
** All explanations are for reference only and do not guarantee profit or loss in investment.
** Trading volume is displayed as a candle body based on 10EMA.
How to display (in order from darkest to darkest)
More than 3 times the trading volume of 10EMA > 2.5 times > 2.0 times > 1.25 times > Trading volume below 10EMA
** Even if you know other people’s know-how, it takes a considerable amount of time to make it your own.
** This chart was created using my know-how.
---------------------------------