EURAUD 4HPullback just about complete, along with the inverse head & shoulders pattern I had mentioned earlier. Now price Is sitting on daily support, creating its higher low & now may be looking to form a new high & now as an uptrend.
Higherlow

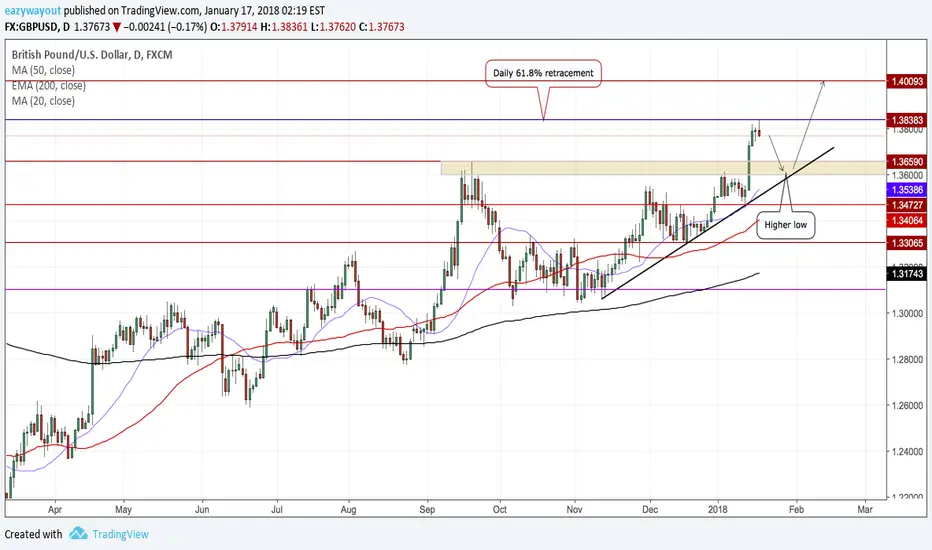
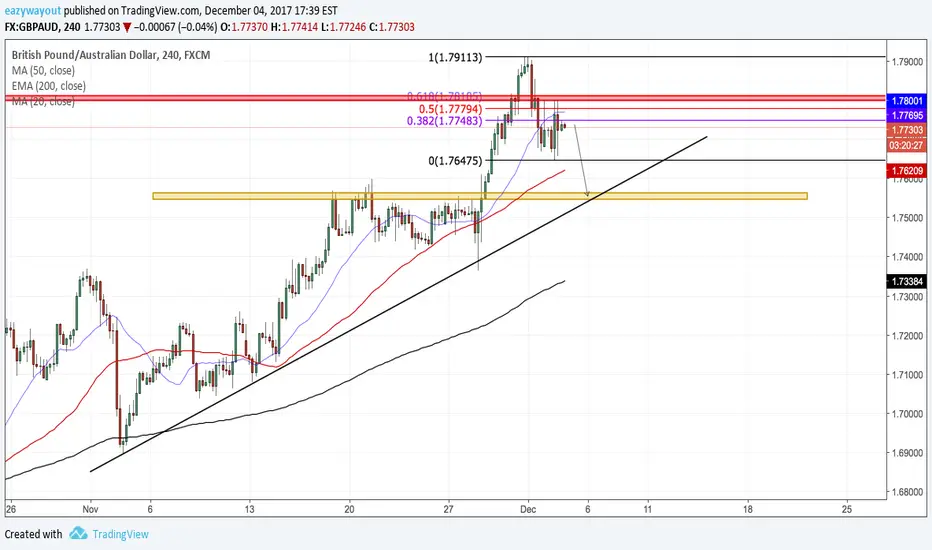
GBPUSD DAILYPrice now rejecting off strong weekly resistance / 61.8% fibonacci retracement level. Price is not due for a pullback (higher low) which we may see coming shortly before a potential strong move to create a higher high
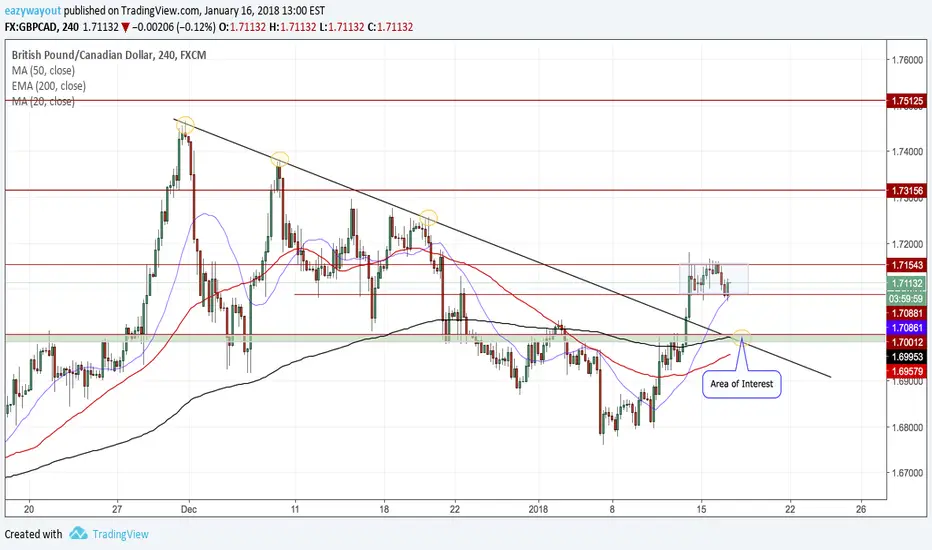
GBPCAD 4HPrice is in a tight range currently, we could see a potential breakout to the downside to retest its broken trendline, before continuing its uptrend.. Watch price once at the green zone
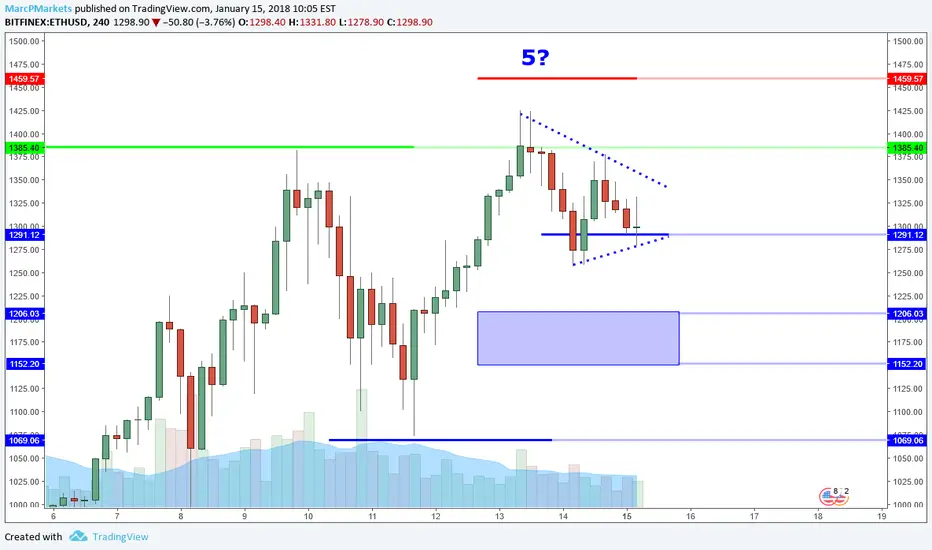
ETHUSD: Higher Low Forming Sets Up Next Attempt To 1424.ETHUSD update: The 1291 minor support level has generally held while price is attempting to retest the level again. The resulting higher low formation is a reversal structure that implies strength. On top of that price has been consolidating into a triangle which often results in trend continuation.
I wrote about the swing trade potential around the 1291 level in my previous report while this market was pushing into the 1250s. I also wrote that IF price can show some form of reversal pattern in the area, it would offer a swing trade opportunity because risk will be better defined compared to the current 1459 target.
As of now, I am long from 1311.65 with a stop at 1243 and target at 1395. The reward/risk is actually 1.2/1. It is not spectacular, but what I am looking at more is the price structure and probability of the bigger picture trend reasserting itself. Price may be fluctuating over the next day or so, but the bias is clearly bullish based on price structure. Price has also tested a projected support (1291) twice resulting in a higher low which is a clear momentum reversal pattern. The current candle took out the previous candle high and is attempting to close strong. For MY swing trade plan, there is enough criteria to take a risk because I am now in line with the momentum and bigger picture trend.
Have I gone mad? Has the market finally sucked me into an emotional trade? Not quite. I am simply following my plan. I am in line with the trend, a support as been tested and established and price is now testing it again showing signs of a higher low within a triangle while I can clearly quantify risk and a reasonable target. On top of that, this triangle can be interpreted as a sub wave 4 of the 5th wave that I have been writing about as well. This structure implies there is a better chance for at least one more test of the high.
This trade is slightly aggressive because it is off of a minor support, and I did not wait for the current candle to close strong, but I am willing to take those chances in light of a bigger picture that is generally bullish. There is no perfection or precision, it is a matter of risk tolerance and context. If this market falls apart, which is always a possibility, I have a stop in place. It is wide, BUT I compensate for that with my size.
In summary, one of the basic tenets of TA is "history repeats itself" and that is what pattern recognition is all about. I have seen this situation countless times, and when enough factors line up within the criteria of MY plan, then I am comfortable taking risk. The current price action FOR ME is clearly presenting one of those opportunities. Charts offer tools to help organize price information, but if your experience is limited when it comes to interpreting that information, then you will have trouble seeing the "context" which is not as obvious. This is one of the reasons why everyone was calling for BTC to go to 5K and I went long at 13150. Interpreting context requires a deep understanding of how markets work and is a function of experience which goes beyond what you can see on a chart. Things change fast in these markets, and that is why holding onto an opinion is not a good idea, especially on smaller time frames. I look for factors to line up that help me determine direction, risk and reward. Once I have that information, and it is acceptable to MY tolerance, I take a trade and that is what you see here.
Comments and questions welcome.
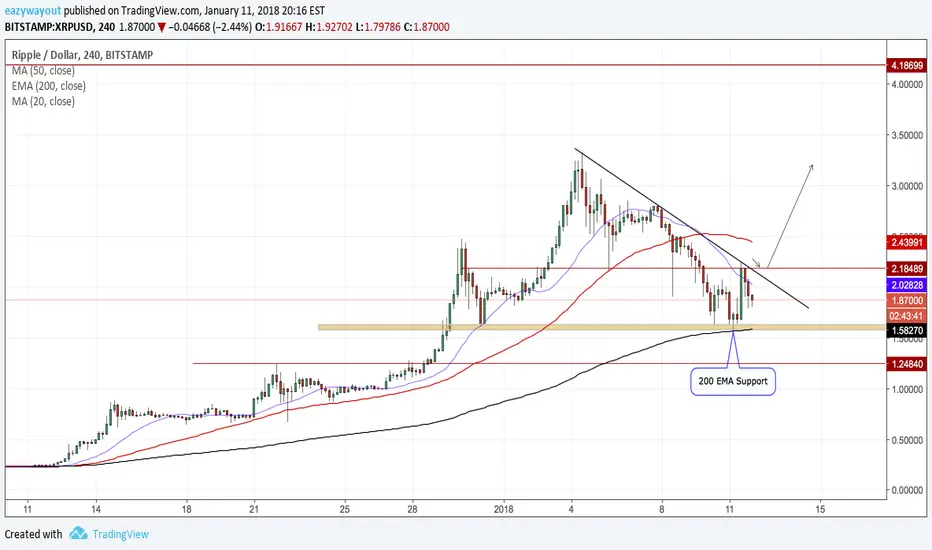
XRPUSD 4HStill watching this pair, we now have got a nice correction, rejecting daily support. Watch for a break of the counter trendline to recent highs & potentially new highs. Patience time will tell for this crypto ..
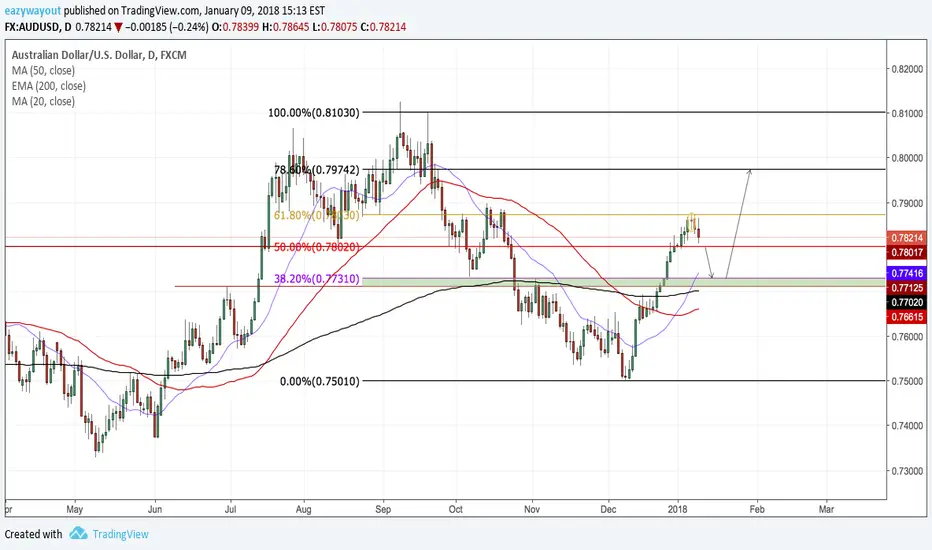
AUDUSD DAILYAwaiting a break of the 50% fib for shorts to create a (higher low), before a continuation higher..
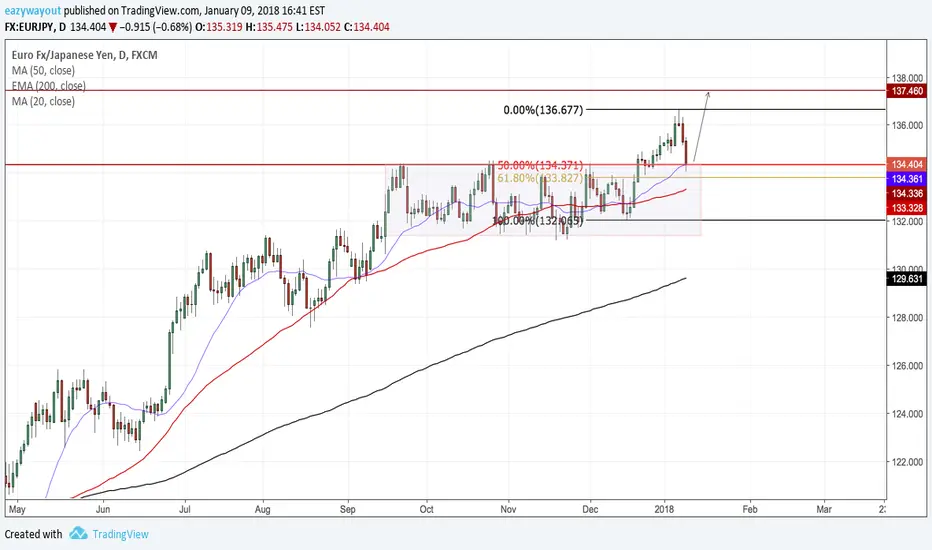
EURJPY DAILYPrice now completing its higher low, sitting on previous consolidation now acting as support, will we be seeing a new higher high shortly?!
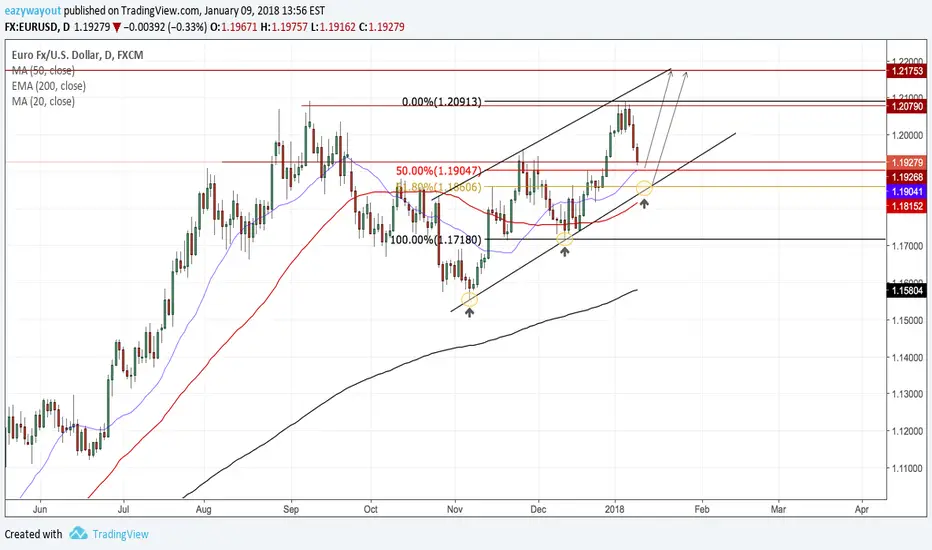
EURUSD DAILYThis is what ill be looking for next on the euro/dollar. Price is currently testing 1.19250 daily resistance, if we get a daily close below the next area I will be looking at is 1.19000 where I will look to see how price reacts, & potentially a pullback to the 61.8% fib is likely to make a 3rd touch to the channel bottom.
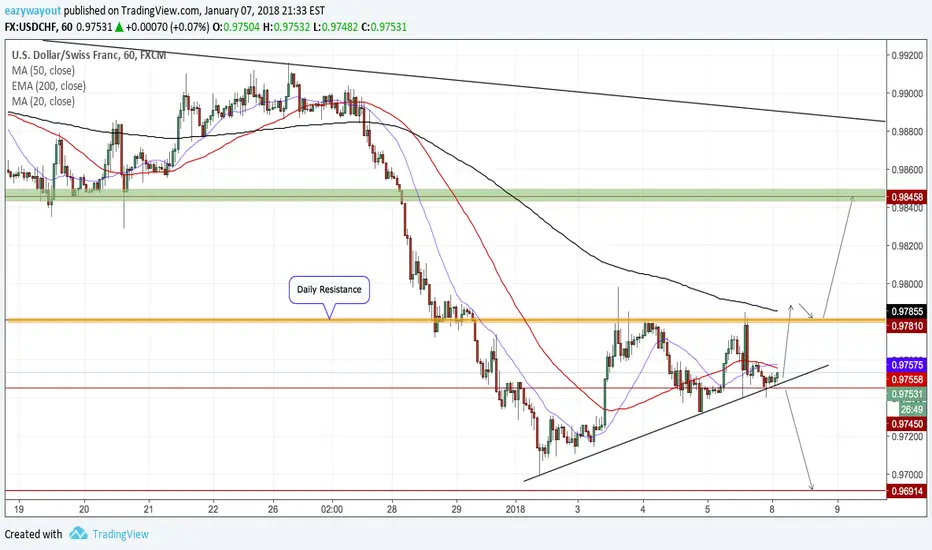
USDCHF 60Will be watching for price action to choose a direction, currently I believe bullish but will wait for more confirmation..
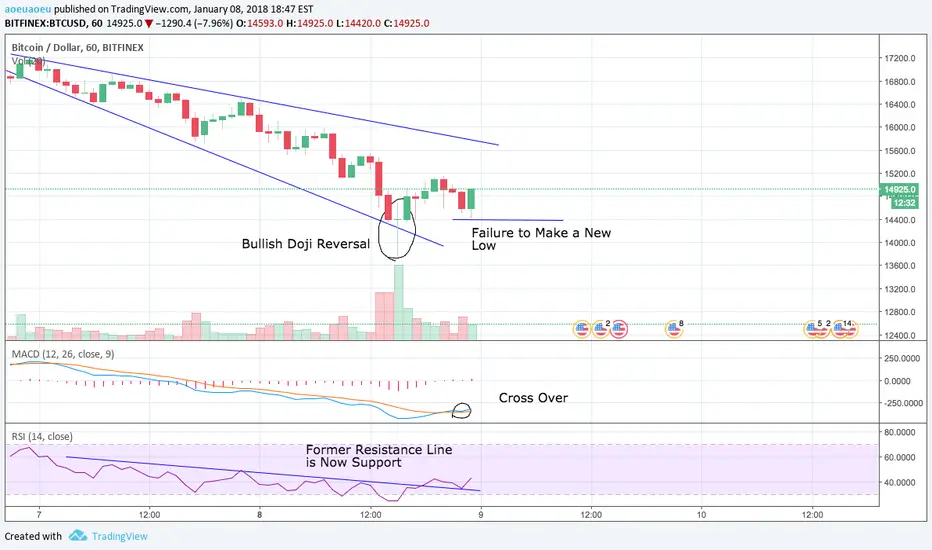
BTC Short Term Bounce?Whenever, the price goes up or down too fast, the price almost always retraces. Bitcoin has gone down 20% over the last two days, and is looking to make a short term bounce. A quick glance at the RSI and we see that it has broken the former trend line, which now is the support line. The RSI is no longer in a downtrend, but starting a uptrend. There also a cross over on the MACD, indicating the bears are losing momentum and can't drive the prices lower.
At the bottom, we see a long doji candle. These type of candles are often a powerful reversal signal. In addition, Bitcoin failed to made a higher low, which could mean that the downtrend is over.
Possible Trade Setup:
Stop Loss: 13700 (Slightly lower than the current low)
Target: 15740 (upper trend line in descending triangle)
What is a cross over?
www.google.com
What is a doji candle?
www.google.com
AUDJPY DAILYPrice is currently at daily resistance, I am looking for a retracement for longs or a daily break & retest above resistance turning support for buy opportunities..
XRPUSD (Ripple)Elliot wave waiting for higher low to complete, will be watching for touch to the 50 fib for longs..

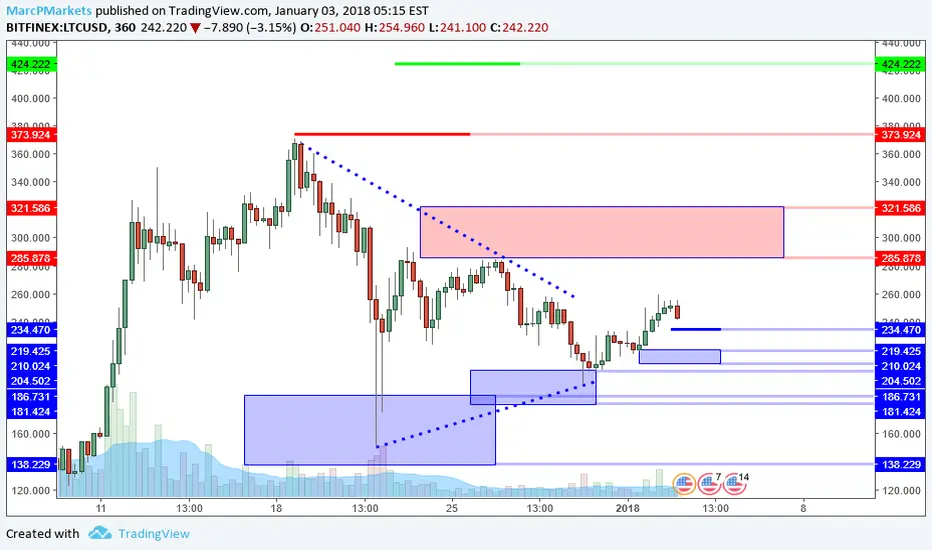
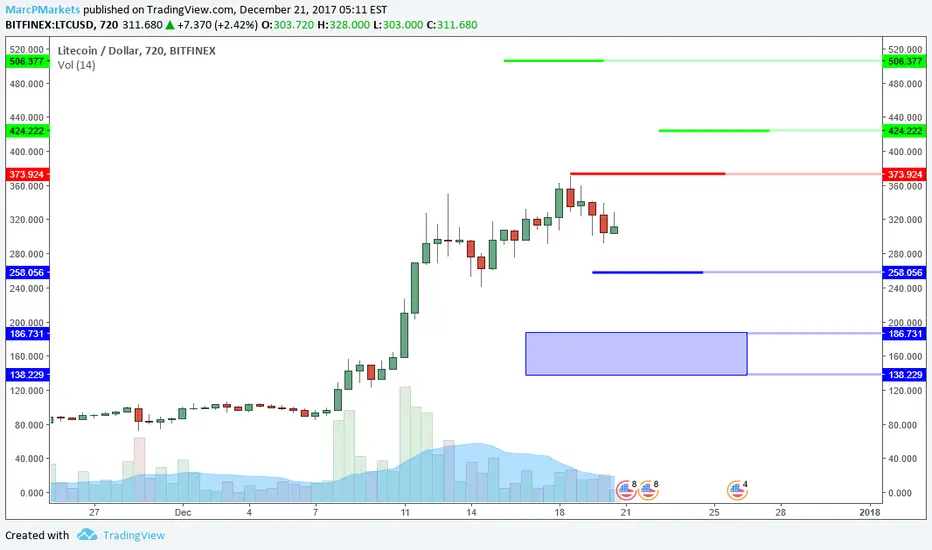
LTCUSD: Triangle Breakout Can Lead Back To 300?LTCUSD update: Consolidation breakout occurred with price now trading just under 250. At the moment, based on the current structure, momentum is bullish and is more likely to work its way into the 285 to 321 resistance zone.
Just like BTC, this market has formed a higher low in recent price action which is clear momentum reversal. This formation has lead to the breakout of a triangle that has been developing for two weeks (since the 370 high.) The focus now is on the potential retrace levels that would offer an attractive reward/risk opportunity to go long.
As I write this, price is hesitating within a mini consolidation (a series of inside bars) which is taking place within the area of a previous peak (257.40). This minor resistance can lead to a retest of the 234 level which is the .382 of the recent bullish structure, or the 219 to 210 support zone which is the .618 area relevant to the same structure. These levels are minor supports but do provide prices to watch that offer more attractive reward/risk compared to where price is now.
IF price can retest these areas, a reversal pattern or higher low (just like the one in place around the 220 area) would be the justification to go long. As you can see from the chart. the target is the 285 to 321 resistance zone which is the .618 area relevant to the recent bearish structure. Price has been staying within these broader resistance and support zones which has lead to the triangle that is now obvious on the chart.
Risk will have to be measured at the time the bullish reversal pattern occurs. What to avoid in a situation like this is premature entry. IF price falls through the oncoming supports, then it is more likely to test the low 200s or even the 190s for a possible double bottom formation. That scenario would offer the most attractive buying opportunities, especially for longer time horizon trades.
In summary, the levels that are projected on this chart offer a better possibility of where price can react or reverse. They provide reference points where you can anticipate price action rather than react to it. The key to using this information effectively is to observe and evaluate the outcome of the price action at the time the levels are reached. Not jump in blindly. What you are looking for is price action to prove it is more likely to follow the anticipated scenario and that often unfolds in the form of a reversal pattern. The hardest part is WAITING in the face of building emotional pressure and impulse. By letting the market prove itself, you at least align your thoughts and actions with what the market is more likely to do rather than what you think.
Comments and questions welcome.
GBPUSD DAILYPrice close below top trendline, expecting a possible slight retracement to broken resistance turning into support...
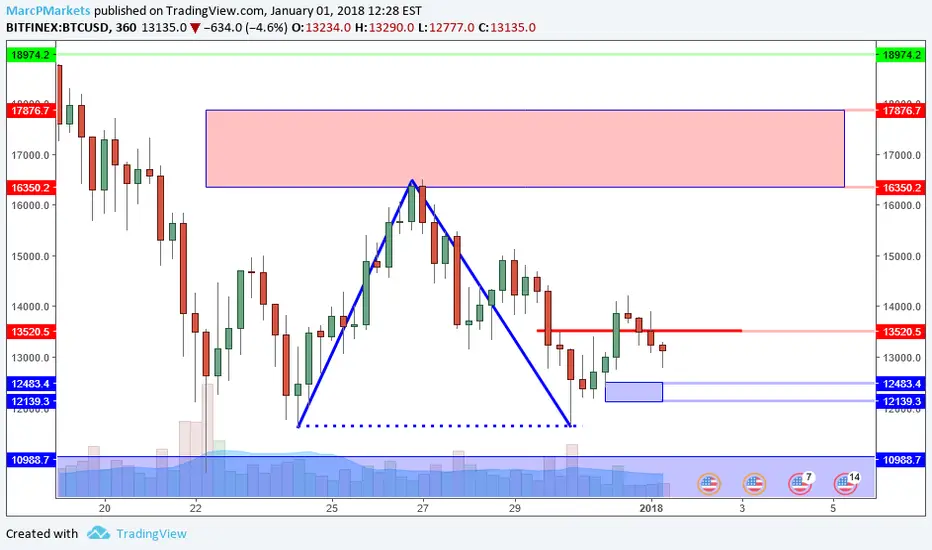
BTCUSD: A Reversal Here Can Spark New Rally?BTCUSD update: Higher low in progress just above the minor support area of 12483 to 12139 as bearish price momentum continues to maintain control. Now is the time to watch carefully for a swing trade long entry.
As I wrote about in my previous report, there is an infrequent broader reversal structure in play. The subsequent resistance level has been taken out (13520) and the next step is to evaluate the following retrace for a swing trade long entry. The market is following the scenario so far, and presenting the anticipated higher low. Now the question is: when to enter the swing trade long?
The answer is in how the current candle closes. If it closes on it's lows, then there is no reason to enter if you are waiting for momentum to be in your favor. Buying when momentum is going your way minimizes pain and randomness from the setup over time.
I am waiting for a break of the high of a pin bar or inside bar to occur which would be around 13300 at the moment. That would trigger a swing trade long with a stop around 12100 and a target of 16200 which is around 3:1 reward/risk. This swing trade would be separate from the position trade that I entered into the other day that has no stop or target (explain in that report). It would be especially notable if these candle stick formations appear within the 12483 to 12139 minor support zone which is the .618 area relevant to the recent bullish swing.
Waiting for the close of the candle helps to minimize premature entries which often lead to losses. At the moment, price can still continue lower and even retest the 11600 lows. IF that happens, I would be looking for reversals to add to my position trade as well. Prejudging a candle before it closes is a bad habit because you are assuming it is going to close in a way that may not happen (this is especially common on larger time frames). Patience pays especially in preventing potential losses.
In summary, not a whole lot has changed in terms of technical formations. The biggest lesson you can take away from a situation like this is that markets stabilize at tops and bottoms over time. It is a process, NOT an event. People who got sucked into buying this market too early, and too big are now at the mercy of the market. Not a good position to be in, but this behavior that payed off two weeks ago is the same behavior that is going to wipe out the inexperienced and impulsive eventually. In my opinion, it is better to miss out than to win and give it all back because when you lose, you lose more than capital, you lose confidence which is a magnitude of loss that cannot be measured in dollars. Slow and consistent requires knowledge and a strong self awareness. That is was trading is really all about, not charts, oscillators and news. Improve your success rate by first identifying and eliminating ineffective behaviors and becoming more aligned with your risk tolerance. It will help you separate yourself from the herd mentality.
Comments and questions welcome.
AUDUSD 4HPrice is due for a higher low now back to daily weekly support, before another move to the upside
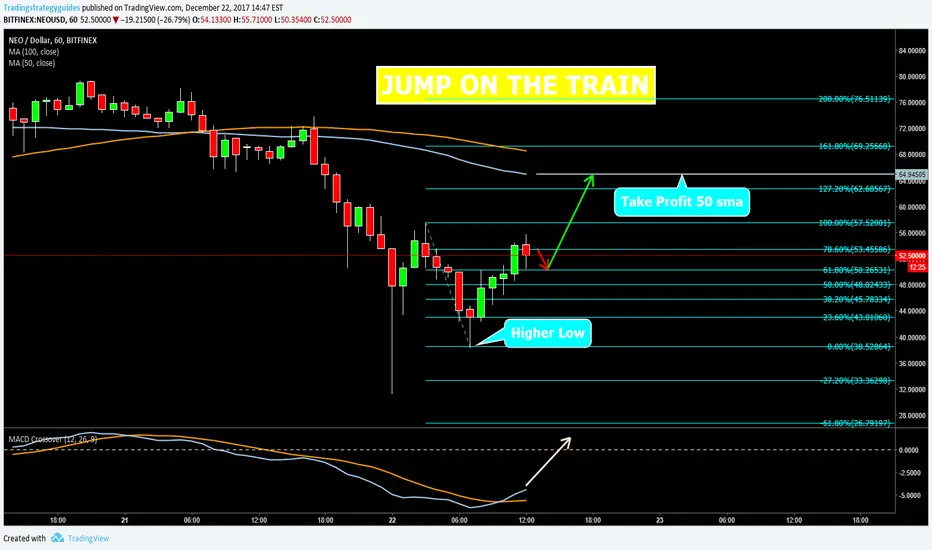
JUMP ON THE TRAINTake a short scenic route to some profits.
Why a long trade?
Higher lows developed.
Price has been away from the 50 sma for awhile.
Macd has crossed above the red signal line.
Watch pullback back to between 38.2% and 61.8% fibs then long.
Take Profit at the 50 sma. Confluence with 127.2% fib line.
Tell us how you would trade this pair!
LTCUSD: The More Attractive Level To Buy.LTCUSD update: Retracing from 370 high, price is beginning to hold. Is this a good place to buy for the next leg up? And how high can it go?
From the short term trading perspective, buying the pullback in a strong market is the more effective behavior compared to buying into highs. The tough part is when do you buy into the pullback? And how do you know it won't pull back further? This is where the projected levels come into play.
Projected levels on larger time frames carry more weight and are more reliable than the levels measured on smaller time frames. That is why I am watching the 258 support (.382 of bullish structure measured from 84 low). If I am going to buy for a swing trade, I prefer to start looking for reversals that I can measure risk from (like a double bottom on a smaller time frame) in this area because a retest and reversal still keeps the broader trend intact while offering attractive reward potential based on the information available at the moment.
It is not unreasonable to expect a retest of the 370 high if the market can stabilize within a higher low area. The key to trading this effectively is waiting for the retest and confirmation which the market may NOT offer at all. You may wonder, "Then why wait for 260? Just buy it once it starts going up from any support and as long as the reward potential is greater than your risk, its okay? Otherwise you miss all the huge gains!". Adjusting to a level that the market decides to stabilize around other than the projected support is fine, BUT you need to realize when the noise comes back into these markets, you will be giving back the the "GAINS!" that you acquired by getting sucked in to many false starts. This is about forming habits that lead to consistency, not "you only made 100% when you could have made 500%!", that same mentality will set you up to donate your account back to the market once this environment returns to reality. A consistent profit is more valuable to me than a big profit.
If this market breaks the 370 high (which is also the upper boundary of the reversal zone), the next push can take this market to the 424 area which is a 1.0 extension projected from the 241 low. These extensions serve as good estimates of short term profit potential and are essential to evaluating if a trade is worth taking when compared to the risk.
In summary, the purpose for developing a plan of action around levels that are relevant to market structure is to simplify your decision making process and filter out all the false starts and forced trades that lead to a large collection of small losses. The smaller the time frame you trade, the more important it is to have such a process. The inexperienced traders are focused on the amount of profit, but do not realize that same mentality is what leads to over trading. Current market conditions reward such a mentality, but what happens when the environment changes? It always changes. Even as these markets work their way higher in the long run, it does not mean it will be a smooth and bump free ride. Develop the habits that will facilitate base hits, not home runs.
Comments and questions welcome.
Nasdaq Interview: So for those that missed it, my interview appeared in the Nasdaq Twitter feed yesterday. You have to scroll back and look for it (around 11 AM EST). Https://twitter.com/nasdaq
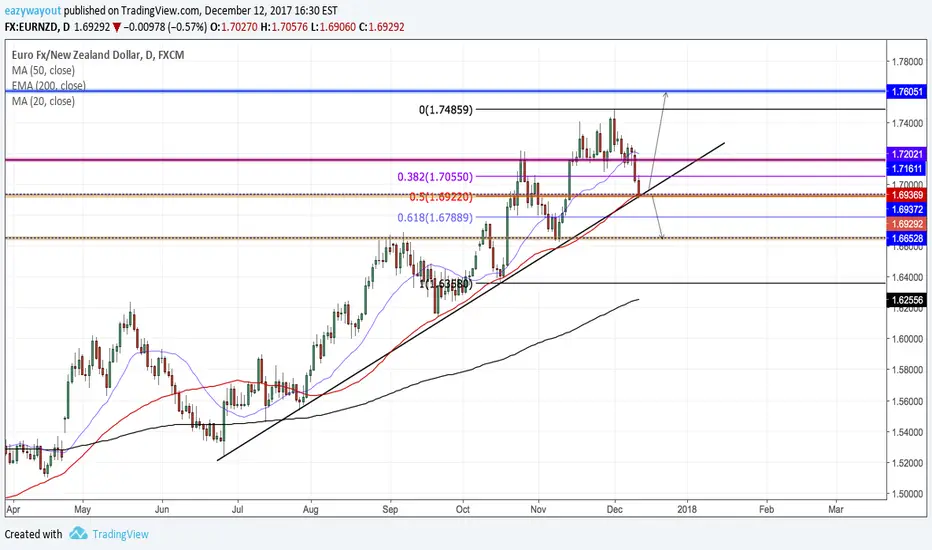
EURNZD DAILYPrice is now at a decision point (Uptrend line) where im watching for a break & retest or a bounce to the upside, as it looks like price is sitting on the 50% fib as well. Will need extra confirmation because the 50 fib is not always 100% accurate..
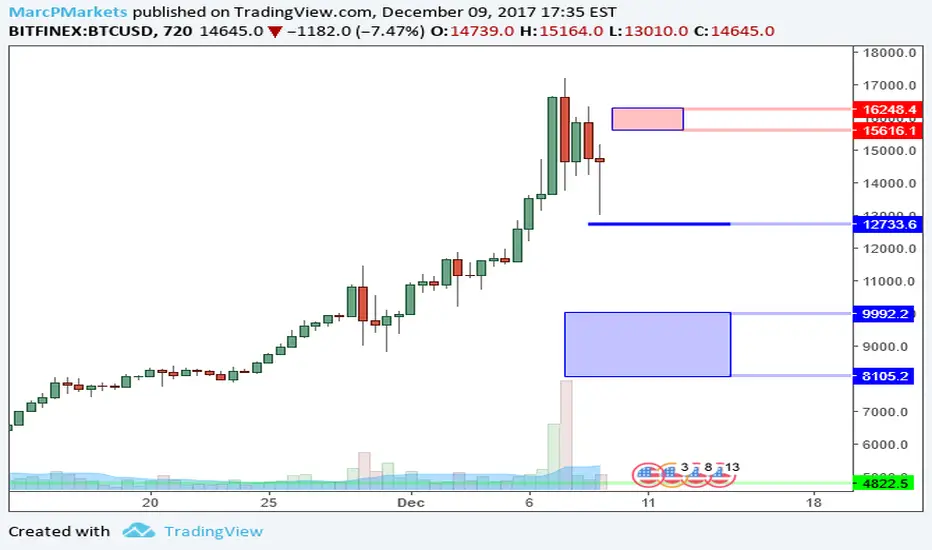
BTCUSD Is The Top In Place?BTCUSD update: A move off the 17171 all time high to 13010 in two days. 5K move in two days is a demonstration of how much risk is involved when buying into this market at such levels. What is even more amazing is this retrace is within proportion of the current price action. In other words, this market is not bearish YET.
The nearest relevant support measured from the 5400 low is 12751 which is the .382 of the recent bullish structure. The 5K pullback just missed that level by about 400 points and is now showing a long wick on the current candle. This kind of price action is perfect for day trading long and short for those who have access to reasonable spreads and can short. The futures market should provide that flexibility for the rest of us. Is this market finally going to sell off like everyone keeps saying?
The answer is: it is too early to tell. The bearish price action that has appeared may seem dramatic, but it is within the proportion to the way this market is moving and has not even broken the first projected level of 13010. That is why I keep saying this market is for day traders because you take your profit based on targets on smaller time frames.
There are two levels to watch for as the market unfolds. The 13010 for a double bottom reversal which can lead to a long signal, and the 15580 to 16273 area (.618 of recent bearish swing) which can lead to a lower high and signal a sell off that can retest the 13k level or lower. There is no question that the market is generally strong, and that means there is a greater chance that the support level holds while the resistance level breaks.
I am not buying into this market at all. I prefer to wait for the futures to open tomorrow and next week and see how price action is affected before I take any position in this market. I am more interested in trading the futures than I am of the actual coin because of the flexibility. I am still a firm believer that the futures will bring balance to this market rather than dramatic new highs.
As far as shorts go, the current leg is the first sign of weakness. Weakness means there are more sellers than buyers within the current price action and is not to be confused with a trend reversal which takes a lot more time to develop. This is why shorting is more effective on shorter time frame strategies like day trading which are characterized by tighter stops AND targets. The less time you are in this market as a short, the better. If you are looking for shorts, wait for a reversal at the projected resistance level, that is where the reward/risk is the most attractive. And again, if you do not have a well defined plan then you should not trade at all.
A more serious correction can take this market back below the 8ks but there is NO structure in place that implies that YET. Remember TA offers clues in regard to what is likely to happen in the immediate future. The more time that is measured takes away from the reliability of the analysis because anything can happen. A piece of news can come out that takes the market by surprise which a chart cannot foresee. Often the market is in a position that news will push in a particular direction faster, so TA may not offer precision, but at least it provides a way to measure the risk and potential.
In summary, it will be interesting to see how the behavior of this market changes along side of the upcoming futures markets. There are many opinions but no one knows for sure, not even the people who are responsible for creating the futures contracts for the exchanges. This first leg of selling is normal and is still within the recent bullish structure. If this market is going to correct further, it is more likely to begin that process from a lower high, a double top or a double top variation which can start from a slightly higher high. Emotions are running rampant in this market, do not let yours control you, even a simple plan is better than nothing at all.
Questions and comments welcome.
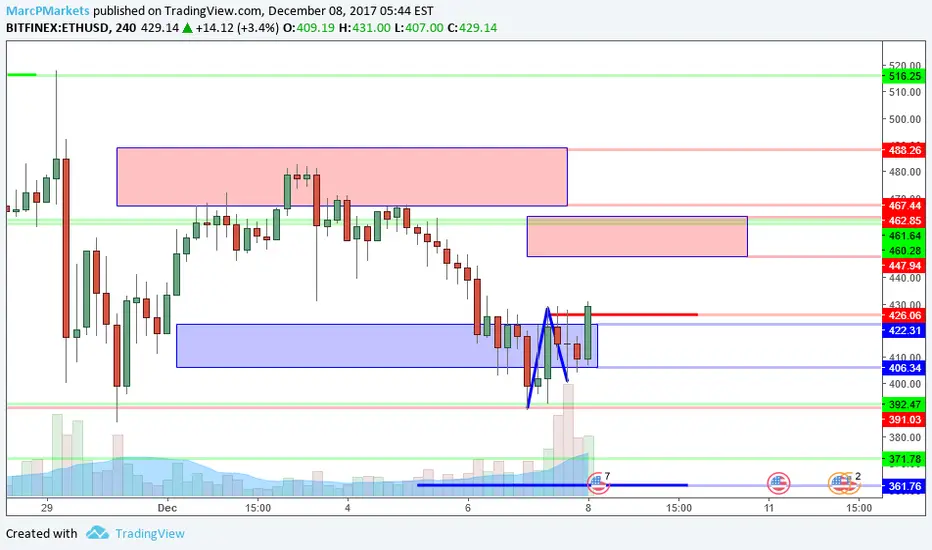
ETHUSD Higher Low And Long Entry.ETHUSD update: I am LONG from 420.27 with a STOP at 396.45 and TARGET at 453. Reward/risk: 1.4/1. The entry criteria has been met for a swing trade long. (Trade was posted as an update in my previous report). I will explain the thought process further.
As I wrote in my previous summary, buying into a pullback within a broader bullish trend is in line with my swing trade plan, BUT there has to be some form of confirmation. That confirmation has appeared,and as a trader, I have done my part: followed my plan, now the rest is up to the market.
As far as levels go, the 422 to 400 area is the .618 support zone of the recent bullish swing. That was the first point of interest, but not enough for an entry. I wrote about the 391 level and how I wanted to see a reversal formation between there and 361. 391 held and the higher low formation has appeared around the 400 level along with a newly established broader double bottom formation off of 391. A higher low on a smaller time frame off of a larger double bottom in a generally strong market is in line with my plan. Even if this trade stops out, I waited for everything to line up in my favor. Having these definitions and letting the market prove itself is better than buying too early and not knowing if this market is going to hold or collapse. At least I have structural evidence that suggests the bearish scenario is now much less likely.
Why 453 target and not 500? (Or some other ridiculous number like 1k?) IF the market offers the opportunity to sell at 453 quickly. I will exit half the my position, and trail my stop manually from there. I try to lock in some profit and reduce risk as soon as soon as my plan calls for it. I chose 453 because it is just below the 455 old support/new resistance level and in the middle of a .618 resistance area of the recent bearish swing. Since this market is generally bullish, there is a better chance that price breaks above that zone and retests the 500 high, so I intend to hold some for that possibility.
I don't know if my trade will work out, all I know is that the factors for the outcome that I am looking for are now in line. That is the purpose of a trading plan. I don't have to think, or worry, everything is defined ahead of time, from the entry, to the management to the exit. The hardest part is WAITING, as many people do not have the patience, especially when markets like BTC go to 17k in a matter of a couple of days.
I suspected this market retraced because of the BTC spectacle but that is just a hunch. If this market has retraced because of congestion over some cat game on the blockchain then that is not really a good sign in my opinion. How is it going to handle serious applications where there is a lot more at stake? As a short term trader, I really don't care why, because I am not trading on that information. I used to trade stocks of companies that produced nothing. It is price momentum that I am interested in and that's it.
In summary, I am simply following my plan and that is the best I can do. Now I just have to manage the trade as the market unfolds. Things change fast and that is why a well defined plan is so important because it enforces rules and minimizes emotions. Many new traders are soon going to learn the realities of trading. BTC is lala land, no skill is required to buy and hold. When that market returns to reality that is where the skilled traders will step in and capitalize on all the bad habits and euphoria that is running rampant in that market. A 5K move in 5 days without a retrace is a breeding ground for unrealistic expectations. Learn to structure your decision making process, and no matter what conditions you face, you will at least align yourself with the probabilities while at the same time knowing how to constantly adjust for risk. As much as people criticize TA, it at least provides the tools to build a framework for consistency.
Comments and questions welcome.
BTCUSD Perspective And Levels: Signs Of Strength For Now.BTCUSD update: Price is pulling back in a very shallow consolidation which is now presenting a bull flag formation. This price action is not characteristic of a weak market or a bearish C Wave. If anything price is poised to retest 8k and possibly higher.
Weak markets do not consolidate near highs, and do not unfold in bullish formations on larger time frames. This market is not weak, yet. I have been writing about the tricky B Wave, which typically unfolds in 3 legs. The current structure appears to be in a minor Wave 4 and setting up for a new high attempt. That is not characteristic of a B Wave which means the market has negated that scenario.
It hasn't even compromised the 7350 minor trend support (.382 of recent bullish swing) and is no where near the 7k support that I was using as a reference to confirm a C Wave was in play. Weak markets reject levels and sell fast, and often originate from a failed high or double top and this market is not showing any of those structures at the moment. The fact that the 7350 and 7k supports are still intact is another bullish sign. Until those levels break, this market is a high risk, low probability short. (In other words a pure gamble).
Based on this time frame, a break of 7800 will also signal buying and possibly the start of the next leg that can go as high as the mid 8ks. Projecting an extension from the 6300 low shows a 1.618 at 8381 which is just under the 8468 level which is the upper boundary of the fakeout zone that I wrote about in my previous report. (It is a projection measured from the 5400 low).
This type of price action is ideal for day trading in my opinion because you don't have to take the large time frame risk, while capitalizing on generous moves. The reason why a swing trade is less attractive is because it is not worth the risk at these levels. I have to risk around 400+ points to possibly make 300 or slightly more? Day trading stops are more like 50 to 100 points while you can capture 150+. Makes much more sense.
In summary, this market still continues to show signs of strength. A shallow retrace, bull flag, untested minor supports, all point to a better chance of higher prices. How much higher? Based on proportions mid 8500s is reasonable at this point. There are many different forces at play in a market like this and little to no regulation. There are pros and cons to every situation. The strength may not make sense in terms of logic, or this market may be propped up by the BTC community through their technical advantages, or maybe it is full of fake Tether as some have suggested. The reasons don't matter if you are a short term speculator. Price action is showing signs of strength, so embrace it or avoid it, no one is forcing you to participate. For my swing trade plan, the risk is unjustified so I will stay flat. If this market is going to sell off hard, it needs a surprise (like an exchange going out of business) because at the moment, there is very little price action to support a bearish argument.
Comments and questions welcome.
