ETHUSD Perspective And Levels: Higher Low Is Bullish But Slow.ETHUSD Update: Higher low unfolds in the low 290s which establishes a subdegree Wave 2 bottom. All this market needs is a catalyst because in terms of price structure, this it is poised to push the 315 resistance.
So much for the head and shoulders everyone was afraid of. If that bearish reversal pattern was in play, we would be breaking supports, not forming higher lows. Many may not realize it, but it seems they try to outsmart the market, and you can't. Instead, let the market prove itself. As price action traders we are detectives, not warriors.
Higher lows as we know often lead to higher highs, especially in a strong market. Since this market is slow and lacks any significant catalyst, the subdegree wave 2 that we are currently in may linger and develop into a small triangle. This condition can lead price back into the low 290s and even into the 280s again. The key to this activity, (as I have written about in other reports) is watching the support levels. 279 and 263 still hold. As long as price stays above these proportionally bullish levels, expecting a breakout in the short term is reasonable.
In terms of wave count, subdegree Wave 3 is never the shortest wave, which means if this market enters subdegree Wave 3, in terms of proportion, price reaching the 350s makes sense. This market just needs a catalyst. Maybe, as some have suggested, BTC needs to cool off and those participants will pour into this market. A quick look at the ETH/BTC chart shows price consolidating within a significant support area, which adds to ETH bullish argument even further. A 320 resistance break will confirm subdegree Wave 3 is in progress.
In summary, the small higher low formation in the low 290s is a welcome bullish sign, but until a catalyst enters this market, a subdegree Wave 2 triangle is possible before subdegree Wave 3 unfolds. 279 and 263 support levels need to hold in order to maintain this bullish outlook. A breakout above 320 opens the door to my 350 target area, and at this point it is just a matter of time. Keep in mind I am NOT making predictions, anything can happen in this market. I am evaluating price structures, and making comparisons to get an idea of what is more likely to happen. Less experienced participants think they are jut looking at lines and candle sticks. What they are missing is that the patterns
formed by these candle sticks provide information about the underling motivations of the buyers and sellers whose orderflow made those candles appear.
Comments and questions welcome.
Higherlow

ETHUSD Perspective And Levels: Resistance May Lead To Retrace.ETHUSD Update: The 215 minor support held as price slowly climbs back into the 227 to 240 resistance zone . The 215 support is a higher low structure which is usually a sign of further strength, but the problem at the moment is lack of follow through which can be attributed to low volume . If this market fails to take out the 240 resistance, a retrace back into low 200s is possible.
The lack of excitement or volume may be stemming from the BCH price action as one trader pointed out in my previous report. The price action in BCH is the kind of chaos that I expected in the BTC and ETH markets on Tuesday. It has a 300+ dollar range (in 1 day) and is still on the move, while the regulars move with muted enthusiasm.
The area to keep an eye on at the moment is the 227 to 240 resistance zone . It is related to the .382 of the recent bear swing that came off the 412 high. The fact that a higher low has formed beneath it is a bullish sign and a push above 241 is more likely which should take price into the next resistance in the 250 to 280 zone. IF price manages to push beyond that, then the 306 resistance area (.618 of broad bear swing) is the next obstacle.
In order to get price moving toward these levels, there needs to be a catalyst to kick start the volume back into this market. Something along the lines of "The SEC approves ETH ETF" would get things moving at the speed that we have been accustomed to in this market.
Keep in mind IF we do not break the 241 resistance, and price fails here, that would signal short term weakness and likely be followed by a retracement into the low 200s along with consolidating price action. The 215 and 210 supports are likely to break in this scenario because the 241 resistance is of greater magnitude and I would look to the low 200s to low 190s for reversal patterns back up.
In summary, slow markets can be caused by many factors like the ones I have highlighted in my reports. Opportunity still exists on the short term, it just requires more patience. If a bullish catalyst appears out of nowhere, this market should push higher beyond the 241 resistance and into the 250 to 280 area before it finds another level to hesitate. These levels serve as good targets if you are looking to maximize short term profits. If price retreats from the current level, it is nothing to panic about in my opinion, as long as it holds the 190s or high 180s.
Comments and questions welcome. Anyone interested in seeing a BCH evaluation?

ETHUSD Perspective And Levels: Higher Low, Where's The Volume?ETHUSD Update: Small retrace off of yesterday's high, with a development of a minor support zone within the 210 to 215 area. Volume is still very low which may have something to do with the seasonality of financial markets in general. Volume needs to pick up in order for this trend to continue.
After trading multiple asset classes for years, I learned one thing: summer time trading in the U.S. is always slow whether you are in stocks, futures, even forex at times. These new markets may be feeling that effect as well even though the BTC drama is over. The reason for this seasonal pattern is simple: the entire world goes on vacation in August. Just look at the hotel prices in any of the Caribbean islands. It is peak season. And it's not just Americans driving that demand.
I would think by now volume would be back to normal and it's way below (33k? that's low). Keep in mind price can move in a low volume environment, but usually the moves are more random and lack follow through.
With that being said, I am still interested in buying. I am watching the 210 inverted support which now has a minor zone going up to 215. This zone is related to the .382 of the most recent upswing that was put in place yesterday. I want to see a price pattern reversal on a smaller time frame such as an hourly or 30 minute to get me into a long. Since volume is low, I will compensate for the additional randomness by only putting on 50% of my normal unit size. If I manage to get long my stop will be around 195 and my first target at 249.
If price falls through this minor support, the 200 to 185 support zone is my next area to watch for reversals and depending on the price action there, I can determine my risk at that time if a reversal pattern appears according to my trading plan.
In summary, based on structures put in place so far, this market is still strong and healthy, it just needs more volume. I am watching for price to retrace into two particular areas, the 215 to 210 and/or the 200 to 185 for possible long positions. If there are any surprises and price falls below 160, then my bullish evaluation is negated. Otherwise, be patient, strong markets offer plenty of opportunity.
Questions and comments welcome.

ETHUSD Perspective And Levels: Structure Still Signals Strength.ETHUSD Update: With the big event seemingly out of the way, it appears the outcome was a non event in terms of price action chaos. The higher low that I wrote about in my previous report held and has lead price to a higher high at the 232 area which now puts it within striking range of the 241 resistance (.382 of recent bearish swing). With the compound bullish structure in place, this market is strong and it is reasonable to expect the 241 resistance to be compromised.
The only thing that surprised me about these markets was the lack of chaos. I thought a price spike was more than likely, but maybe brokers like Coinbase helped to mute that kind of price action with their market controls (preventing their customers from trading). None of the bullish technicals were compromised, and price action has only further confirmed strength with the current higher high in place at the 230 resistance.
If you missed out because of all the uncertainty surrounding the BTC drama, it's okay because there will be plenty of opportunity to buy back into this market. If the market is going to trend back up into the 300s, there will be plenty of retracements along the way that will offer attractive reward to risk in my opinion.
The support levels that I am watching closely for a reversal signal are the 210 area support (inverted resistance) and the 190 to 180 support zone. IF price can retrace back to either one of these areas, and I get a validated reversal, I will most likely use 195 as my stop if my entry appears at the 210 area. And a low 170s stop if my entry appears in the 190 to 180 zone.
IF the 241 resistance gets taken out, I expect price to find it's next hesitation in the 250 to 280 resistance zone (.618 of recent bear swing). This is a good reference area for short term targets and to measure reward/risk. For example if I get long at 210, and my stop is 195 and my first target is 250, my RR is something like 2.5:1. That is more than acceptable.
As bullish as the price action appears, there is always a scenario that can void the whole evaluation. In this case, if price falls below 163 for whatever reason, that will prompt we to reevaluate my bullish outlook and hold off on any long positions at that point.
In summary, the hard fork was a non event. Price structure has only signaled further strength and as volume returns to these markets, I believe it is reasonable to expect the current resistance levels to be take out. This doesn't mean go nuts and buy highs, there will be buying opportunities, it is a matter of patience. I am now waiting for a revisit to the 210 level for a possible long entry upon a reversal signal.
Comments and questions welcome.

ETHUSD Perspective And Levels: More Strength, No Volume.ETHUSD Update: Less than a day to go for the big BTC event and this market is continuing to build price structures that imply strength. After the initial push up to 213 and attempted break of the 208 resistance, price has retraced to the 190 to 184 minor support which is an ideal location to form a higher low.
This market is presenting a broader higher low which I wrote about previously, (see linked report) and is now in the process of building a minor higher low structure. Higher lows appear when real selling is absent in a market, and typically lead to higher highs. The broader HL followed by this minor HL implies further strength.
What make these higher lows even more interesting is where the buyers are expressing the most interest and that is in the support zones that are related to the .618 of each respective swing. If the BTC drama was not happening tomorrow, I would be buying into these structures.
Reason I am not buying: There is extreme lack of volume which removes some credibility from these formations. BTC has also been showing technical signs of strength (see linked report) but all the analysis in the world will not be able to foresee any fundamental surprises that can cause wild swings in both directions. Plus there is no confirmation at the moment that meets the conditions of my trading plan.
Another push beyond the 208 resistance, and this market is likely to reach the 230 to 240 resistance zone. A break of that compromises the recent bearish swing and sets the stage for the 300s.
Keep in mind the kind of swing that can occur upon tomorrows news can be extreme and it is very possible that wide stops can be taken out. That's why if I did take a position now, I would not place a stop until after the wild ride is over. In order to do this, you must be willing to lose your entire investment.
And if the market goes straight up, and you feel like you missed the bottom, do not worry, strong and healthy markets offer plenty of opportunity to profit, you do not need to buy the bottom. As long as the uptrend stays intact there will be more swings to buy.
On the low side, if this market does NOT go below 136 and finds support at a higher price after tomorrows news, I would see that as a sign of strength as well. A break of the 136 low is a negative sign, and that would prompt me to reevaluate my bullish outlook.
In summary, this market, just like BTC is presenting price structures that indicate strength. Higher lows typically lead to higher highs. The key is to see how this market reacts and settles after tomorrow's big event. If the support levels are tested and hold up, that will provide further evidence that buyers are in control and it is then just a matter of defining risk. I won't be able to do that effectively until after the big event.
Comments and questions welcome.
CAD/CHF Long Weekly Quintuple BottomWeekly Range forming Quad/Quintuple Bottom. New Higher Low formed at bottom of range with Bullish engulfing proving momentum.

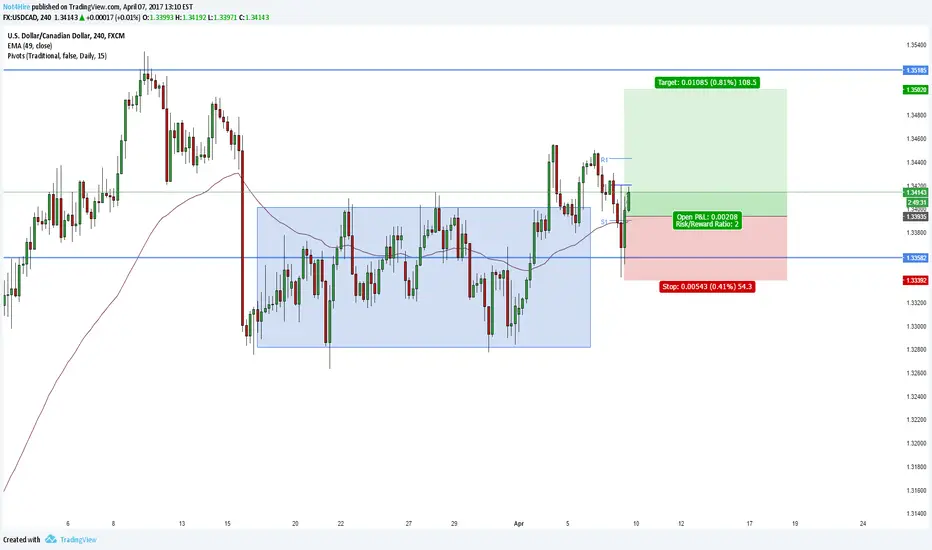
USD/CAD Long Breakout APL moveWe have a 4hour breakout from blue box consolidation forming HH and HL, with APL false break present.
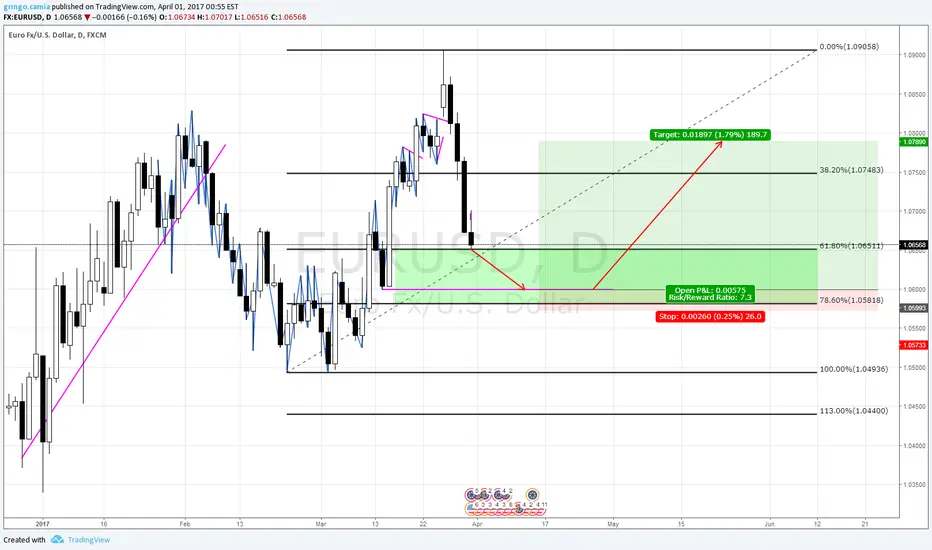
EURUSD to Bounce at 1.0600 then continue the uptrendWatch 1.06511 (61.8) once broken enter a Long Position above, or wait for price to get near 1.0600 before placing a Long Position. Stop is at 1.05993
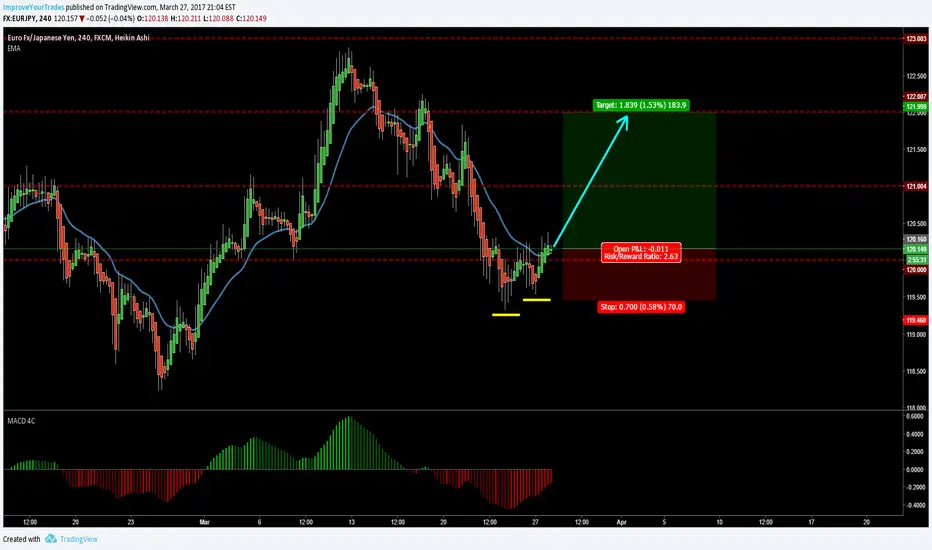
JPY losing steam, EUR getting strongerHey traders, here is the setup I am watching this week. After watching the JPY surge, and now seeing the EUR start to gain some momentum, I decided to put these two currencies together to see what happens this week. As you can see, we have some divergence in the MACD, as well as a higher-high and higher-low, which is great confirmation that price may go higher, combined with the strong versus weak analysis. I'll be placing my stop at 119.5, and my take profit at 122.0, a nice key level that price has hit recently without any trouble. This trade gives me a nice 2.6 to 1 reward to risk ratio. As always, plan your trades and trade your plan!
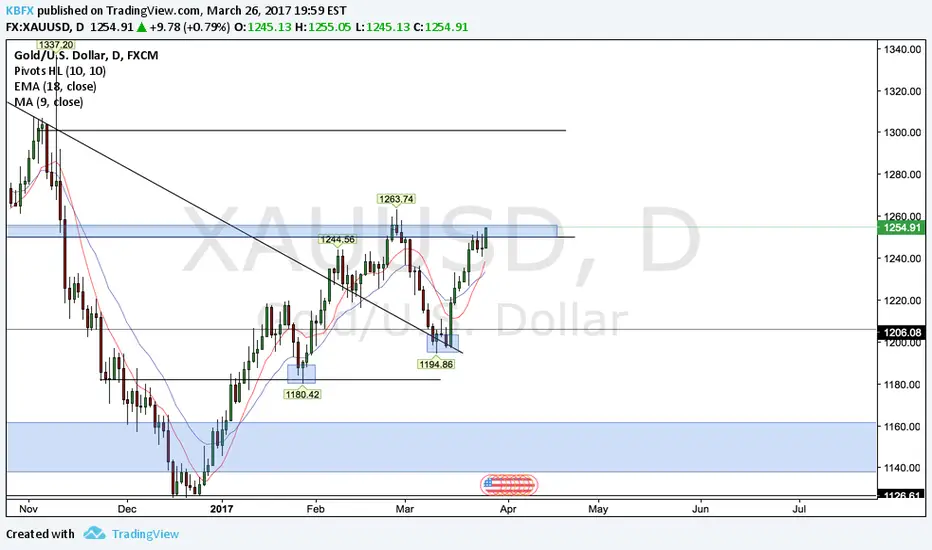
GOLD 1D OutlookGOLD currently trading at a Key resistance and has previously made higher highs from failing to eliminate previous lows to continue down to 1200s, as the dollar makes lower highs looking for XAUUSD to proceed to a target of 1260, 1300s before coming back to retest its low.
Look below for DXY outlook.
Gold fails second re-test of new high and opens downsideGold has double topped at the last lower high and while I am skeptical of a sell right now given the USD index is falling there should be caution when taking a long position.
We need a higher close above the lower high to safely buy into Gold which may come later in today's session, otherwise if the USD index re-bounds (see linked trade analysis) we could short gold to the previous higher low at 1312.00.
Facebook Inc FB Head & Shoulders Cypher HH and HLFacebook for weeks now has been creating higher highs and higher lows in the strong uptrend. Being bullish on this stock we would look to get in with the bulls.
Lets look at the daily time frame.
Here we see a beautiful head and shoulders formation. Once it hits the neckline Price would reach around $98.
Adding confluence there is also a bullish cypher formation which may possible form. Buying at the price range $92 - $97 would be a wonderful spot to get in on the trend.


Bet on the support reboundThis trade aims at the short-term rebound from the historical low. Since June 07, short-sellers initiated a selling force to test JD's the 52-week low. The price was driven down,but no volume followed. However, when the price was reaching the 52-week low, there are people collecting the dimes, on June 16. Maybe the short-sellers were covering here. I think it is a good bet on a short-term rebound.
Here is my plan:
1. Stop Loss at 19.
2. Profit taking at 23 or Time Exit in 5 days.

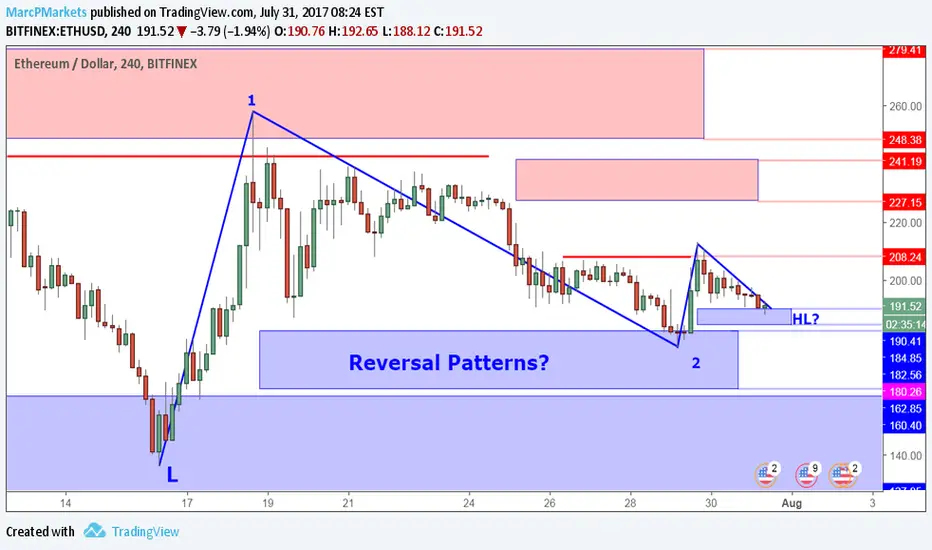
Higher low suggests move up from hereLooks like that higher low is confirmed, we should move up from here. I doubt we will make a higher high at this time so be careful when we start getting close to 3k again.

15M TF Swing Failure Trading ExampleIn this idea I show you how I trade swing failure patterns.
This is good for any time frames but lower time frames are preferred.
Very simple idea yet works pretty nicely.
Let me know what you think.
Long white and higher lowIf price doesn't skyrocket to the first relevant structure to the upside, I'm buying according with the notes on the chart.

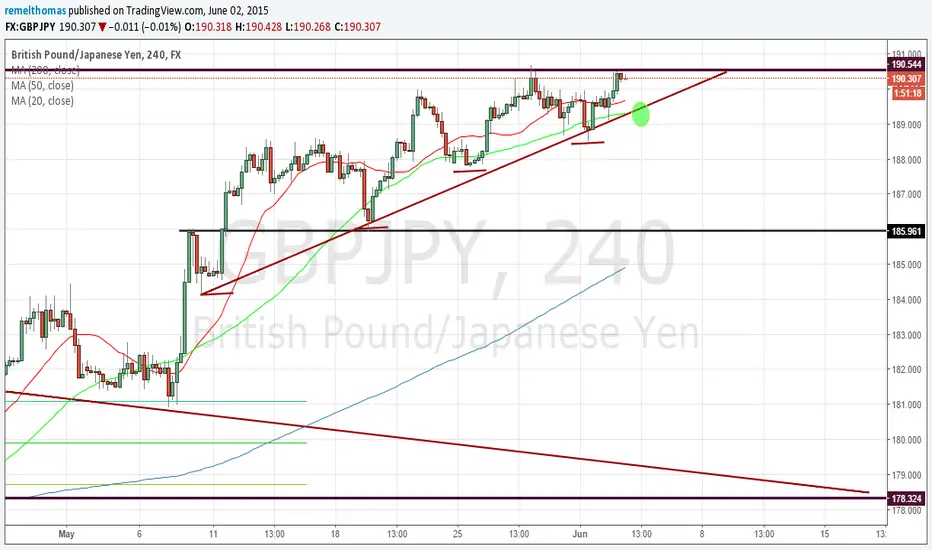
GBPJPY 4 HOUR LONGPRICE MAKING HIGHER HIGHS AND HIGHER LOWS INDICATING THIS UPTREND IS WELL INTACT. TRENDLINE IS ACTING AS A GOOD SUPPORT SO IF WE GET A PULLBACK INTO THE TRENDLINE/189.000 THEN THAT WILL BE A GOOD LEVEL TO GO LONG. IF PRICE BREAKS RESISTANCE THEN THAT WILL ALSO BE A GOOD CHANCE TO GET LONG/ADD POSITION
Possible short term double topA small trade possibility. Market pretended to breakout here on very weak volume at strong resistance. and will probably retest the last higher low and may go lower.

NZDUSD - Higher Highs - Higher Lows This pair has been on the move up for a couple of days now, making steady progress with higher highs and higher lows.
Projecting this into the future could lead us to the scenario above.

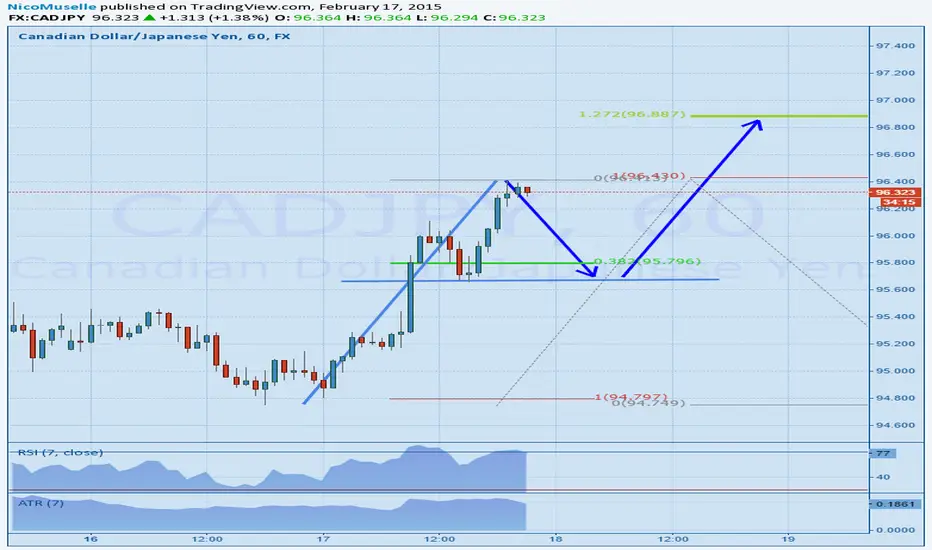
CADJPY - a little retracement before moving further up ?CADJPY has reversed the trend and made a considerable move up all through the day. RSI is overbought now and it is probably exhausted and gasping for breath. We might see a +- 0.382 retracement into previous structure before rallying into the minor support level on the daily chart.
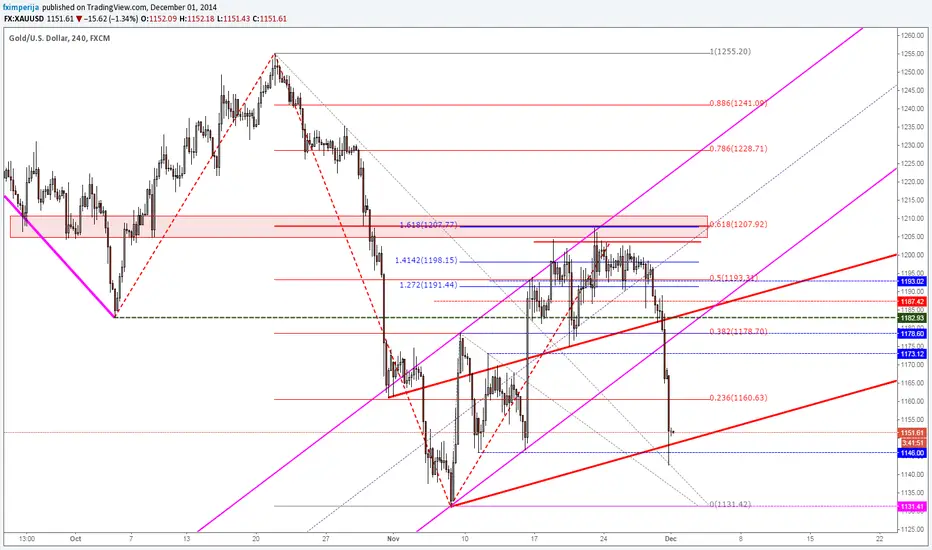
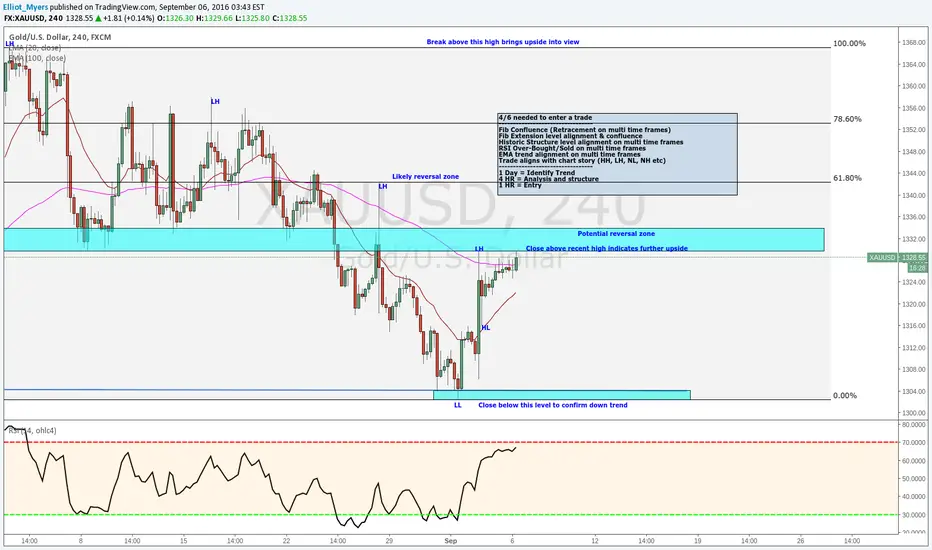
#Gold hard rejection at "Golden Cross"The "Golden Cross" right in the PRZ (resistance zone) pushed Gold lower. The overlap of 61.8 and 161.8 acted as a wall on Gold attempt to cont. bullish move. The recent PA is in line with the overall bearish trend. However, the breach of 1146 hasn't happened yet.
Since Gold made a new high, this Higher Low could show that 1131 was the bottom.