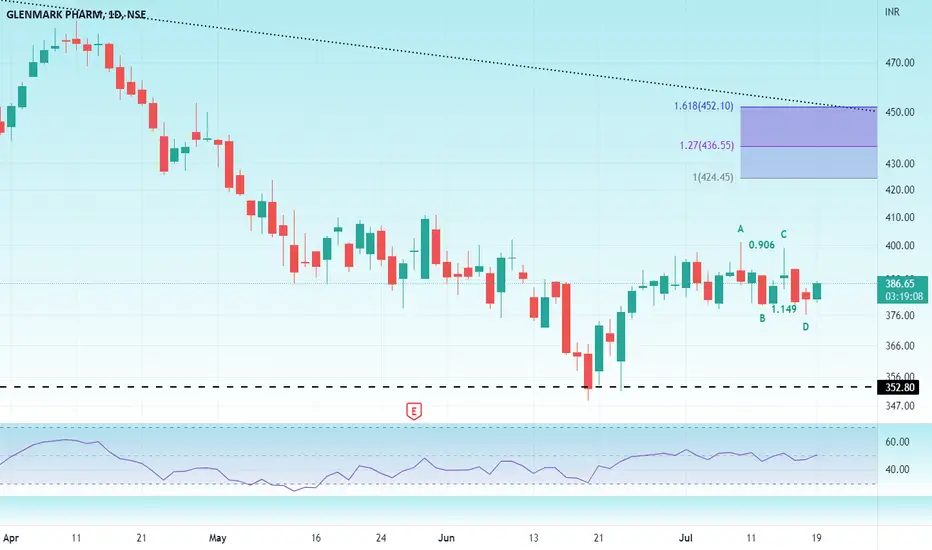
GlenmarkHello and welcome to this analysis
Glenmark after consolidating near its monthly support attempted a fresh upmove from 350 to 400, Post that it has made a sideways corrective forming a Bullish Harmonic ABCD.
The current reversal from 375 could be a higher low of the new uptrend in it and it could rally till 410-425-450 as long as it does not breach 374. Confirmation if it sustains above 390.
Good risk reward set up scenario of a higher low formation which could lead to a higher high thereon till its falling trendline
Higherlow
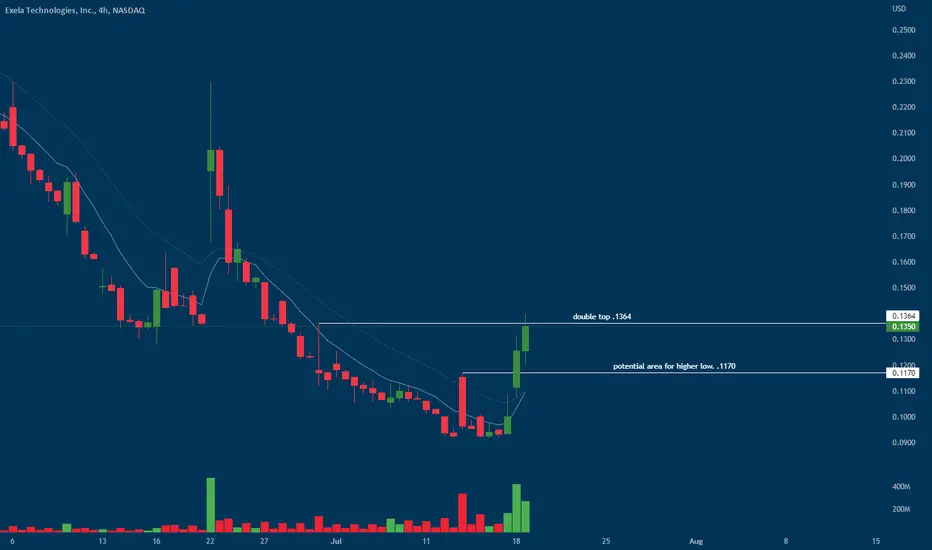
xela double top breaklooking for a higher low near previous pivot (0.1170) and an intraday pattern for entry for
(0.1364) pivot break.
META: Higher low is a good signal!Meta
Short Term - We look to Buy at 164.56 (stop at 150.26)
Although the bears are in control, the stalling negative momentum indicates a turnaround is possible. There is scope for mild selling at the open but losses should be limited. Prices expected to stall near trend line support. Further upside is expected although we prefer to set longs at our bespoke support levels at 160.00, resulting in improved risk/reward.
Our profit targets will be 200.00 and 210.00
Resistance: 200.00 / 220.00 / 250.00
Support: 160.00 / 140.00 / 120.00
Please be advised that the information presented on TradingView is provided to Vantage (‘Vantage Global Limited’, ‘we’) by a third-party provider (‘Signal Centre’). Please be reminded that you are solely responsible for the trading decisions on your account. There is a very high degree of risk involved in trading. Any information and/or content is intended entirely for research, educational and informational purposes only and does not constitute investment or consultation advice or investment strategy. The information is not tailored to the investment needs of any specific person and therefore does not involve a consideration of any of the investment objectives, financial situation or needs of any viewer that may receive it. Kindly also note that past performance is not a reliable indicator of future results. Actual results may differ materially from those anticipated in forward-looking or past performance statements. We assume no liability as to the accuracy or completeness of any of the information and/or content provided herein and the Company cannot be held responsible for any omission, mistake nor for any loss or damage including without limitation to any loss of profit which may arise from reliance on any information supplied by Signal Centre.

GOOG: Have we reached the bottom?Alphabet
Intraday - We look to Buy at 2214 (stop at 2105)
Buying pressure from 2150 resulted in prices rejecting the dip. This is positive for sentiment and the uptrend has potential to return. There is scope for mild selling at the open but losses should be limited. Prices expected to stall near trend line support. Dip buying offers good risk/reward.
Our profit targets will be 2549 and 2600
Resistance: 2555 / 2860 / 3032
Support: 2140 / 1900 / 1600
Please be advised that the information presented on TradingView is provided to Vantage (‘Vantage Global Limited’, ‘we’) by a third-party provider (‘Signal Centre’). Please be reminded that you are solely responsible for the trading decisions on your account. There is a very high degree of risk involved in trading. Any information and/or content is intended entirely for research, educational and informational purposes only and does not constitute investment or consultation advice or investment strategy. The information is not tailored to the investment needs of any specific person and therefore does not involve a consideration of any of the investment objectives, financial situation or needs of any viewer that may receive it. Kindly also note that past performance is not a reliable indicator of future results. Actual results may differ materially from those anticipated in forward-looking or past performance statements. We assume no liability as to the accuracy or completeness of any of the information and/or content provided herein and the Company cannot be held responsible for any omission, mistake nor for any loss or damage including without limitation to any loss of profit which may arise from reliance on any information supplied by Signal Centre.

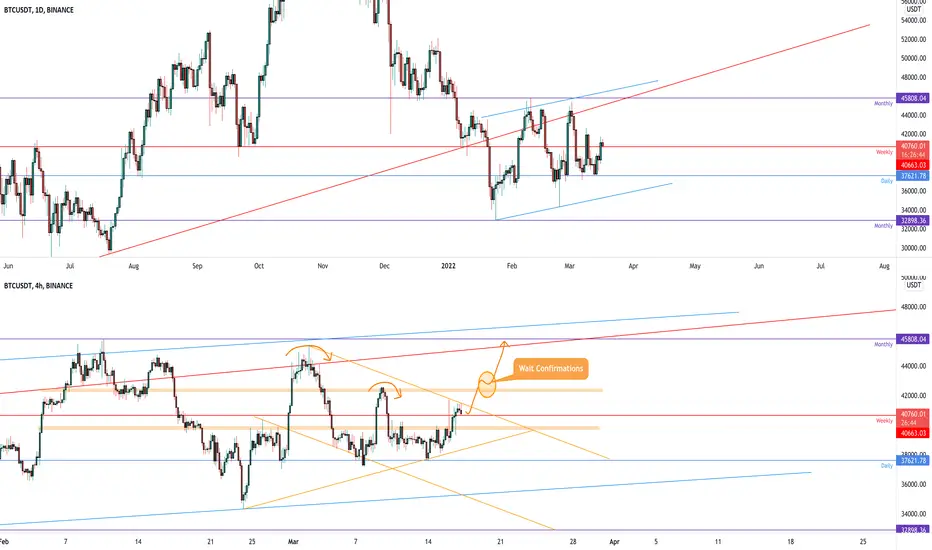
BTCUSDT needs to create the new Higher high!
the price bounced on the 33k area on the monthly support and got the liquidity until the 0.382 Fibonacci level as new resistance.
On the weekly timeframe, the price is testing the dynamic support.
On the daily timeframe, the price had a breakout from the dynamic support and now the price is testing the previous support as new resistance.
On the 4h timeframe the price had a breakout from the falling wedge and now it's trying to create a new higher high.
How we can approach it?
For a bullish scenario, the price needs to create a new higher high from that area above the 0.5 Fibonacci level (41k) with volume and momentum.
IF the price is going to lose the 4h support we could see a new bearish impulse until the next demand zone


ALPINE-Less sell pressure & higher lowsHello everyone
On Alpine daily chart ,we don't have much of perspective or structure,but we have a well preserved daily trend line, so if we consider the last 4 bars on daily chart a last bear flag (see in 4 hours), and that combined withe the higher lows that we see in daily,from here of in the next 2 candle we may see reversal happening.
For now,it's better to be traded in lower time frames.
our support levels are a trend line & price level of 5.25$, possible resistance level 6.2$

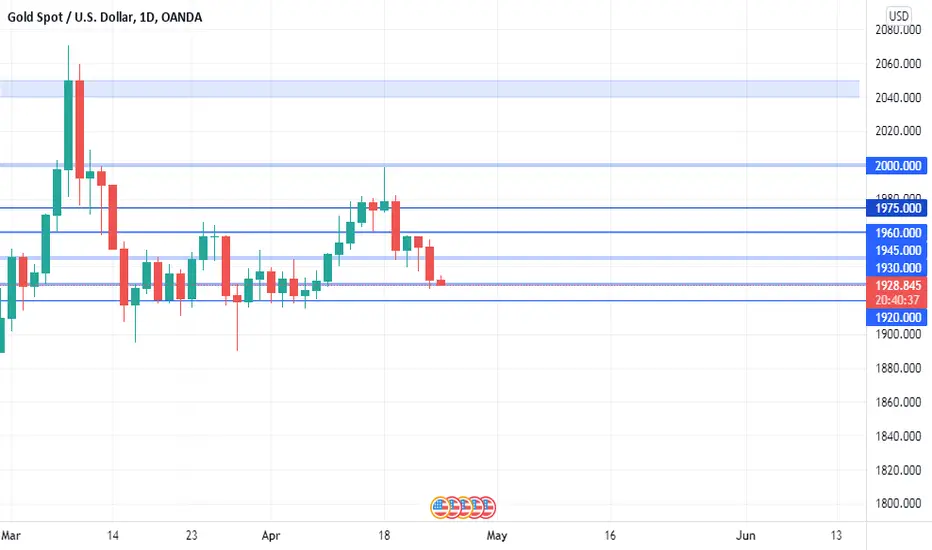
GOLD- bull flag on weekly Hello everyone
As I explained last time, there was possibility of lower prices here,and well we had a small bear flag on 4 hours .As for this week, we might have a small swing to the lower channel and a touch on 1920$ as the context implies we may face a steep bear market in the future, but for the structure on weekly, we have big bull flag and on daily If current support level hold the price we will have higher high's, and can see better future for XAUUSD.
Current support level 1930$, key support level 1920$, and our resistance level is 1960$.
Jublfood near breakout Jubilant Food which runs Dominos in India is trading near breakout zone.
Breaking above 2890 will make it a successful breakout.
Potential target is 3150.

Is The Higher Low Forming?This is an update to my previous in depth video analysis of the Nasdaq. It looks like there is a possible higher low forming which could indicate the the underlying uptrend is resuming. I do however believe that there is still a strong possibility for a larger leg to the downside. Watch the video to see what I am looking at.

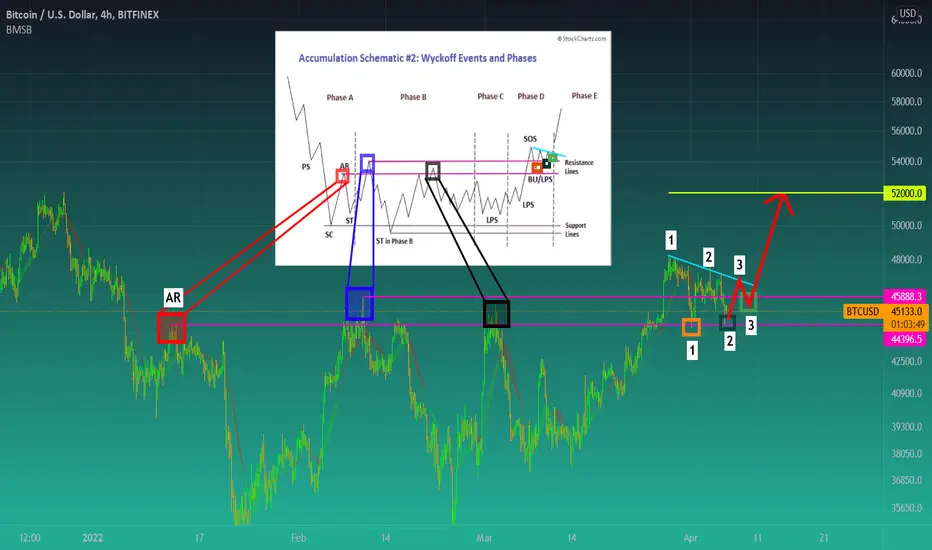
WYCKOFF PATTERN | UPDATEIt's easy to get scared right now.
But just know that if we don't put in a local lower low (below 44200), there is nothing to be scared of.
This Wyckoff pattern is still valid, and so it looks like we will visit the 52k resistance anywhere this week or next week.
Just saying...
haha
Regards!
BTCUSDT needs to create a new Higher HighBitcoin close above the 40k on the weekly perspective, it's a good sign.
On the 4h time frame, the price failed to create a new Higher High of 43k.
We could see a bullish scenario if the price is going to create a new higher high with volume and confirmations as I told you in the previous analysis. on 43k we can see the supply zone.
Otherwise, if the price is going to lose the 40k support and retest it as new resistance, the next support is the 37k.
––––
Keep in mind.
🟣 Purple structure -> Monthly structure.
🔴 Red structure -> Weekly structure.
🔵 Blue structure -> Daily structure.
🟡 Yellow structure -> 4h structure.

BTCUSDT needs the new Higher High!the price had a nice reaction yesterday due to the FOMC and now the market is testing the weekly resistance as new support 40660 it's an important level for Bitcoin.
On the Daily timeframe, the price is trying to create a new Higher High above the 4h resistance (42k)
On the lower timeframe (4h) the price is trying to have a new breakout from the pennant.
How to approach?
The price needs to create a new Higher High on 4h Timeframe above 42K with confirmation and Volume. Otherwise If the price is going to lose the 39k, The previous scenario (the short one) comes back and the next valid support is 34-32k
––––
Keep in mind.
🟣 Purple structure -> Monthly structure.
🔴 Red structure -> Weekly structure.
🔵 Blue structure -> Daily structure.
🟡 Yellow structure -> 4h structure.
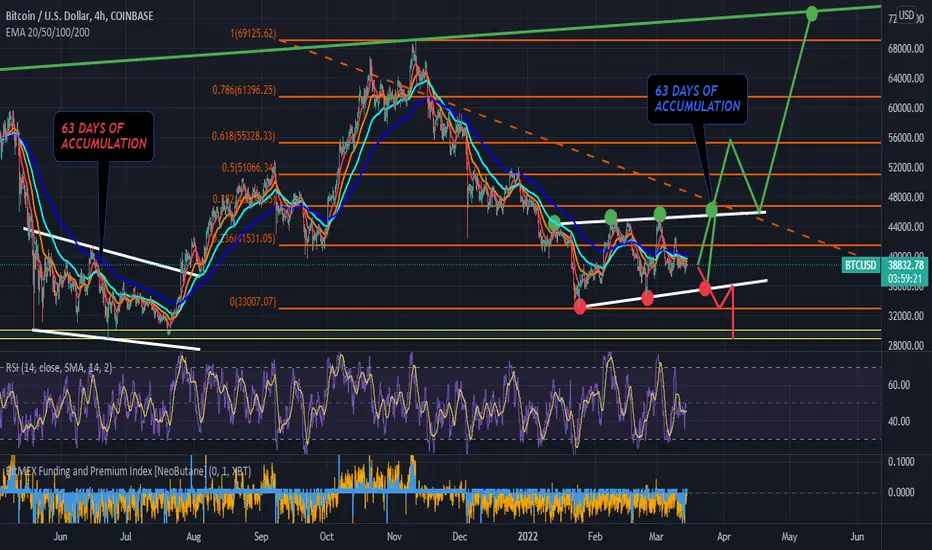
Before the increases come, everyone will sit in silence. 🕗52day🚀🚀🚀🚀🚀
Hello everyone,
Are you already loaded? Bullrun right there!
During the accumulation a flag was drawn, possible continuation of the downward trend after the retest from below (red line).
The consequence will be a drop to the next shopping zone of $ 29,500, where there is strong support and many BUY orders.
A dozen or so days ago, everyone was counting on this decline, now, after 52 days of accumulation, the mood has changed.
If the price breaks up and breaks 0.382 Fibonacci, we should easily reach 50k, then I will be convinced of further increases.
Increasingly higher lows and lows will be a great confirmation of a change in the trend.
Then I will also create a futures order, which I will inform about in this post.
Bitcoin moves in the zone between 45k-33k. A year ago, during the last similar moves, 42k-29k. So does Bitcoin today have 3k-4k bottoms higher than recently?
This would prove the creation of a higherlow, in a very long term it would be a great proof of the creation of a SUPERCYCLE.
- SayMoney, so buy or sell?
- At times like today? Let everyone answer for himself.
Comment and like,
Greetings
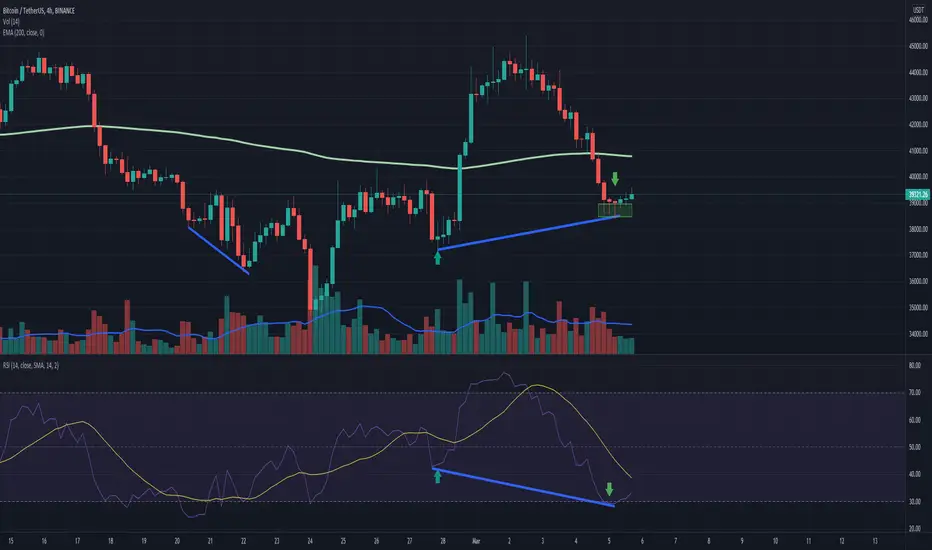
BULLISH WAVE PATTERN CONFIRMEDAs you can see on the chart we got a lower low and after that we get to see a higher low.
On the RSI we get a higher low on the lowe low and lower low on the higher low, this usually indicates a bullish pattern.
RSI is overbought on the 4 hour chart.
Strong demand levels confirmed.
I don't know what else to say more than I think this is a great buying opportunity, of course I could be wrong.
Not financial advice.
I hope this was useful to someone and good luck!
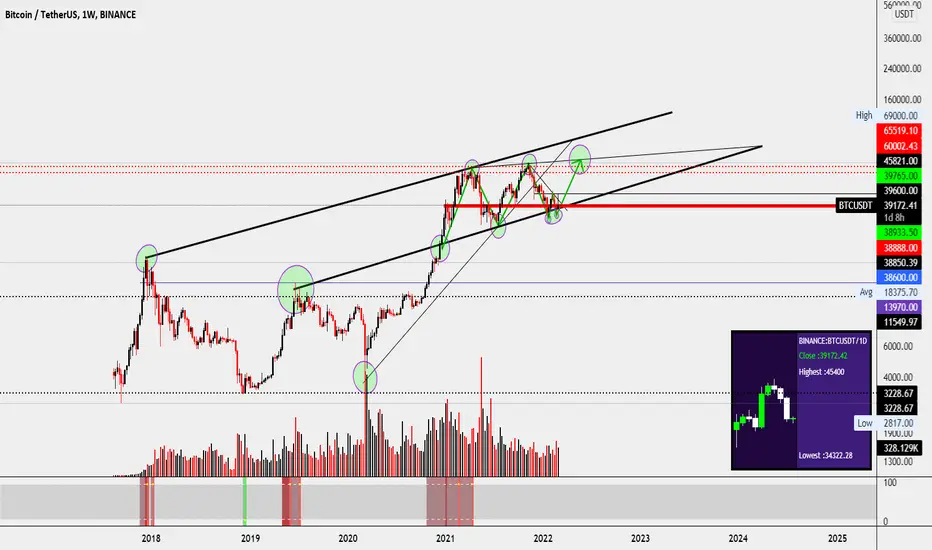
BTCUSDT - LAST LEG UP TO ALL TIME HIGHS - 80K+ [2022]Long term up trend was broken @ 24,295
Grabbed support @ 29.2k then bounced to ATH's
Sort of looks like a double bottom currently on this new trend line that was once resistance and broken @ 19.7k.
Double bottom (Eve & Adam which is a higher low DB) isn't yet confirmed, will need to close green above 45.8k on the weekly.
If confirmed the completed db pattern will test it left leg @ 67.5k, from there ATH's will be tested, not 100% positive we will reach above 69k but 67k - 70k will be tested for sure if DB is confirmed.
KEY notes:
$38,8xx - btc has broke and bounced off this price area before reaching 69k ATH ! on july 26, 2021
currently we are hovering just below that price range and on this weeks candle close, if we close above this price specifically $38,888, history will repeat it self.
currently in a strong up channel making HIGHER LOWS! respecting the up channel trend lines. Price action also is getting smaller and smaller and seems to be reacting to a rising wedge closing in right above 70k area. Currently at a low, which will probably test the next high before crashing to LOWER LOWS! which indeed will bring btc to 70k+ for its last leg UP.
if this weeks candle closes above previous star wick @ $40,348 this will be a morning star candle pattern which will give us a run up and confirming the potential double bottom pattern (Eve & Adam aka H/L DB) - and DB pattern will test its left leg down coming from 69k !
ETH Beautiful We can see higher high , higher low. If it confirms higher low i think we will see beautiful pump ! FIB correct

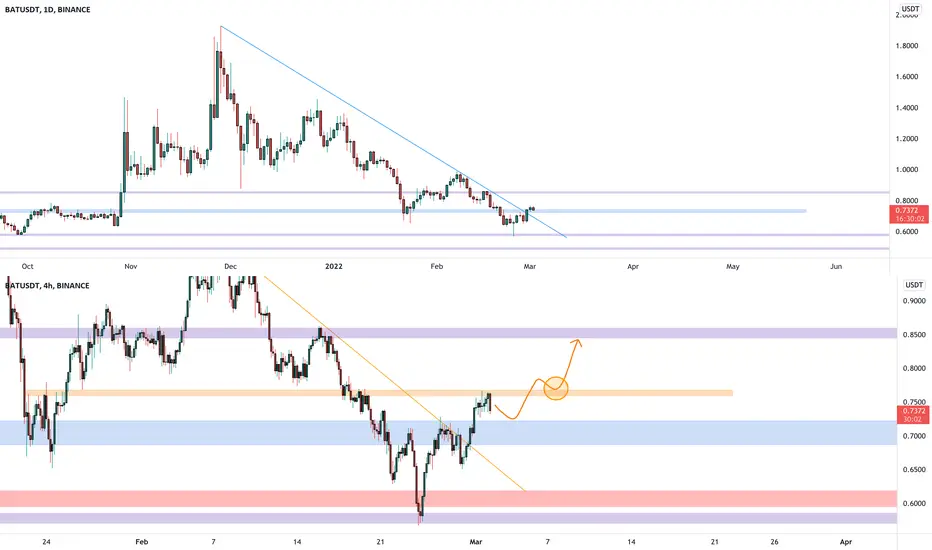
BATUSDT is searching the new higher lowThe price created a dynamic resistance on the daily timeframe and after a retest of the monthly support, the price had a breakout from the static daily resistance.
On the 4h Timeframe, the price is testing the 4h resistance on 0.75$ and got the first rejection. We could see a retest of the support on the 0.72$
how to approach?
If the price is going to confirm the breakout, we can add to our watchlist and wait for applying our rules for a new long position
–––––
Follow the Shrimp 🦐
Keep in mind.
🟣 Purple structure -> Monthly structure.
🔴 Red structure -> Weekly structure.
🔵 Blue structure -> Daily structure.
🟡 Yellow structure -> 4h structure.
The BTC warBitcoin is currently at war fighting to hold the low while attempting to break its down trend. just closed a wild daily with and 18% swing. opened yesterday losing 8%, then running up 18% from the low only to close up 3% on the day. one of the largest indecisions it has ever printed on daily. holding higher low on daily with major time scale closes ahead on Sunday with the weekly and Monday the monthly, there no reason whatsoever BTC cannot paint another major pattern like the prev and wave up with enough bids to break 40-50k. has to get enough bids to hold and follow thru major time scales in order to perform.

Bitcoin - Time for a Higher LowBitcoin has given us a a 40% rally from the lows in this most recent correction.
Market structure has shifted bullish by giving us a higher high. We have not yet been given confirmation with a higher low.
It has formed a daily SFP (Swing Failure Pattern) by wicking above previous structure and closing below as a bearish hammer.
This is a perfect opportunity to fill some structure below and give us a higher low.
Targets I am looking for a bullish pullback to are as follows:
Light pullback @ 40-42k
Deeper pullback at 38-39k
This idea is invalid if we begin to close the daily above $44,500 - we likely continue higher if so.
In times like this it helps to zoom out - $BTC is in a macro correction that cannot be properly traded on a 15 min chart. Long term swings need long term charts. I am still macro bullish on this asset class - but a 40% rally needs to fill some inefficiencies before it can move higher.
- Will, OptionsSwing Analyst

GBPUSD Breaking out of a Descending Broadening Wedge> Weekly pulled back to .618 Fibonacci, horizontal support, 200ema and found support to start a bull run now 3 weeks in. Possibly looking to reach the recent highs area at 1.4200.
> Daily formed a descending broadening wedge & is currently starting to breakout to the upside.
1. Price could continue breaking out on the daily and form a small pullback to retest the wedge and horizontal support (maybe 1 hour flag over a few days) before continuing to 1.3950 which is the top of the pattern.
OR
2. This could be a false breakout of the wedge. Price could make a larger pullback, moving back into the wedge and forming a higher low around 1.3500 horizontal support/ .382 Fibonacci/ 50ema, before forming a reversal and breaking out of the wedge again making a run to 1.3950 to 1.4200.
Invalidation for an entry would be price continuing to run to target without pulling back or price moving back into the wedge and failing to form a higher low, moving back down to the lows. A negative is the monthly did form a double top and is in a bearish run.

NZDCAD LONG IDEAHey guys, this pair is currently at deep discount on the monthly Tf. On the h1 TF, we see higher highs and higher lows forming. I'm very bullish on this pair
