Trading PSYCH levels Testing new strategy
only high probability trading
if price reaches to the next psych level before the sell stop is triggered the trade is invalidated.
but if does than our stop loss is 50 pip from the entry level and aiming to get about 75 pips - commission.
if price reaches 18200 we will look to capture the sell stop from that area.
risk management is key
Highprobability

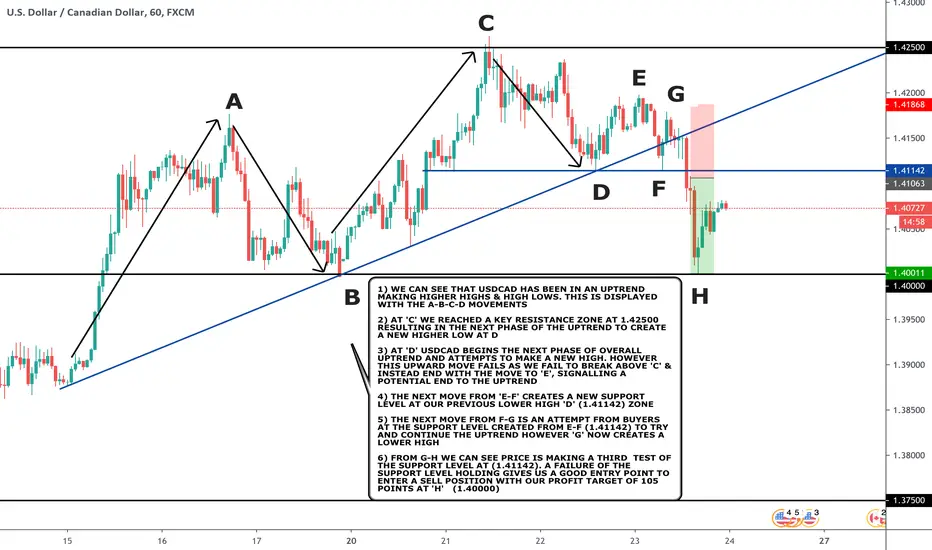
HOW TO TRADE MARKET STRUCTURE HOW TO TRADE MARKET STRUCTURE
1) WE CAN SEE THAT USDCAD HAS BEEN IN AN UPTREND MAKING HIGHER HIGHS & HIGH LOWS. THIS IS DISPLAYED WITH THE A-B-C-D MOVEMENTS
2) AT 'C' WE REACHED A KEY RESISTANCE ZONE AT 1.42500 RESULTING IN THE NEXT PHASE OF THE UPTREND TO CREATE A NEW HIGHER LOW AT D
3) AT 'D' USDCAD BEGINS THE NEXT PHASE OF OVERALL UPTREND AND ATTEMPTS TO MAKE A NEW HIGH. HOWEVER THIS UPWARD MOVE FAILS AS WE FAIL TO BREAK ABOVE 'C' & INSTEAD END WITH THE MOVE TO 'E', SIGNALLING A POTENTIAL END TO THE UPTREND
4) THE NEXT MOVE FROM 'E-F' CREATES A NEW SUPPORT LEVEL AT OUR PREVIOUS LOWER HIGH 'D' (1.41142) ZONE
5) THE NEXT MOVE FROM F-G IS AN ATTEMPT FROM BUYERS AT THE SUPPORT LEVEL CREATED FROM E-F (1.41142) TO TRY AND CONTINUE THE UPTREND HOWEVER 'G' NOW CREATES A LOWER HIGH
6) FROM G-H WE CAN SEE PRICE IS MAKING A THIRD TEST OF THE SUPPORT LEVEL AT (1.41142). A FAILURE OF THE SUPPORT LEVEL HOLDING GIVES US A GOOD ENTRY POINT TO ENTER A SELL POSITION WITH OUR PROFIT TARGET OF 105 POINTS AT 'H' (1.40000)
EOS/USD best time to buy high probabilityEOS/USD on 4hr tf in uptrend as well as on the daily now is back at previous ressistance now act as support also the volatility in the market is pretty pretty low and the price is about to BRUUUUHHH explode higher. :D verry verry good opportunity that rarely occur and we can take up to 10RISK TO REWARD . DONT forger to give me a like and follow for more brilliant ideas.

usd/jpy descending triangle forming in 4h tfUSS/JPY on 4hr tf forming something like desc.triangle and on daily its just below key ressistance level perfect time to enter with excelent risk to reward (more than 3) and even possible to trial our stop loss and ride the new trend thats about to occur.
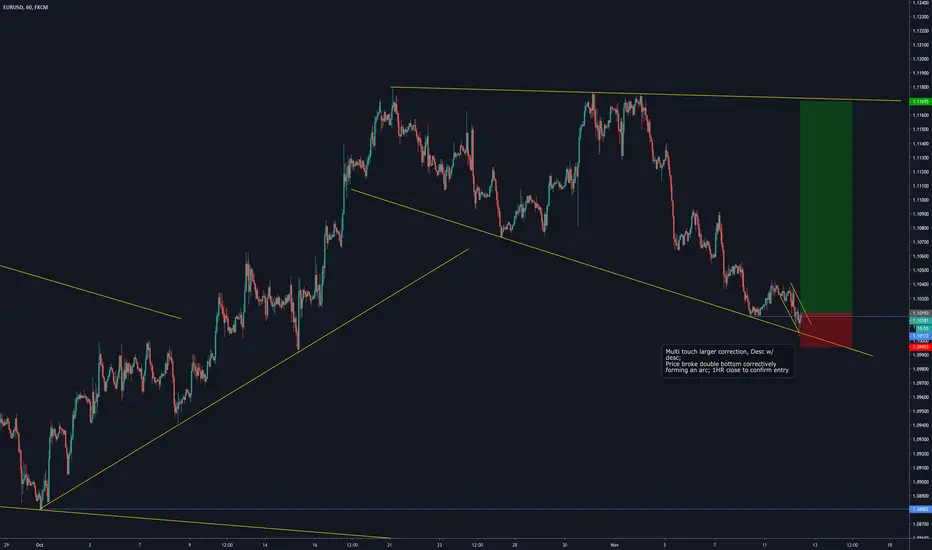
EUR/CAD: SELL SETUP with high probabillityHey tradomaniacs,
right now we can see a clear move into a zone if high potential of bearish confluence as we hit two trendlines and a strong resistannce-zone.
This could be a price-zone where the breakout of the previous Trendline (a) could continue.
Watch out for fakeouts to the topside before entering. ;-)
LEAVE A LIKE AND A COMMENT - I appreciate every support! =)
Peace and good trades
Irasor
Wanna see more? Don`t forget to follow me.
Any questions? PM me. :-)

GBP/USD - ROADMAP FOR NEXT WEEKHopefully we get a nice flat we can buy on GU next week ill be watching for sure , hope everyone has good week.

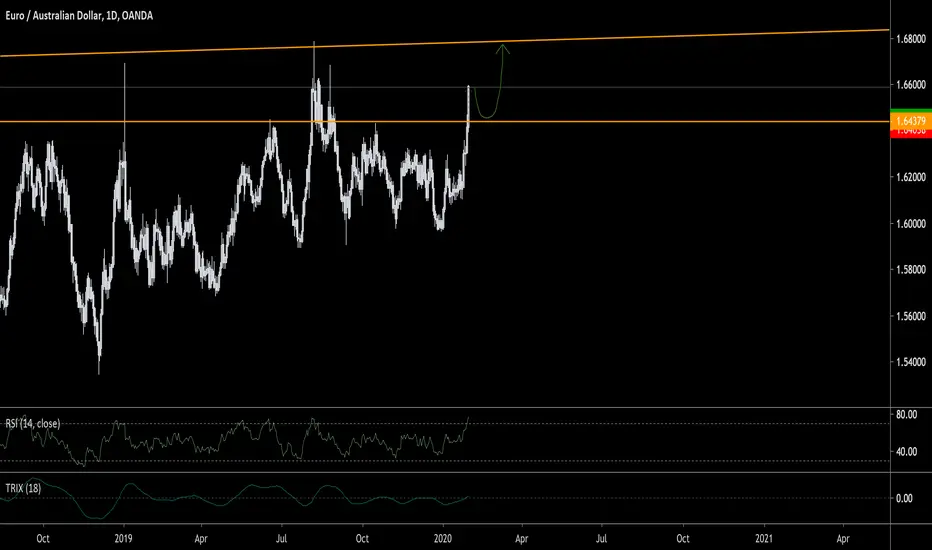
EUR/AUD BUY - 12. FEB. 2020Price is approaching a strong support area with RSI and Stochastics oversold. Use proper risk management! "Comment", "Like" and "Follow" are appreciated!

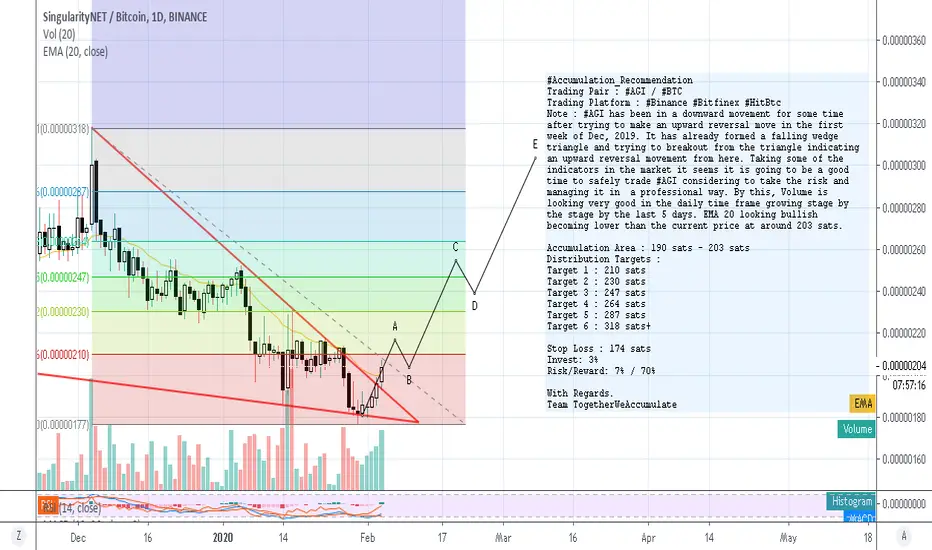
#AGI [SingularityNET] - Upto 70% Profits Opportunity.#Accumulation_Recommendation
Trading Pair : #AGI / #BTC
Trading Platform : #Binance #Bitfinex #HitBtc
Note : #AGI has been in a downward movement for some time after trying to make an upward reversal move in the first week of Dec, 2019. It has already formed a falling wedge triangle and trying to breakout from the triangle indicating an upward reversal movement from here. Taking some of the indicators in the market it seems it is going to be a good time to safely trade #AGI considering to take the risk and managing it in a professional way. By this, Volume is looking very good in the daily time frame growing stage by the stage by the last 5 days. EMA 20 looking bullish becoming lower than the current price at around 203 sats.
Accumulation Area : 190 sats - 203 sats
Distribution Targets :
Target 1 : 210 sats
Target 2 : 230 sats
Target 3 : 247 sats
Target 4 : 264 sats
Target 5 : 287 sats
Target 6 : 318 sats+
Stop Loss : 174 sats
Invest: 3%
Risk/Reward: 7% / 70%
With Regards.
Team TogetherWeAccumulate
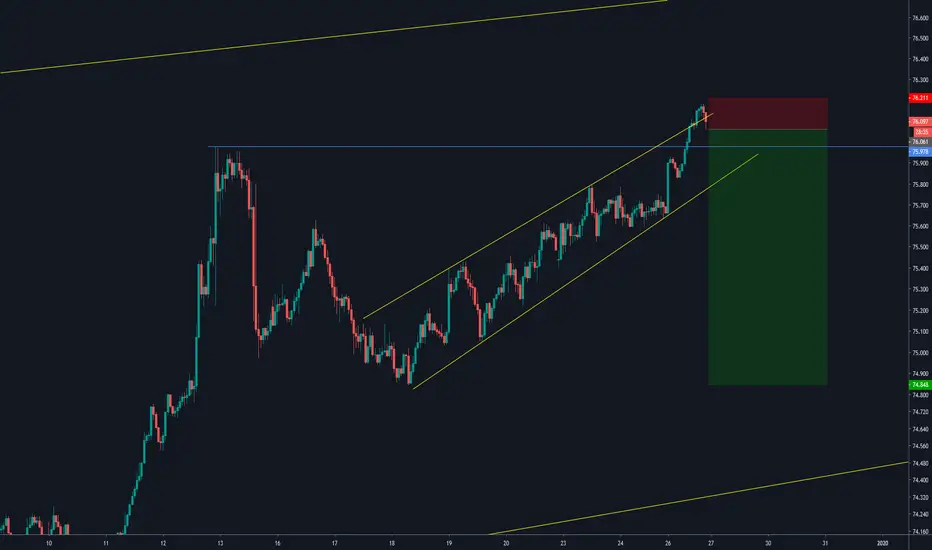
EUR/AUD - LONG - 2. FEB. 2020High chance of correction followed by the continuation of an impulse to the weekly trendline
"Comment", "Like" and "Follow" are appreciated! Have a great week everyone!
AUD/JPY Trade Setup (High Probability)We've reached the structure high of the ascending channel (as mentioned in the previous post) and have correctively broken it on the 15min timeframe (with a rising wedge). We've now broken back into the channel but since it's the daily close, we're going to wait until the spreads calm down (which usually takes an hour or so after the daily close). I'll be entering on the close of the 1hr retrace with a 15 pip stop (just above the structure high). This is an update on the forecast that was done this afternoon.
EURNZD Long Trade Set Up *DAILY TREND & HIGH R:R*Here is a potential long trade set up on the Euro / New Zealand Dollar FX currency pair.
Daily Timeframe - Nice rejection of the daily bullish trendline drawn across the last 2 higher lows. Price has made higher highs through September so the higher timeframe is definitely bullish for me.
Lower Timeframe - Price has broken the 1hr bearish trendline and produced a higher low and higher high over the last few trading days. Price is now pulling back in to the bullish daily and 1hr trendlines supporting price. I am looking to enter a long position if prices reaches the coloured zone on the chart.
This zone would be a bounce off the daily pivot level, 0.786/0.618 fib retracement levels, 1hr bullish trendline to hold strong and a higher low to form.
By entering on the 1hr timeframe I can get a fairly tight stop loss and then swing trade the daily trend up to new daily highs. This could see price reach 1.80 next!
With a 45 pip stop loss and target profit at 1.80 this could return a mega 25:1 RR before any scaling in.

EURUSD LONG UPDATEHigh Probability Trade Update
EURUSD FLAG LONG
Result: +2.77%
Buy order set after an impulse out of the corrective channel, entry set after the flag confirmed the correction and long bias.
Structure > Nature > Price Action

AUDUSD, Potential LongSimilar case to NZDUSD. If price drops to the support level we may be looking at a long with a 5 pip SL and 1:3 RR. Also haven't done the weekly reversal yet, may increase anytime soon.
XAUUSD - GOLD - AIMING DOWN AFTER SH Gold is heading down after retracing from those previous highs, after grabbing orders up.
USDCAD SHARK PATTERNHello, Good day! I just found a shark pattern on USDCAD as you can see. It seems highly probable due to the fact that its exactly around the 88.6% retracement currently, It's also literally on a major trendline, at a possible major support area and its at the 38.2% Retracement of the low to high of the trend.
Join my telegram channel for future updates! t.me

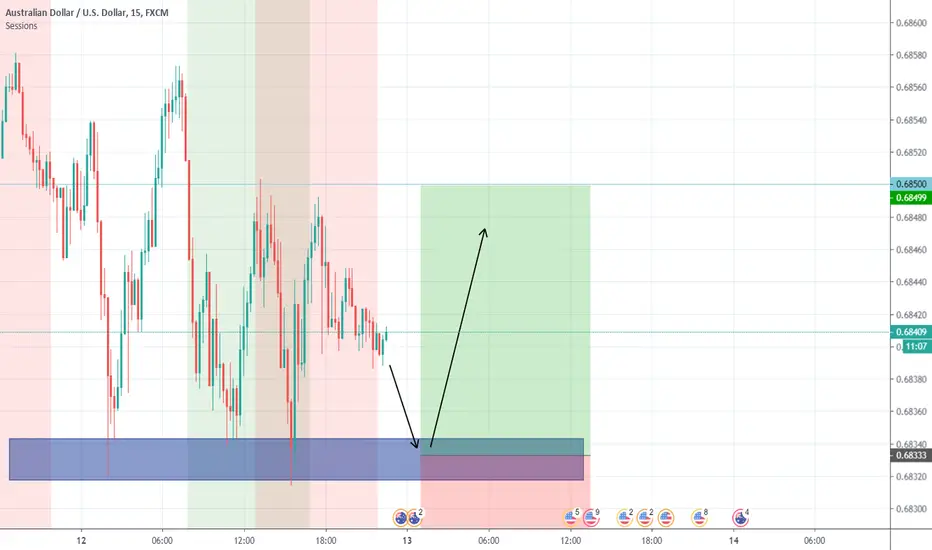
AUDCAD 15m SELLI'm setting and forgetting an entry on a supply zone very high on the curve that is already in a down trend. The leg out wasn't explosive but it did leave a 2:1 from entry. The relative strength has the CAD at the strongest on both the DAILY and HOURLY charts, while the AUD is either the weakest or second to weakest on both time frames. There is a demand zone there, waiting, and if it shows confirmation of a reversal then I will close there. But if it doesn't hold, expect at least a 5:1 RR.
Gartley Bearish Pattern IdentifiedThis was pattern was identified today, Sept 7.
Expect price to go down.
Entry - 1.2168 to 1.2258
SL - 1.2400
TP1 - 1.2050 (move stop loss to break-even)
TP2 - 1.1872
TP3 - 1.1699
Manage your exit properly. This is high probability trade set up.
Good luck.

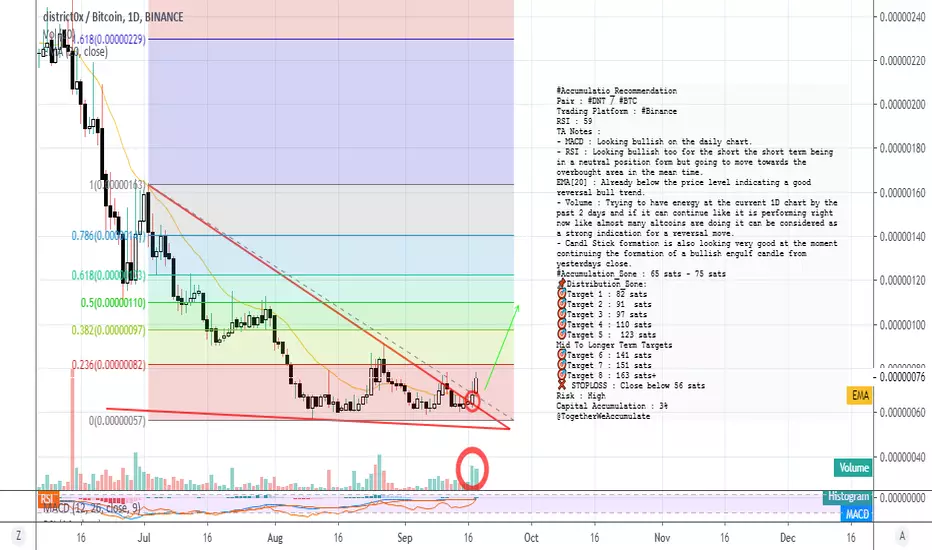
#DNT : Upto 150% Profits For The Mid Term#Accumulatio_Recommendation
Pair : #DNT / #BTC
Trading Platform : #Binance
RSI : 59
TA Notes :
- MACD : Looking bullish on the daily chart.
- RSI : Looking bullish too for the short the short term being in a neutral position form but going to move towards the overbought area in the mean time.
EMA : Already below the price level indicating a good reversal bull trend.
- Volume : Trying to have energy at the current 1D chart by the past 2 days and if it can continue like it is performing right now like almost many altcoins are doing it can be considered as a strong indication for a reversal move.
- Candl Stick formation is also looking very good at the moment continuing the formation of a bullish engulf candle from yesterdays close.
#Accumulation_Zone : 65 sats - 75 sats
Distribution_Zone:
Target 1 : 82 sats
Target 2 : 91 sats
Target 3 : 97 sats
Target 4 : 110 sats
Target 5 : 123 sats
Mid To Longer Term Targets
Target 6 : 141 sats
Target 7 : 151 sats
Target 8 : 163 sats+
STOPLOSS : Close below 56 sats
Risk : High
Capital Accumulation : 3%
@TogetherWeAccumulate
CAD/CHF SIGNAL FROM THE WORLDS BEST SIGNAL PROVIDERCAD/CHF BUY. Setups doesnt include analysis. DM to join my signals.

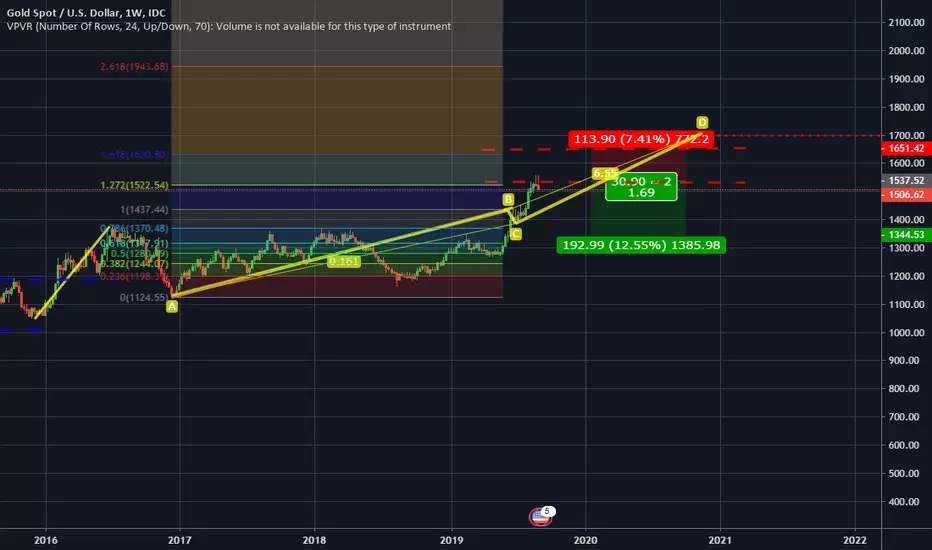
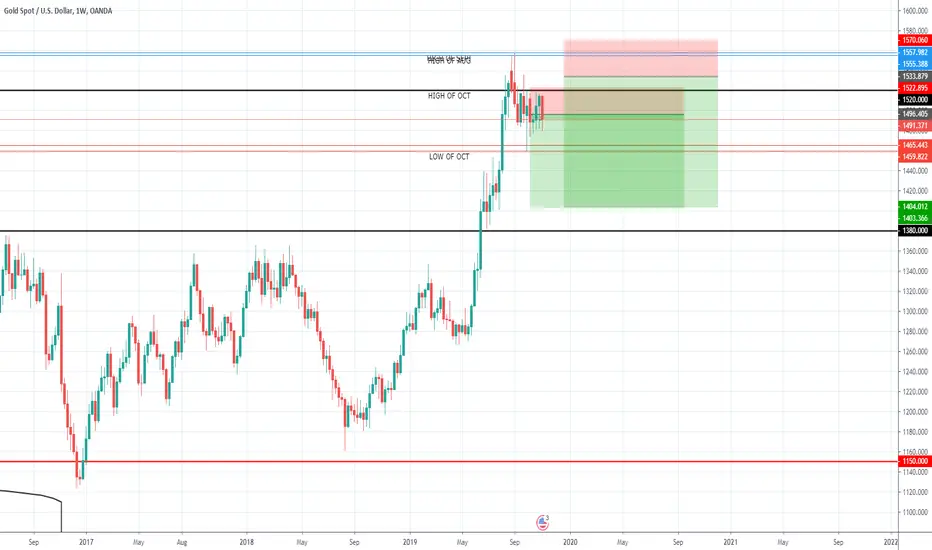
Reviewing Gold on Weekly Time Frame using Simple AB=CD PatternHi, I made a look back since 10 years ago on gold on a weekly time frame.
I found an amazing pattern yet simple pattern (AB=CD) and using fibo level to determine entry level.
Trend 1 (Bullish) : October 2008 to August 2011
Trend 2 (Bearish): September 2011 to December 2015
Trend 3 (Bullish) : January 2016 to present
With help of the fibonacci extension level, the zone between 1.217 and 1.618 is the optimal point where the market reverses its trend. (see chart above)
What does it mean? Applying the same strategy, we can see that the current price range (i.e. 1525 to 1635) is within 1.217 and 1.618 fibo level.
Based on this analysis, I believe the gold will reverse it trend before continuing the next bullish cycle.
Look for opportunity to short the market and ride the downtrend.
If this analysis helps you, please hit the "Like" and share to help others as well.
Please leave your comments below or send me a message.