Highprobability

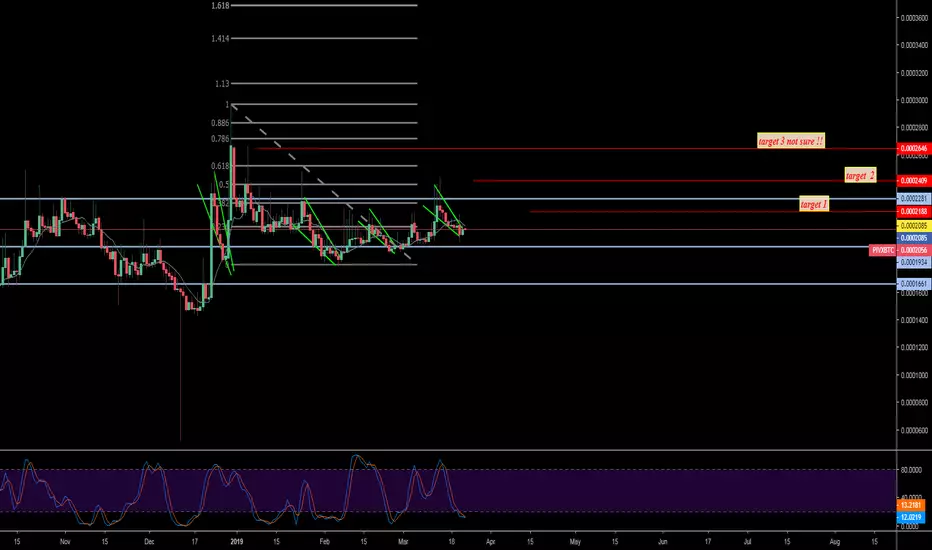
PIVX A PUNTO DE BREAK OUTPIVX A 3 DIAS DE SEGUMIENTO CON UNA SUBIDA DE 1.3% MAXIMO,
Posible endencia alcista entre hoy y manana veremos y esperemos a que reviente.
compra 2015 to 2050
venta 2187 to 2646 ( dependiendo por que target te animes, yo siempre voy a la segura con el primer target)
stop l 1980 - 1975
Con fe segun la grafica y el stocastic rsi estamois cerca al break out.
From The Crypto Zone
De La Zona Crypto.
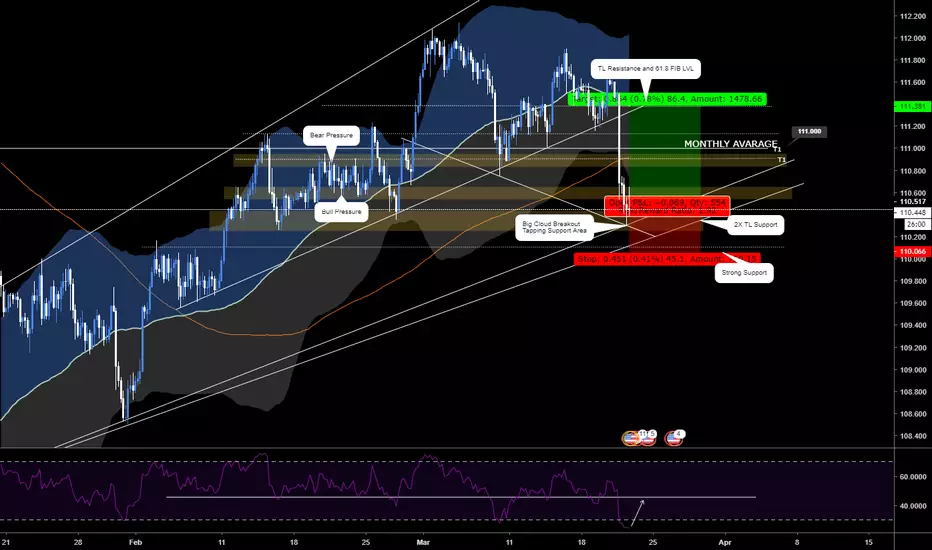
"Good profits come to those who wait"My USDJPY trade idea has been in the making for the past 5 trading days, over a week now!
Its important though that as a trader you are willing to wait for the right criteria to be met, and to only enter the market on your terms... not the markets. So this is a matter of stalking the market and reaping the rewards later.
Ever since the JPY liquidity crash on January 2nd, the rising channel has supported USDJPY, this level has been strongly defended by the bulls, never more so than the past 5 days. I think the reason why is that if this level is broken, then there is considerable downside available to the bears, with little in the way of support.
So... Onto the setup. You should able to see the point of interest highlighted as the yellow box, showing us the daily Inside Candle setup. This isn't just any inside candle setup however, as it has now stretched to 4 inside candles inside the mother bar! This level of consolidation simply means the breakout could be even more powerful.
Because the Inside Candle Pattern is located on a key market level, it gives it relevance, I wouldn't be interested in trading an inside candle setup in the middle of nowhere with little market relevance. Also it gains further importance due to being formed on the Daily time-frame. All setups and candlestick patterns formed on the daily chart are significantly more reliable than lower time-frames.
To add even more confluence to the trade setup, you can see some further resistance that will be broken by the blue trend-line, any candle breaking the inside bar high, will also break this level. Equally any break to the downside breaks the long term trendline from 2nd January, simply meaning we can expect a big move following any breakout.
There are two ways to trade this setup. The aggressive approach would be to take your entry long when price breaks the high of the mother bar, or a short when price breaks the low of the mother bar. The conservative approach would be exactly the same but you only enter the trade once the candle has actually closed - this avoids the potential of a false breakout but also means you might miss out on some potential pips.
The targets for long trades will be the top of the rising channel.
The targets for short trades will be the next Daily Key Level around 109.000
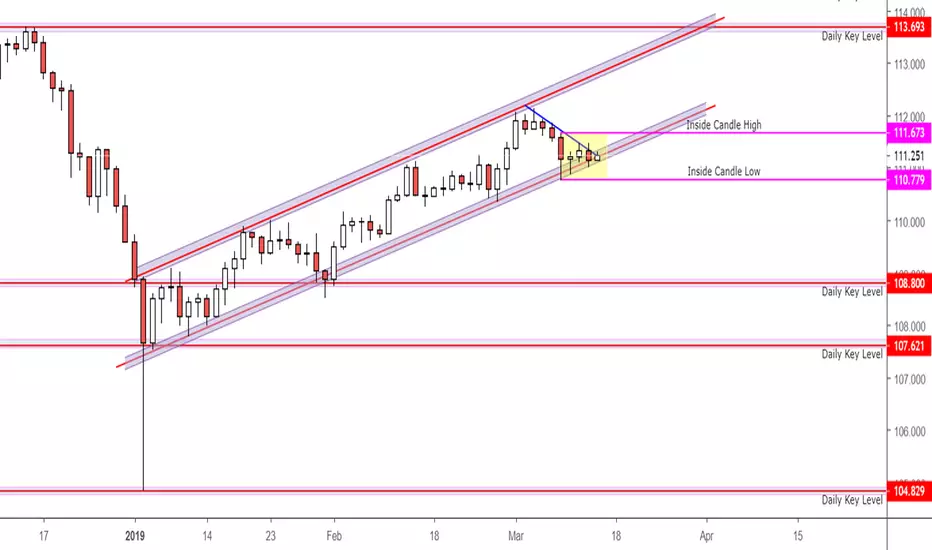
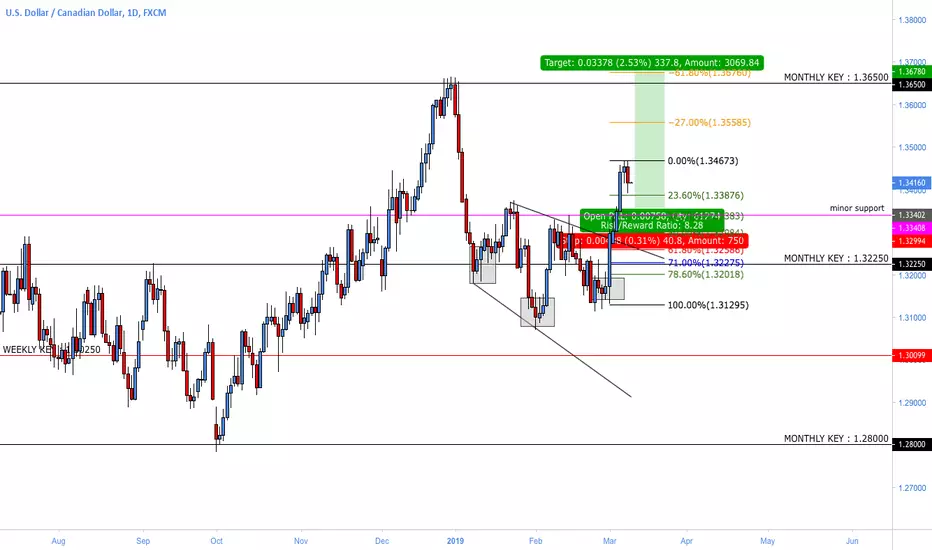
High probability USDCAD Long With Good R/RUSDCAD has seen Higher Highs ( HH ) and Higher Lows ( HL ) being made on the Weekly and Daily timeframes for a good while now with 1 or 2 Lower Highs / Lower Low fake outs to pull sellers in, however this pair remains bullish. An Inverse Head & Shoulder pattern can be seen on the Daily timeframe which was formed aggressively on the 1st of March. This broke a descending channel creating a HL followed by a HH, with that being said, a HL should be formed to continue our leg to the upside. I have a Minor support on the daily in purple, using the Fibonacci Tool, this sits on a 38.2% retracement zone which will likely be my entry, with a tight stop loss of 30-40 pips. I will be looking for more confirmation with a bullish candle stick pattern at these zones. However this pair can retrace further to the Monthly Key shown which would lay on another great Fibonacci retracement zone. A retracement to the downside by 60-80 pips creating a HL would be favoured for you to then go long on this pair. The DXY looks to retrace before breaching 98.00 regions so this trade looks highly probable as well as the correlation between DXY and Gold, as Gold looks to retrace to the upside before seeing long term downside targets of 1250.00/1260.00 regions.
REMEMBER : Risk management is key for all trades & Have a profitable trading week everyone !
Instagram: keownarcher
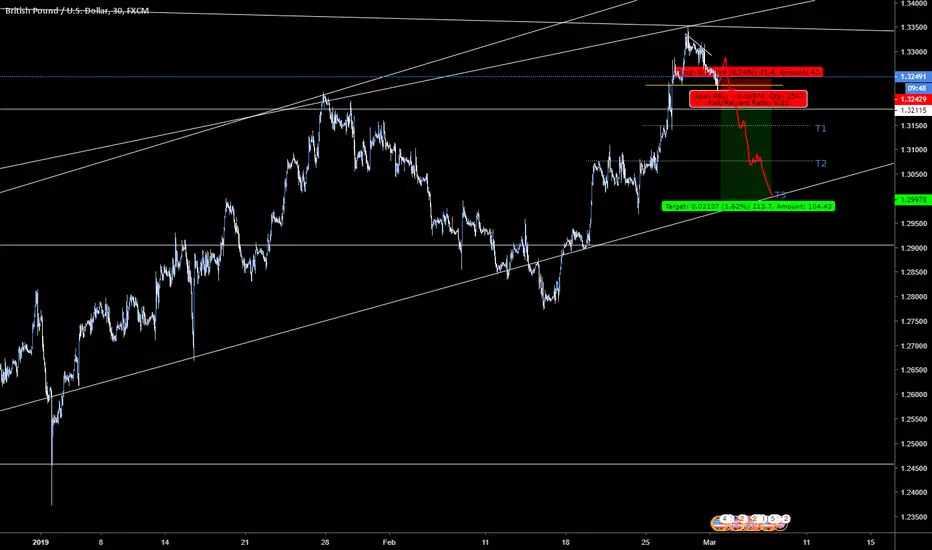
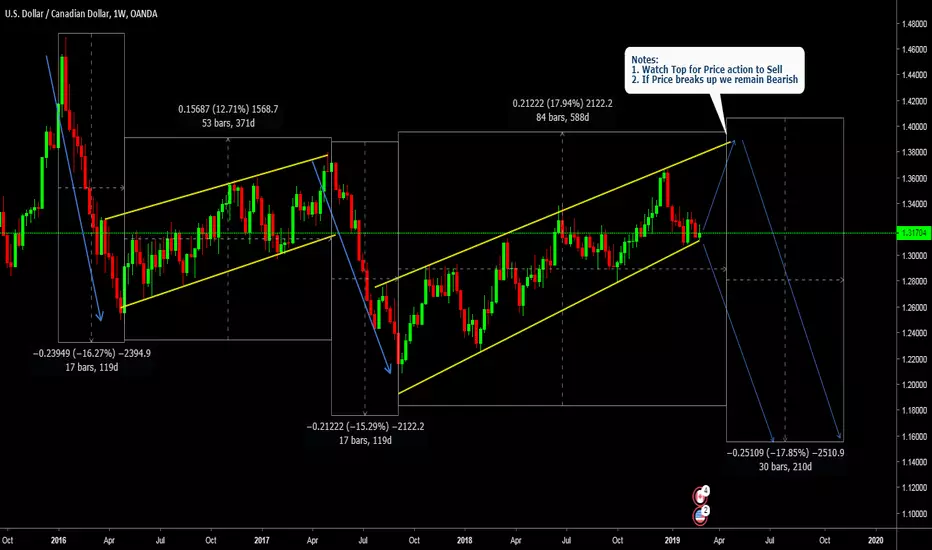
USDCAD AnalysisPrice action is forming trend reversal signal showing that USDCAD COULD REVERSE TO THE DOWNSIDE.....Read chart and monitor price action to sell.
High Probability trade on USDHKDThis pair is a fixed pegged currency pair ....right now price is just 10pips away from 7.8500 peg price. Going short is the only way for this pair at the moment except there is a change on the agreement on how this currency pair is managed.


SDGCHF +300 Pips Short, Low risk high probabilityAnalysis should indicate loads of signs to go short
Feel free to ask any questions

EURJPY - HIGH PROBABILITY BUY SETUP EURJPY is slowly but surely setting up to give us a long setup in the coming weeks. Before we do, we're going to have the completion of the current correction we're in.
#AUDCHF Bullish Breakout Setup - 4HR The 4Hr chart and the daily chart both have long setups as shown by the indicator. This means that if the 4HR setup triggers, the Daily setup will have a high probability of triggering also. Entry is triggered if price breaks .725777 level
I’m looking to take up the the next MTF resistance on the daily chart, around .75190. Stop loss trails with the green dots, and watch the indicator for overextension signals
If you find this useful, please like and subscribe to get notified of updates and new ideas!
If you want to tryout the indicators and strategy, follow me and drop a comment or pm and I’ll get you set up.
Stay calm, and happy trading!

CADJPY- Bull Breakout Triggered- 4HR
Bullish Breakout trade on the 4 Hr chart triggered. Looking at the next MTF level to take profit, at 85.58.
As always, use the green dots as trailing stop and look out for overextension signals from the indicator
If you find this useful, please like and subscribe to get notified of updates and new ideas!
If you want to tryout the indicators and strategy, follow me and drop a comment or pm and I’ll get you set up.
Stay calm, and happy trading!

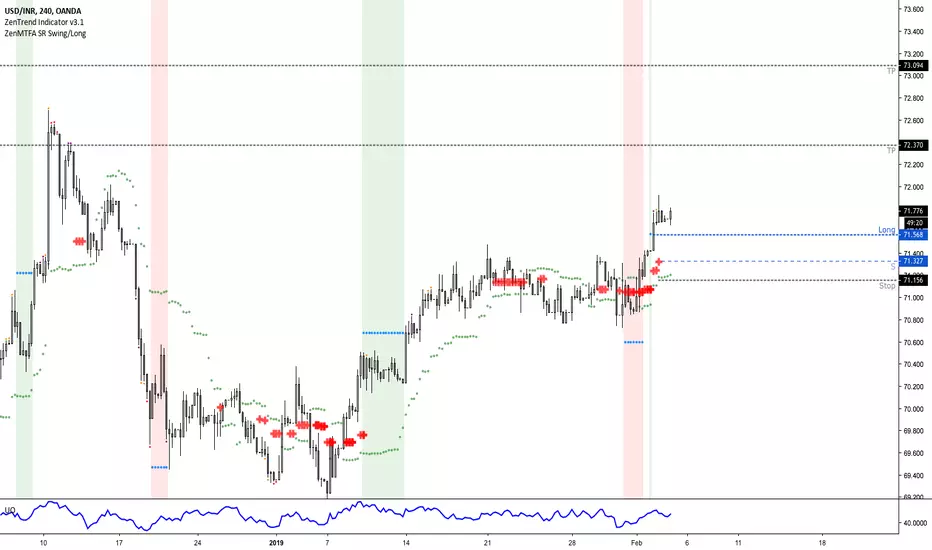
USDINR- Bull Breakout Triggered- 4HR
Bullish Breakout trade on the 4 Hr chart triggered. Looking to reach the next MTF levels 72.370 and 73.08 to take profits. As always, use the green dots as a trailing stop and look for overextension signals from the indicator
If you find this useful, please like and subscribe to get notified of updates and new ideas!
If you want to tryout the indicators and strategy, follow me and drop a comment or pm and I’ll get you set up.
Stay calm, and happy trading!
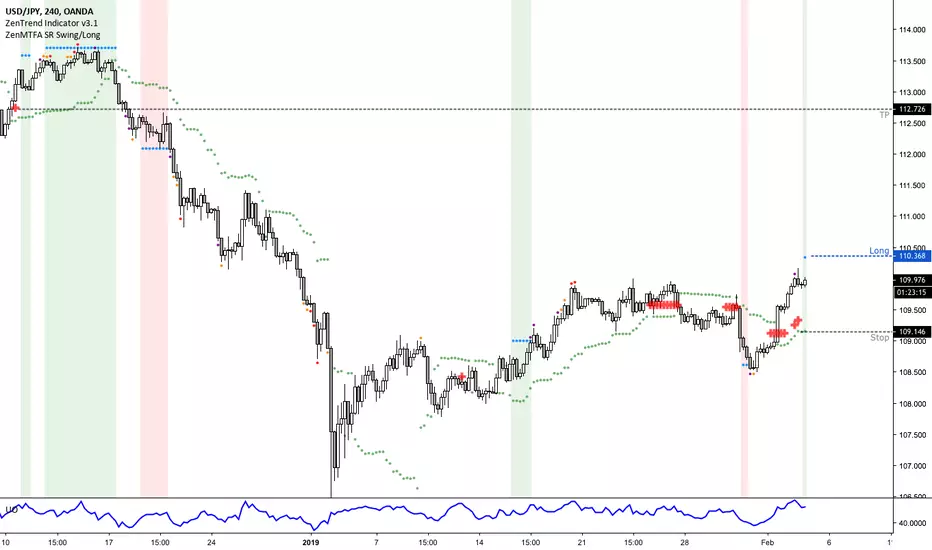
USDJPY- Bull Breakout Setup - 4HR
Long Breakout Setup on the 4Hr chart. MTF support formed on the last leg up, which is a good sign. If the trade is triggered, I’m looking for it to reach 112.725, as always, trail the stop with the green dots and watch for the indicator overextension signals
If you find this useful, please like and subscribe to get notified of updates and new ideas!
If you want to tryout the indicators and strategy, follow me and drop a comment or pm and I’ll get you set up.
CHFJPY Long Setup - 4HR Price has been consolidating, failing to breakout either way. After the last bearish setup failed to follow through, I’m looking for a bullish entry. Target is the first MTF level at 112.01, as always: trail the stop with the green dots and watch for the indicators overextension signals
If you find this useful, please like and subscribe to get notified of updates and new ideas!
If you want to tryout the indicators and strategy, follow me and drop a comment or pm and I’ll get you set up.
Stay calm, and happy trading!

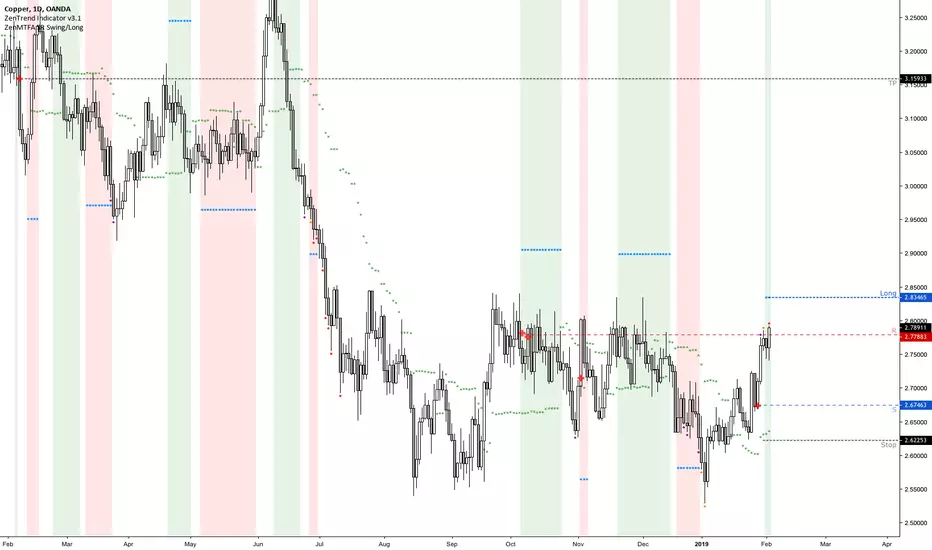
XCUUSD Copper - Bull Breakout Setup - DailyBullish breakout setup on the Daily chart for Copper.Price has been consolidating and failed to follow through on the last bearish setup, so the likelihood of it going bullish is larger. MTF support (Red cross) was formed on the most recent leg upwards, which is also a good sign, and we’re currently at MTF resistance. If this breaks look to enter long at the breakout of 2.83465. Use the green dots to trail as stoploss.
The next MTF level on the daily chart is at 3.15933, and thats where I’m looking to exit, but as always, trail the stop as the trade develops and watch for overextension signals to possibly tighten the stop,
If you find this useful, please like and subscribe to get notified of updates and new ideas!
If you want to tryout the indicators and strategy, follow me and drop a comment or pm and I’ll get you set up.
Stay calm, and happy trading!