Long Scalp PlayBuying pressure on the 15 minute after gapping up. Bulls are testing support and definitely could pop the resistance! Short term here for some quick gains. Moving averages all angled up and sellers aren't bringing it down. Very volatile... easy scalp here
Highprobability

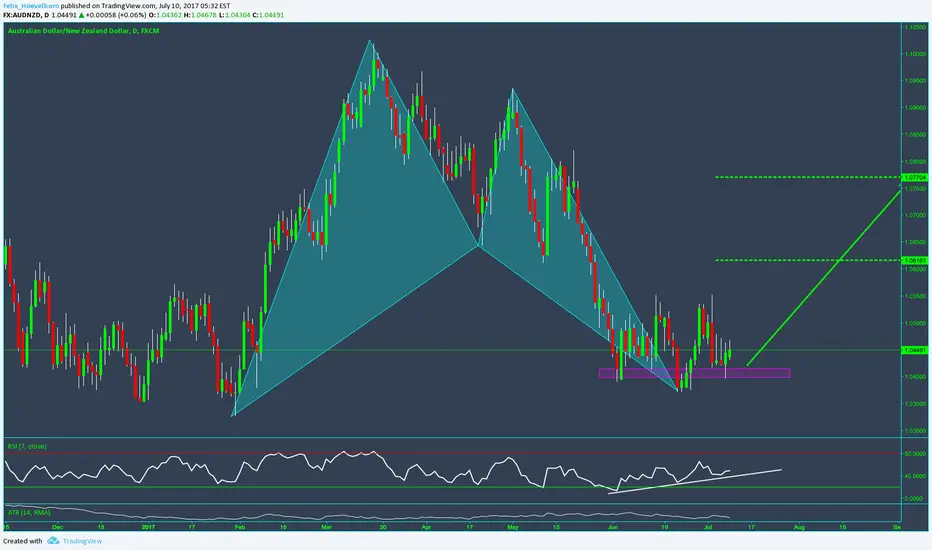
Daily Bat Pattern with H & S Support at previous structure!Hey folks,
I've found a bullish Bat Pattern on AUDNZD Daily Timeframe. I do not trade based of the daily timeframe but thought this one might be interesting to share with you guys. There is also a potential Head and Shoulders Formation which makes it even more interesting. If we break the neckline of the H&S then there are potentially more traders looking to go long this pair.
As always,
Trade your plan!
Cheers, Felix
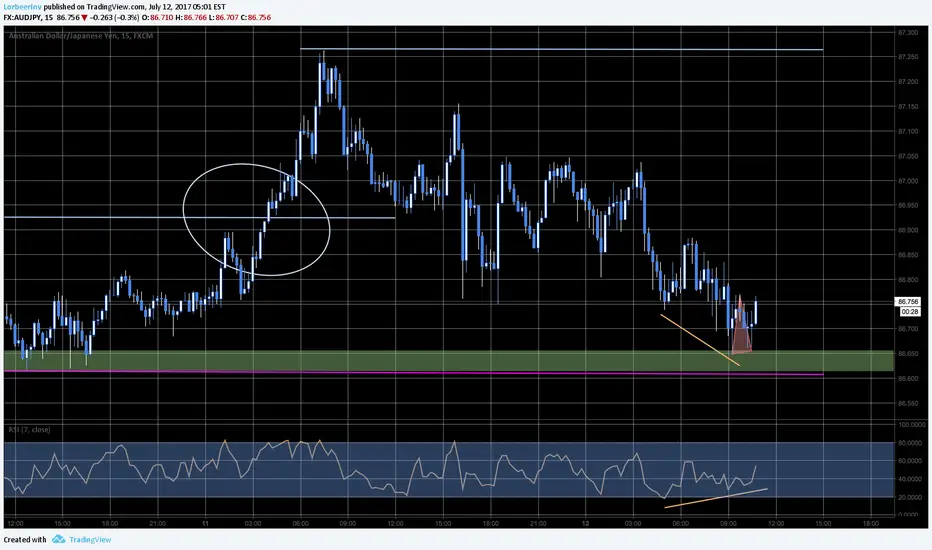
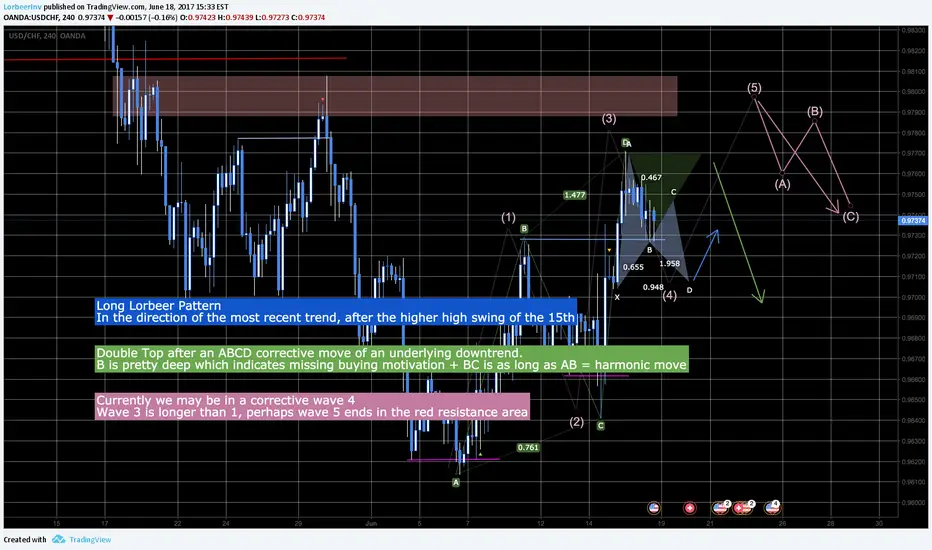
Lorbeer Pattern in SupportAfter 2 hit targets on the double bottom price now formed a Lorbeer Pattern
Wait for candlestick pattern to confirm entry

HighProbable Trendtrade 2:1 RRR The same set up is given on the Eurodollar but the Eurosterling provides a much better RRR

Classic trend trade => High Probability & Great RRRBreakout of daily swing high
Pullback into Support
RSI o/b condition + Divergence
Double bottom
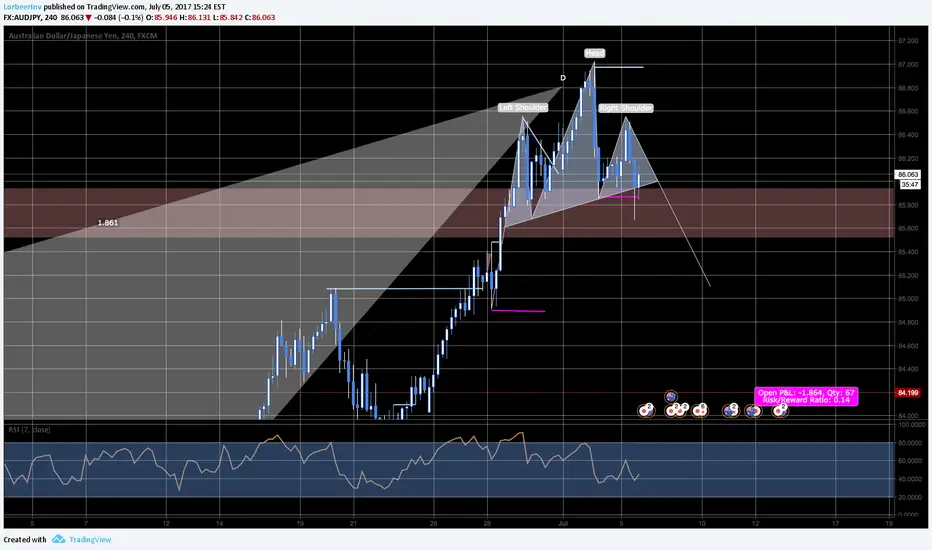
Multiple Argument short entryPrice started to form what could become a H&S - Pricepattern
On the 60M we see that the second Shoulder comes in form of Double Top. Not yet confirmed since the SwingLow of the DT is not yet broken but price gave us a CandlestickPattern on the second top. Since we are at major Resitance of higher timeframes I see an edge on the trading diection => short wich could complete the H&S and then privde further opportunity.
1. Short on speculating on a neck break of the H&S
2. Long on candlestick pattern at Support on the 60M, speculating that price bounces back to the neck line
3. Short again on the neck line speculating on a continued trend
4. Second short entry possibility on ShouldersRessitance

H&S for entry and Bat for directionLooking at th daily we see a completed BatPattern. The daily is too big for most traders however so they leave it off the radar.
If you move to a 240M TF you see that price is about to form a H&S Pattern which may serve as entry signal and orientation for Target and Stop Loss orders
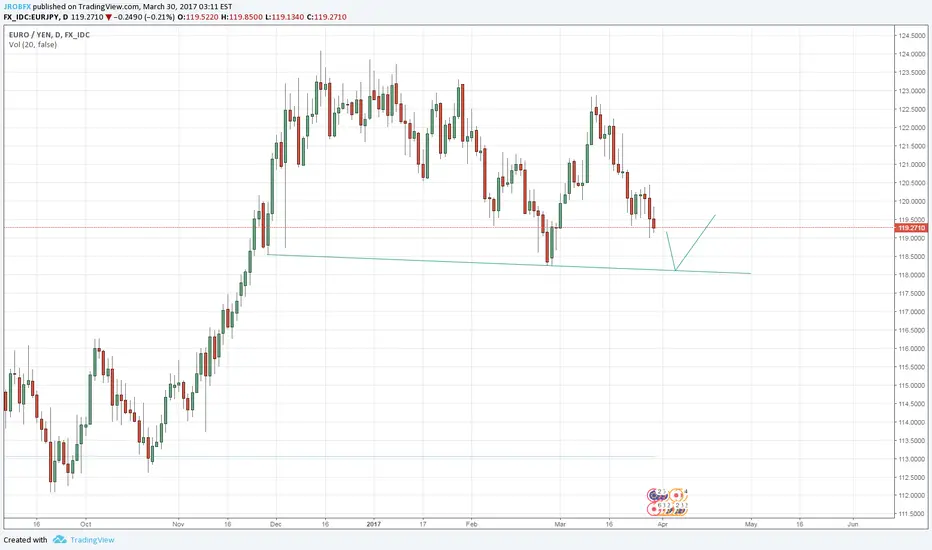
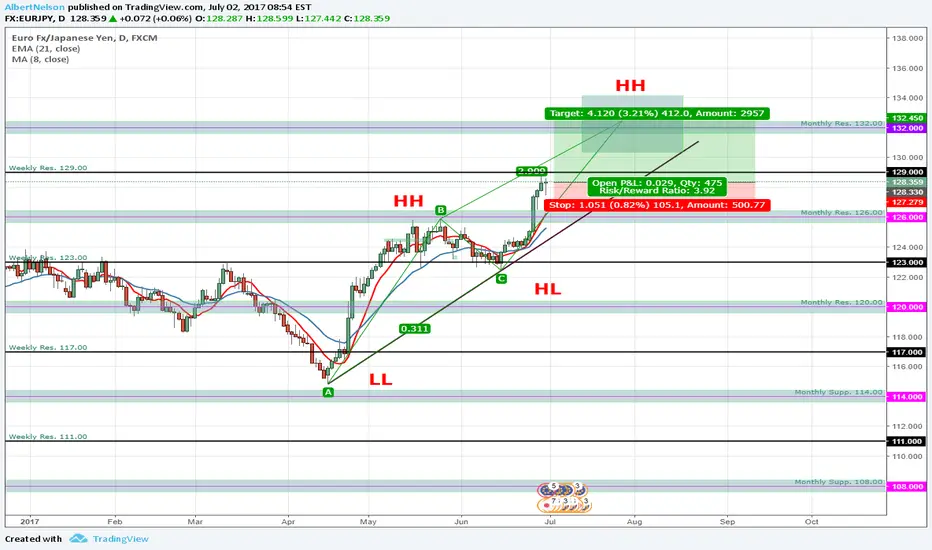
EURJPY still in Bullish Continuation Super Mario is at it again with his hawkish comment that raised the EUR versus the usd and other currencies.
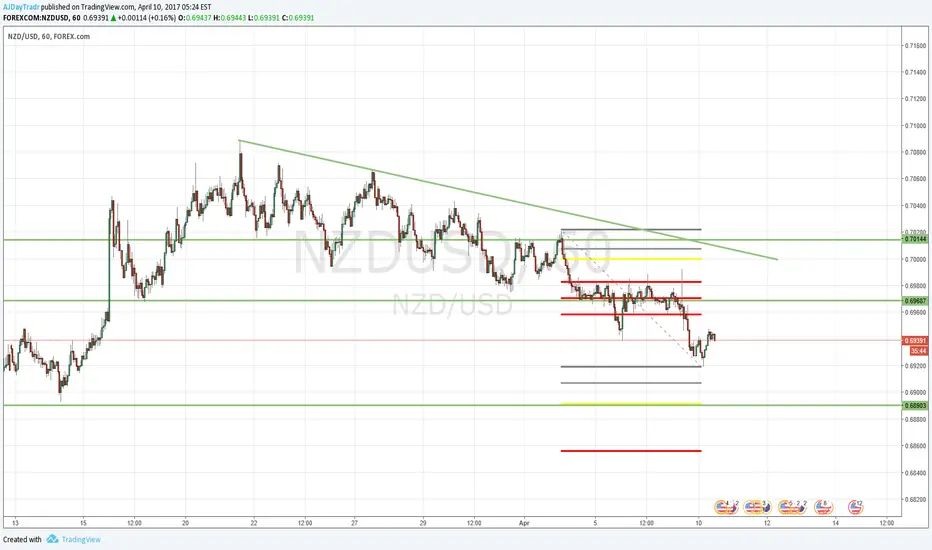
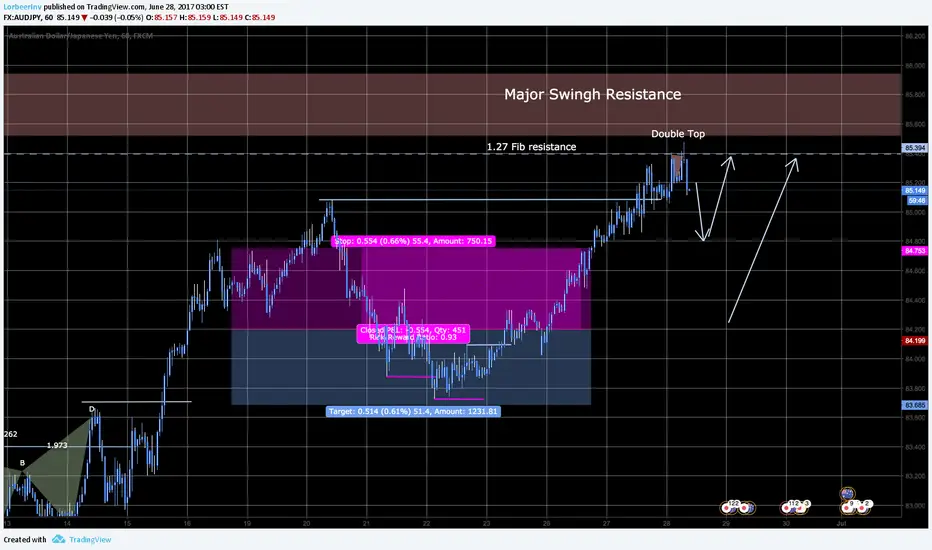
High Probability OpportunityPrice is
a) just short of high timeframe resistance
b) at minor Fib extention resistance 1.272
c) Confirmed double top
Looking for a 382 retraceemnt short then build long position to target long TP in the red resistance area
[Tips] High-Probability Trade with Fibonacci Retracement
How To Use Fibonacci Retracement to find High-Probability Trade Setup
Brief Definition:
Fibonacci retracement is a very popular tool among technical traders and is based on the key numbers identified by mathematician Leonardo Fibonacci in the thirteenth century.
In technical analysis, Fibonacci retracement is created by taking two extreme points (usually a major High and Low) on a chart and dividing the vertical distance by the key Fibonacci ratios of 23.6%, 38.2%, 50%, 61.8%, 78.6%, and 100%.
Once these levels are identified, horizontal lines are drawn and used to identify possible support and resistance levels.
These ratios seem to play an important role in the financial market and can be used to determine critical points that cause price to reverse. The direction of the prior trend is likely to continue once the price has retraced to one of the ratios listed above.
Tips for Effective Setup:
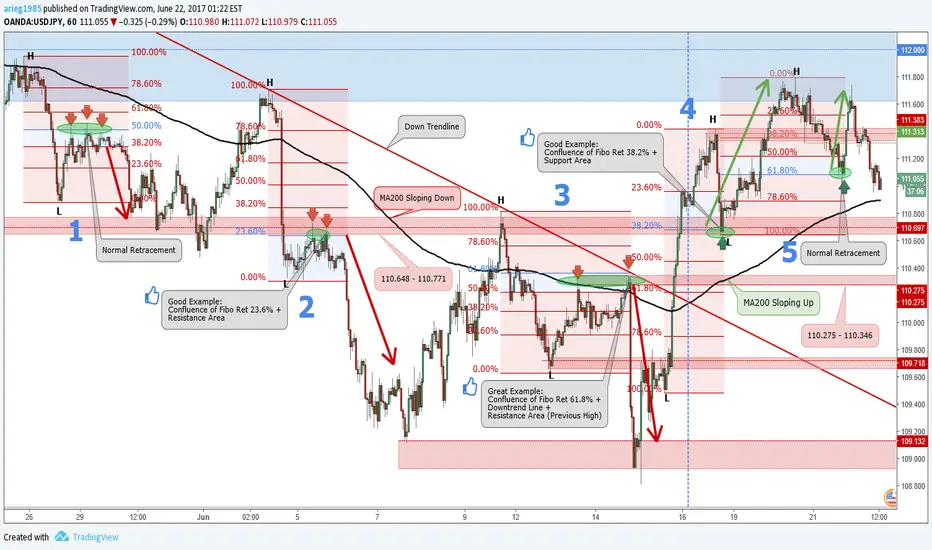
1. Analyze the general overview (big picture) of price movement to the current trend.
In the above example, blue vertical line divides chart into 2 section, Downtrend on the left and Uptrend on the right.
We can use MA200 to identify the overall trend.
2. Look at the price movement carefully and then draw Fibo Ret from the extreme pivot points.
For Downtrend, drag 100% level from previous High to 0% level at the newly formed Low.
For Uptrend, drag 100% level from previous Low to 0% level at the newly formed High.
3. Pay attention to the price movement to the opposite direction of the general trend.
Wait for any price rejection to the same direction with the general trend at one of the Fibo Ret level.
Entry zone which quite popular are 38.2%, 50%, and 61.8% level.
4. Probability of success will increased if price rejection occurs at the confluence of Support and Resistance levels.
ie. confluence of one Fibo Ret level with Support / Resistance area, Trendline, or Chart Pattern.
The point is, more confluences are taking places, probability of success for price rejection at Fibo Ret level is higher.
Few Examples:
Example 1 - 3 for Downtrend case (MA200 sloping down)
Example 4 - 5 for Uptrend case (MA200 sloping up)
1. (Normal Retracement) Price reversed to the opposite direction of the trend and rejected down from around Fibo Ret 50%.
The downtrend continuation after price rejection tend to be normal and not too deep.
2. (Higher Probability Retracement) Price reversed to the opposite direction of the trend and rejected down from the confluence of 2 resistance:
Fibo Ret 23.6% and Resistance Area 110.648-110.771.
The downtrend continuation after price rejection tend to be quite deep.
3. (Highest Probability Retracement) Price reversed to the opposite direction of the trend and rejected down from the confluence of 3 resistance:
Fibo Ret 61.8%, Major Down Trendline (diagonal red line), and Resistance Area 110.275-110.346.
The downtrend continuation after price rejection tend to be very deep.
4. (Higher Probability Retracement) Price reversed to the opposite direction of the trend and rejected up from the confluence of 2 support:
Fibo Ret 38.2% and Support Area 110.648-110.771.
The uptrend continuation after price rejection tend to be quite high.
5. (Normal Retracement) Price reversed to the opposite direction of the trend and rejected up from around Fibo Ret 61.8%.
The uptrend continuation after price rejection tend to be normal and not too high.
Happy Trading...
Couple of scenarios for next weekI don´t like waiting until the market provides me with a 100% copy of the perfect backtested super precise entry set up. Trading is not like fast food chain restaurant food, yu cannot always expect the same thing. While there is nothing new under the sun, price action and techncial reading of this price movement is more or less accurate.
The more languages you understand the better your understanding of the overall human culture. If this makes sense?
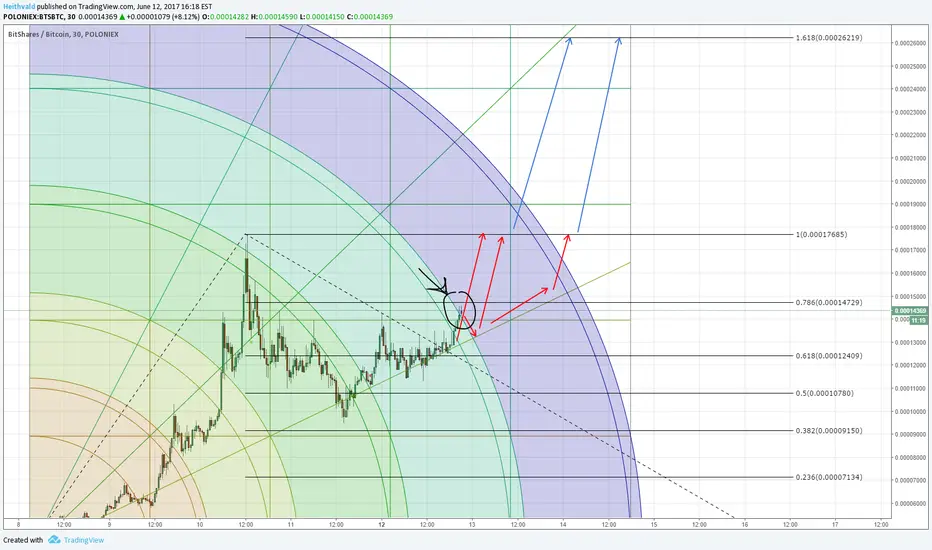
BTC/BTC updateAs i said in previous post, it should go higher now. The price broke 4th arc and now we should go for 17k+ for the first target. 2nd target is 26k. This is for the optimictic way.
AUDUSD - CLUSTER OF PATTERNS (SHORT)I have loved trading Aussie Recently , here is an example why , remember to keep your risk small and this will be a good trade win or loose
GBPUSD - BULLISH BUTTERFLY Hey Traders , here we see how the market has printed us a Butterfly pattern, this indicates a great buy setup and would be a good trade win or loose , risk small

HIGH probability signal on Lorbeer pattern => 26% potentialFirst target with a +60% chance of profit on a 382 retracement, of the total size of the pattern which provides a 9.5% profit
If price comes back to the signal level another 50% chance of profit on a secondary target provides 16%
!!! My tip: Statisitcs show that if price retraces right away to a 50% then it will most probably continue to higher highs (vice versa if D was a low)

AUDUSD - BEARISH CRAB PATTERN (SELL)Hey Traders , here we have an opportunity to get short on the aussie dollar , if you take this trade remember only risk a small percentage of your account based on your risk management strategy

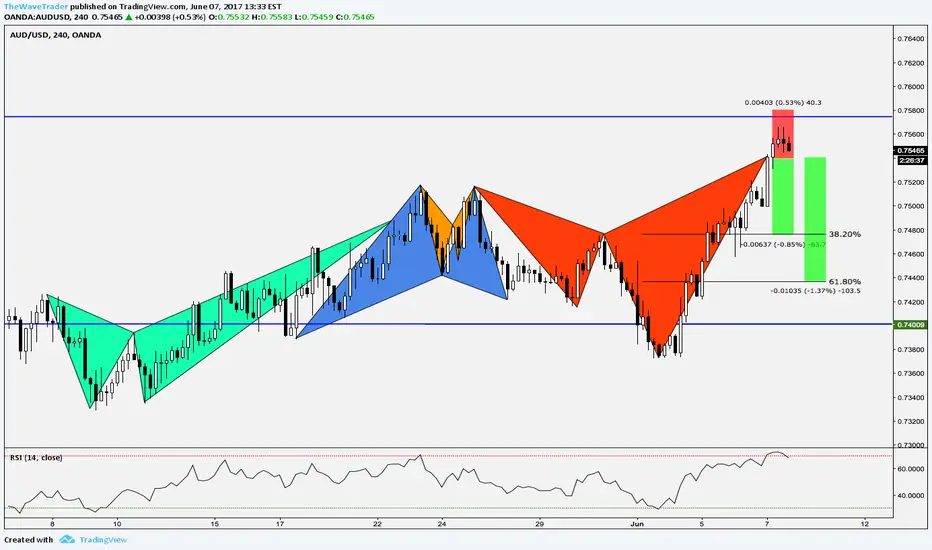
Advanced Pattern & Elliot Wave confluence +300 Pips OpportunityNice high probability , multi argument short opportunity on the daily. In line with a short trade on EUR/GBP that I opened yesterday.
Euro showed some strength since the first round of the #frenchelections2017 and the US dollar surely suffered after the #Trumpleaks. These fundamental facts pushed the EUR/USD with some significant momentum into an interesting resistance area. A combination of a completed 5 wave Elliot move + BatPattern + RSI overbought. Target on the 38.2% retracement should provide more or less 300 pips. If price comes back and double tops at entry a second chance is provided to target another 300 pips.
Those brave traders who are willing to sell into strength may receive some significant return if this strategy pays off. BatPattern, especially on EUR/USD have a high rate of success but remember, no trade is a sure game!

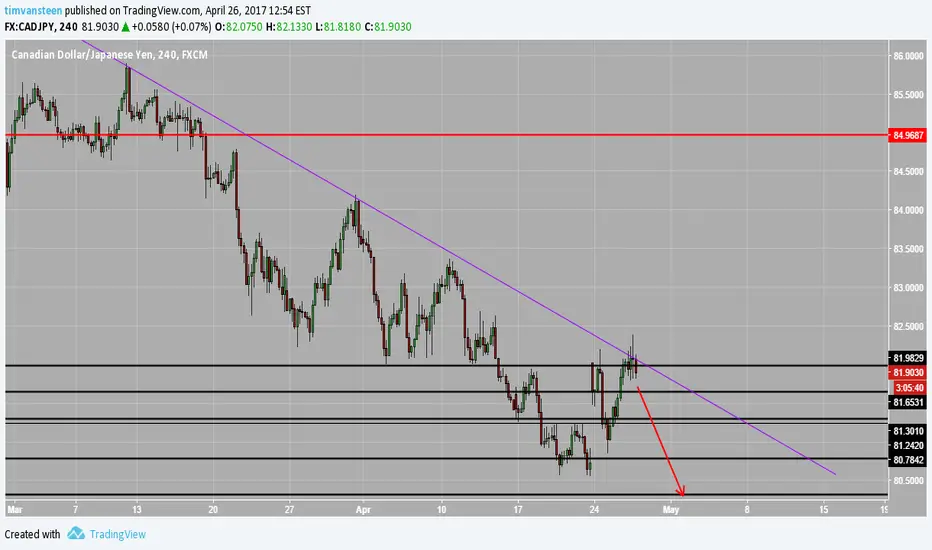
CADJPY trendline rejection 4h-1D chart rejecting a trendline.
Potential short trade when bearish candles occur.
USDJPY short trendline + key level rejectionIn history there is a strong move down, but this retracement is not strong enough at the moment. Looking for 2 possible setups:
1. Strong momentum up towards the trendline , good healthy rejection and break of the countertrend.
2. Strong momentum up towards the 110.05 level, which is a strong psychological level too. Want to see healthy rejection there and break the countertrend.
Option 2 would be the strongest setup
Will update this idea when one of those setups are formed

BEARISH CYPHER PATTERN FOR SWING TRADERS ON GBPUSDCame across a potential M240 Cypher Pattern completion @1.2515s
Place your Stops and targets according to YOUR Trading Plan!

ACM - $54B California Road Improvement - Aecom BenefitWe're a seeing a 4 month low for ACM. At this point, we've seen this stock rise and fall pretty regularly. If you're looking for a short term gain, I'd say this is a good option. I think it'll hit a 2 month high within these next 1-2 weeks.