August 3, Forex Outlook: High-Reward Setups You Need to See Now!Welcome back, traders!
In today’s video, we’ll be conducting a Forex Weekly Outlook, analyzing multiple currency pairs from a top-down perspective—starting from the higher timeframes and working our way down to the lower timeframes.
Pairs to focus on this Week:
EURUSD
USDCAD
EURGBP
EURJPY
GBPCHF
USDCHF
NZDCHF
EURNZD
Our focus will be on identifying high-probability price action scenarios using clear market structure, institutional order flow, and key confirmation levels. This detailed breakdown is designed to give you a strategic edge and help you navigate this week’s trading opportunities with confidence.
📊 What to Expect in This Video:
1. Higher timeframe trend analysis
2. Key zones of interest and potential setups
3. High-precision confirmations on lower timeframes
4. Institutional insight into where price is likely to go next
Stay tuned, take notes, and be sure to like, comment, and subscribe so you don’t miss future trading insights!
Have a great week ahead, God bless you!
The Architect 🏛️📉
Highreward

NZDCHF: Bearish Continuation from Re-Delivered Re-Balanced ArrayGreetings Traders,
In today’s analysis of NZDCHF, recent price action confirms the presence of bearish institutional order flow. As a result, we aim to align ourselves with this directional bias by identifying strategic selling opportunities.
Key Observations on H4:
Bearish Market Structure Shift: The H4 timeframe has recently confirmed a bearish shift in market structure, providing us with a clear framework to seek short setups in line with institutional momentum.
RDRB Resistance Zone: Price has retraced into a Re-Delivered Re-Balanced (RDRB) array—an area where prior institutional selling took place and has now been re-engaged. This region is expected to serve as resistance, offering a high-probability zone for confirmation entries to the downside.
Trading Plan:
Entry Strategy: Monitor lower timeframes (M15 and below) for bearish confirmation setups within the RDRB array.
Target Objective: The current draw on liquidity remains the liquidity pool residing at deeper discount levels, which aligns with our short bias.
For a detailed market walkthrough and in-depth execution zones, be sure to watch this week’s Forex Market Breakdown:
As always, stay disciplined, wait for clear confirmations, and manage your risk responsibly.
Kind regards,
The Architect 🏛️📉

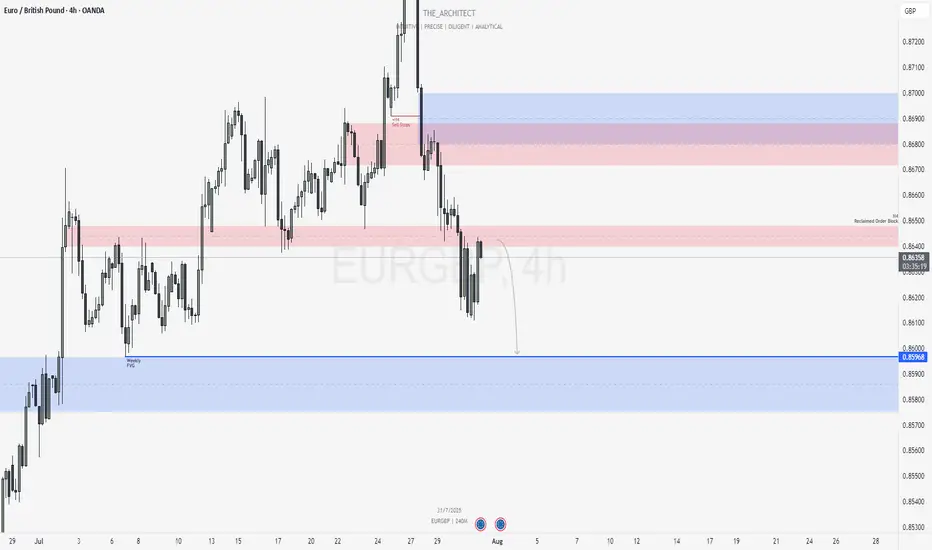
EURGBP: Bearish Continuation from Reclaimed Order Block!Greetings Traders,
In today’s analysis of EURGBP, we observe that institutional order flow on the H4 timeframe has recently shifted bearish. This provides us with a clear directional bias to look for shorting opportunities in line with the prevailing higher timeframe trend.
Higher Timeframe Context:
On the weekly timeframe, price action is currently drawing towards a Weekly Fair Value Gap (FVG). This bearish draw on liquidity confirms the macro-level bearish sentiment. With the recent bearish market structure shift (MSS) on the H4, we now have strong confluence between the weekly and intraday order flow, favoring continued downside.
Key Observations on H4:
Reclaimed Bearish Order Block: After shifting structure to the downside, price has retraced into a bearish reclaimed order block—a region previously marked by institutional selling. This return to the origin of prior sell-side imbalance offers institutions the opportunity to mitigate earlier positions and reinitiate shorts. The failure of price to break higher confirms bearish intent.
Confluence with Weekly Draw: The reclaimed order block aligns with the broader draw towards the weekly FVG, providing an optimal zone for bearish confirmation entries.
Trading Plan:
Entry Strategy: Look for lower timeframe confirmation entries within the H4 reclaimed order block.
Target: The short-term target remains the Weekly Fair Value Gap, supporting a discount-side delivery.
As always, remain disciplined in execution. Let the market confirm your bias before entering, and manage risk according to your rules.
For a detailed market walkthrough and in-depth execution zones, be sure to watch this week’s Forex Market Breakdown:
Kind Regards,
The Architect 🏛️📉
July 29, Forex Outlook : High-Reward Setups You Shouldn’t Miss!Welcome back, traders!
In today’s video, we’ll be conducting a Forex Weekly Outlook, analyzing multiple currency pairs from a top-down perspective—starting from the higher timeframes and working our way down to the lower timeframes.
Pairs to focus on this Week:
USDJPY
AUDJPY
CADJPY
EURGBP
GBPCHF
USDCHF
NZDCHF
EURNZD
Our focus will be on identifying high-probability price action scenarios using clear market structure, institutional order flow, and key confirmation levels. This detailed breakdown is designed to give you a strategic edge and help you navigate this week’s trading opportunities with confidence.
📊 What to Expect in This Video:
1. Higher timeframe trend analysis
2. Key zones of interest and potential setups
3. High-precision confirmations on lower timeframes
4. Institutional insight into where price is likely to go next
Stay tuned, take notes, and be sure to like, comment, and subscribe so you don’t miss future trading insights!
Have a great week ahead, God bless you!
The Architect 🏛️📉

Weekly Trade Outlook | Lessons in Discipline, Risk & PerspectiveGreetings Traders,
In today’s video, I’ll be walking you through my end-of-week trade outlook, breaking down every setup I took throughout the week. This session is designed to offer insight into how I apply risk management, trading rules, and maintain psychological discipline in real-time market conditions.
Whether you're struggling with emotional trading, inconsistency, or overtrading, this video will give you a fresh perspective on how structure, faith, and discipline can shape a sustainable trading approach.
Remember: respect your trading rules, pray over them daily, and ask God for the strength to remain disciplined—so you don’t become your own worst enemy in the market.
Let’s grow together,
The Architect 🏛️📈

AUDJPY: Bullish Structure Shift Signals Institutional Buy ZoneGreetings Traders,
In today’s analysis of AUDJPY, we observe a recent bullish market structure shift (MSS), signaling potential for continued upward movement. With this in mind, we aim to capitalize on buying opportunities at key institutional points of interest to target higher premium prices.
Higher Timeframe Context:
The weekly timeframe maintains a clear bullish narrative. This long-term bias is now supported by a bullish MSS on the H4 timeframe, offering strong confluence and alignment across both macro and intermediate structures. This increases our confidence in expecting further bullish continuation.
Key Observations on H4:
Weekly Fair Value Gap (FVG) Support: Price recently pulled back into a weekly FVG and has rebalanced that inefficiency. This reaction aligns with the H4 MSS, reinforcing the weekly FVG as a strong institutional support zone.
Reclaimed Bullish Order Block: After the MSS, price retraced into a bullish reclaimed order block—an area where previous institutional positioning occurred. Since price has now reclaimed this level, it becomes a high-probability zone for renewed buying interest in the direction of the dominant trend.
Lower Timeframe Confirmation: This reclaimed order block will serve as our primary zone of interest to seek confirmations on the lower timeframes for precise entries.
Trading Plan:
Entry Strategy: Wait for bullish confirmation within the reclaimed H4 order block zone before entering long positions.
Target: The primary objective is the H4 liquidity pool situated at premium prices, which the market is likely to be drawn toward.
For a detailed market walkthrough and in-depth execution zones, be sure to watch this week’s Forex Market Breakdown:
As always, execute with discipline and align your trade management with your overall plan.
Kind Regards,
The Architect 🏛️📈

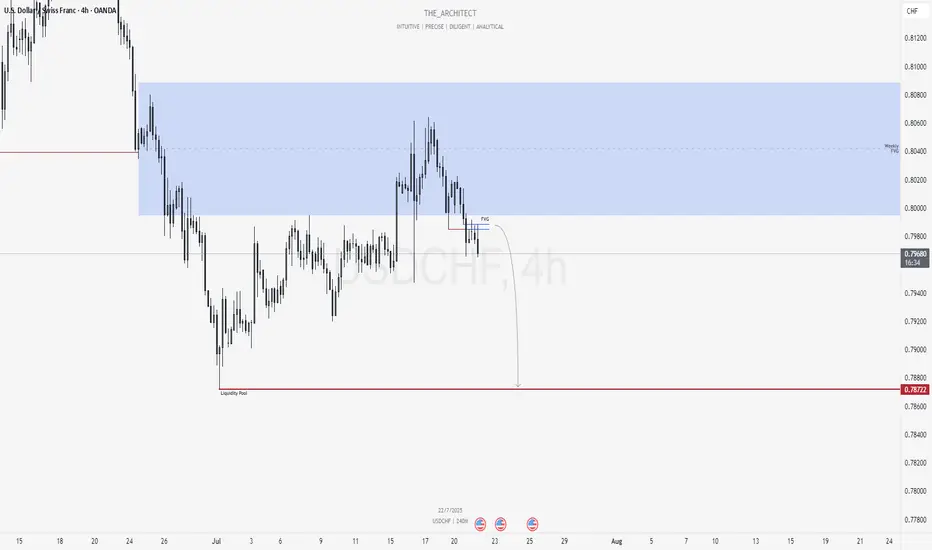
USDCHF: Bearish Shift Offers Premium Selling ZonesGreetings Traders,
At present, USDCHF is exhibiting a clear shift in institutional order flow toward the bearish side. In response, we aim to align with this directional bias by identifying high-probability selling opportunities within premium price zones.
Higher Timeframe Context:
The weekly timeframe remains bearish, offering a macro-level bias. Price recently pulled back into the weekly Fair Value Gap (FVG), a key internal range area. With this retracement complete, we now expect the market to begin its delivery toward external liquidity pools located in discounted price zones.
Key Observations on H4:
Market Structure Shift (MSS): USDCHF has recently presented a bearish MSS on the H4, confirming a change in the internal structure and further validating the bearish narrative.
H4 Fair Value Gap Rejection: Following the MSS, price retraced into a newly formed H4 FVG. This area now serves as a short-term institutional resistance zone.
Sell Opportunity Zone: This H4 FVG provides a valid zone to seek confirmation-based entries on the lower timeframes (e.g., M15), with the objective of targeting downside liquidity.
Trading Plan:
Entry Strategy: Look for short setups via confirmation on the M15 timeframe within the current H4 FVG zone.
Targets: Focus on internal liquidity pools within discounted price levels, with the broader objective being the external liquidity resting beneath recent swing lows.
For a detailed market walkthrough and in-depth execution zones, be sure to watch this week’s Forex Market Breakdown:
Kind Regards,
The Architect 🏛️📉
BTC/USDT | Trade Analysisbitcoin trade analysis.
expecting saturday , sunday bearish candle.
maybe they make 1 more higher high which in on around 107500 but less chance of it.
that's why i see short on around 104500.
currently i am expecting 9800 but lets see whts happen.
i don't on rely on technical i see the whole over all world market before making any trade.
but thats not a financial advice take trade on your own risk!

AGAIN WITH EURNZD, IS THIS A REVERSAL OR A PULL BACK?EURNZD is currently making a channel move on the 1h which indicates a pull back to previous weekly close. now we are looking for price reaction at 1.79500, a double top forming at this zone will indicate the coming in sellers to drive the price lower. this trade can make as much as 1:7. LOOKING for price to for an engulfing candle on the 1h and 4h or a pin bar candle on the 1h and 4h from this price level. 1.79500 is a key levle.

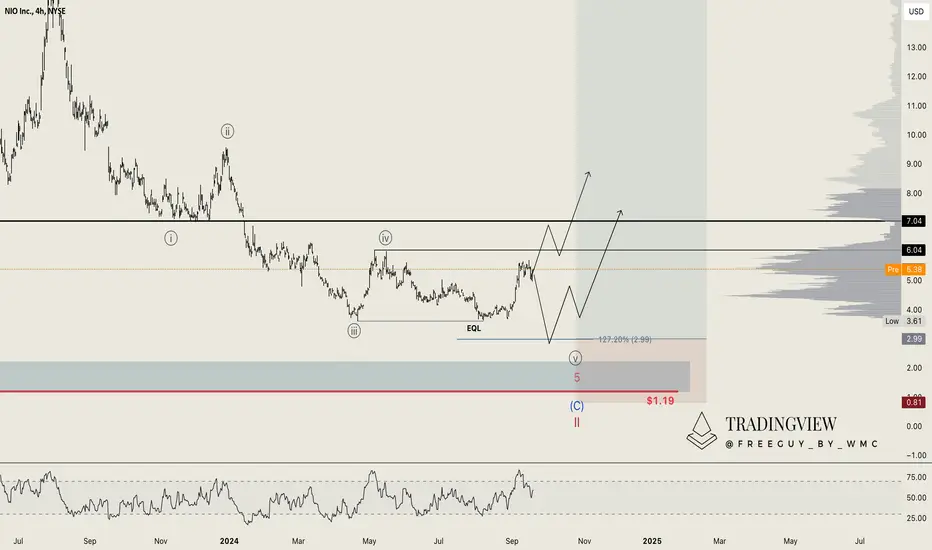
NIO (NIO): 55% Increase but Bearish Trends Still LoomA while back, we analyzed NIO, and recently, we’ve seen a considerable 55% increase in the stock price. However, despite this rise, nothing truly convinces us that this bearish trend has ended or that a sustainable upward movement is underway.
The critical factor here is that none of the key levels that need to be breached for a trend reversal have been crossed. Specifically, we’re looking at the current Wave ((iv)) level around $6.04. If this level isn’t breached, it’s likely that we could see further declines, possibly dipping into the $2.99 range—or even lower, potentially as far as $1. It may seem dramatic, but considering NIO has already dropped up to 62% since January, repeating such a decline isn’t out of the question.
In conclusion, the market remains quite weak, and we’re still cautious about the possibility of more significant setbacks. Always remember, it’s okay to stay on the sidelines and not invest in everything that catches your eye. 🤝
WIPRO - The IT sector pick with Minimal Downside Risk!Overview:
- Entry Point: Current Market Price (CMP) 475
- Target: Around All-Time High (ATH) 740
- Risk-Reward Ratio: With a downside risk of just 10% and aiming for a 50% upside, this trade offers an impressive 1:5 RR ratio.
Aiming for a significant upside with well-managed risk. Let's see if we can capture this opportunity right!
Stay tuned for updates and trade safely! Happy trading!
Disclaimer: This is NOT a buy/sell recomendation. This post is meant for learning purposes only. Please, do you due diligence before investing.
Thanks & Regards,
Anubrata Ray

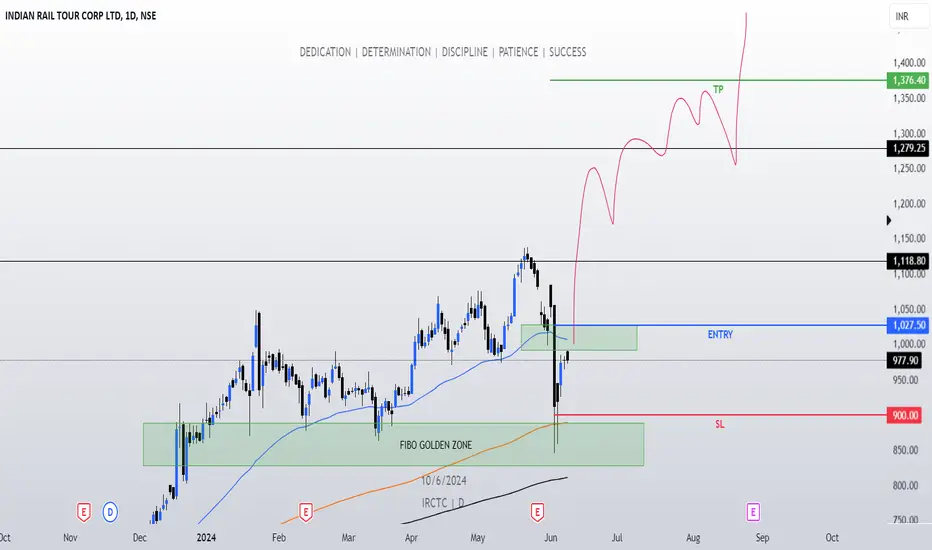
IRCTC - Ready for a HUGE move? Aiming around 80%+ gains! IRCTC is set to double once it clears key resistance levels!
---
Weekly TF View:
Here's the plan:
- Critical Level: Watch for a daily candle close above ₹1000. This signals the first entry point around ₹1027.
- All-Time High Alert: If the weekly candle closes above ₹1300, prepare for a potential Marubozu candle, indicating strong bullish momentum. This will be our second entry point.
- Strategy: Entering before the breakout to catch the bottom. Remember, risk management is crucial. The market is supreme; we adapt.
- Price is bouncing from the important fibonacci support area. Showcasts buyers are strong!
Let’s wait and watch the show unfold!
---
Stay tuned for updates as IRCTC approaches these critical levels. Happy trading!
Disclaimer: This is NOT a buy/sell recomendation. This post is meant for learning purposes only. Please, do you due diligence before investing.
Thanks & Regards,
Anubrata Ray
NIO (NIO): High Risk, High Reward - do-or-die!NIO, a stock we've previously analyzed and profited from, remains highly volatile and is currently trending downwards. From its all-time high of approximately $67, it has plummeted to $5.21. This drastic decline occurred over just a bit more than three years, which is relatively short in the stock market.
Several factors contribute to this volatility. Firstly, the automotive sector is inherently volatile. Additionally, the electric vehicle (EV) segment has faced political challenges over the past few years. NIO, being a Chinese company, has also been affected by EU subsidies for electric vehicles, adding to the stock's difficulties.
Despite these challenges, we consider NIO a compelling investment from both a fundamental and technical perspective. Currently, NIO is holding the High-Volume-Node Point-of-Control on the New York Stock Exchange, suggesting that a bottom may be forming. This level is critical to watch as it could indicate potential stabilization and a reversal point for the stock.
Short-Term Analysis
Examining the 4-hour chart for NIO, we observe a low-volume node between $6.32 and $7. Whenever the price entered this zone, it quickly moved through it, indicating the nearest possible resistance levels. Thus, the levels of $6.32 and $7.04 are particularly interesting.
Around $4.12, the Point-of-Control on the 3-day chart holds, but we could see a further decline towards the $3 mark. We are considering multiple entry points, employing a dollar-cost averaging strategy down towards the all-time low of $1.19.
Strategy
For NIO, this seems like a do-or-die situation. The potential upside is significant, with gains of nearly 400% if the price moves from $3 to Wave 4. We plan to place multiple entries and dollar-cost average downwards.
However, if the price falls below $1.20, it would become unsustainable for NIO. While the potential upside is vast, it's important to recognize the risk of the stock continuing to decline towards zero.
Given the current volatility, we find an entry before $3 too risky and volatile, so we are holding off on investment until the price stabilizes at more attractive levels.

emsltd buy swing trade
emsltd buy for swing trade at 430 buy average at 415 sl 408
5%risk tgt 5%10%15%

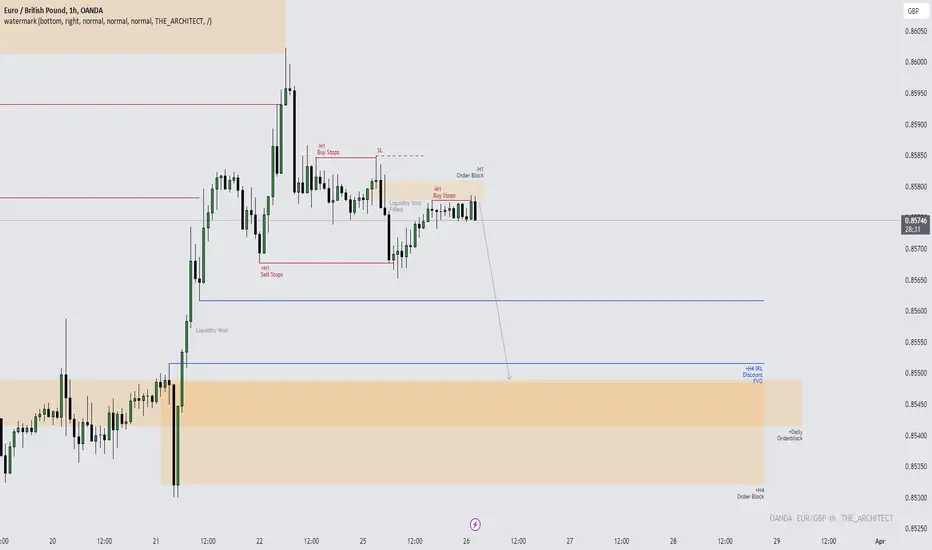
EURGBP: Exploring a Potential Sell OpportunityCurrently, EURGBP is exhibiting bearish institutional order flow , leading me to anticipate a continuation from the current H1 Bearish Order Block. The objective is for price to reach the Daily Bullish Order Block, our current Draw On Liquidity. This sell opportunity holds a high probability due to the presence of low resistance liquidity towards the downside, facilitating smooth movement through inefficiencies such as Liquidity Voids and Fair Value Gaps towards the Order Block.
I have considered taking a Risk Entry Trade off the H1 Order Block, with the Stop Loss positioned at the high of the Order Block.
Kind Regards,
The_Architect
High Probability Trading Environments Part 2: Liquidity RunsIn this educational video, we'll explore the distinction between High Resistance Liquidity Runs and Low Resistance Liquidity Runs, crucial for identifying High Probability Trading Environments. Our analysis will focus on NAS100USD, providing insights into potential trading opportunities for the week ahead.
By understanding these concepts, you'll gain valuable insights into positioning yourself effectively in the market. Be sure to watch to gain a comprehensive understanding of the key confluences that contribute to successful trading strategies.
Understanding Trend Analysis, SMT and ICT Concepts
Mastering High Probability Trading Environments Part 1
Kind Regards,
The_Architect

PEPSICO - Low Risk High Reward - BullishNASDAQ:PEP
-Has been on a bull run since 1981
-Every while does a 10-20% correction,
(and up to a 40% correction in case of a major economic crisis)
-Always goes back up to a new all-time-high...always
-Is now done about 20% from all-time-high
-Prices now are the same as it was in Nov 2021
-The last time it did such a correction was in 2020
I would say it is a no-brainer for those who are looking for low-risk trades, I would go in with no stop loss even since it will find its way back up.
*Not Financial Advice*

EURusd long 0 pip dd wizardry 0 pip DD
this is real magic
the real wizard of forex
predicted before hand previous idea
GBPJPY Bearish reversal possible.
Doji candlestick pattern visible on the 4hr chart. Bearish liquidity sweep & loss of momentum. It is very likely that it is enough to clear the stop-losses of early entries but not far enough to hit orders, thus, we manage in the middle.
USDJPY Head And Sholders Idea On Daily Chart For 10X Return!!!I have a 10x return short trade idea. Can you wating 6 mounth for this? :)

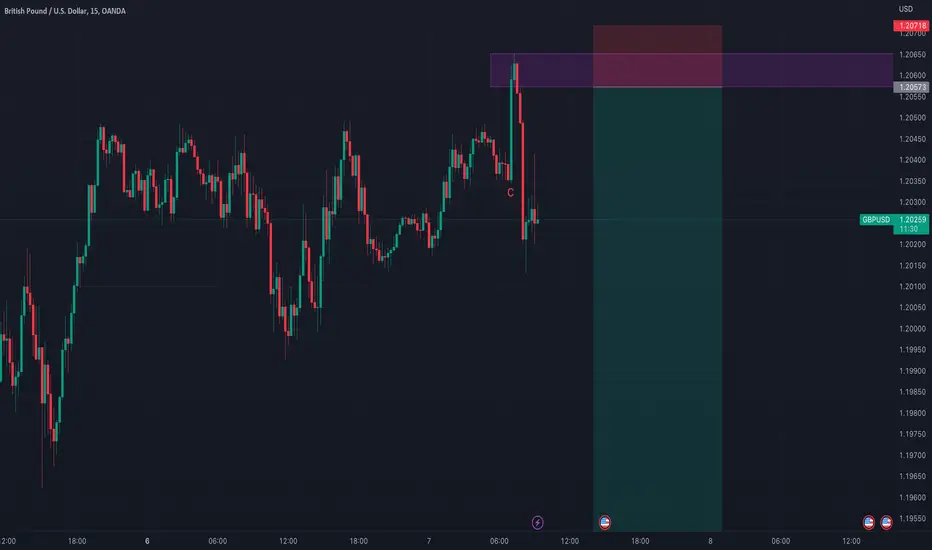
GPBUSD potential setupHere we have a textbook example of consolidation aka sideways trending. This is made clear by the triangle pattern before price broke out this morning. Following that we've had the break of a swing low (by that I mean a candle that reached/wicked lower than it's neighbours on either side).
The spike that broke out of the sideways trend to the upside triggered institutional buy stops, trapping liquidity in bullish positions. I suspect that after breaking market structure (point c) the market is now ready to drop. You can expect a return the candle that started the move.
Triangle Break-Out in 1 DTF//HGINFRA+++The Triangle is broken with good candle and also sustained in today's session.
++The Supports(+) and Resistances(-) are also perfectly respected.
+Lets follow the Price Action in keeping the SL(Under 14 Dec candle) and Target R:R should be (2.5)> .
Happy #Christmas Trading Mates!

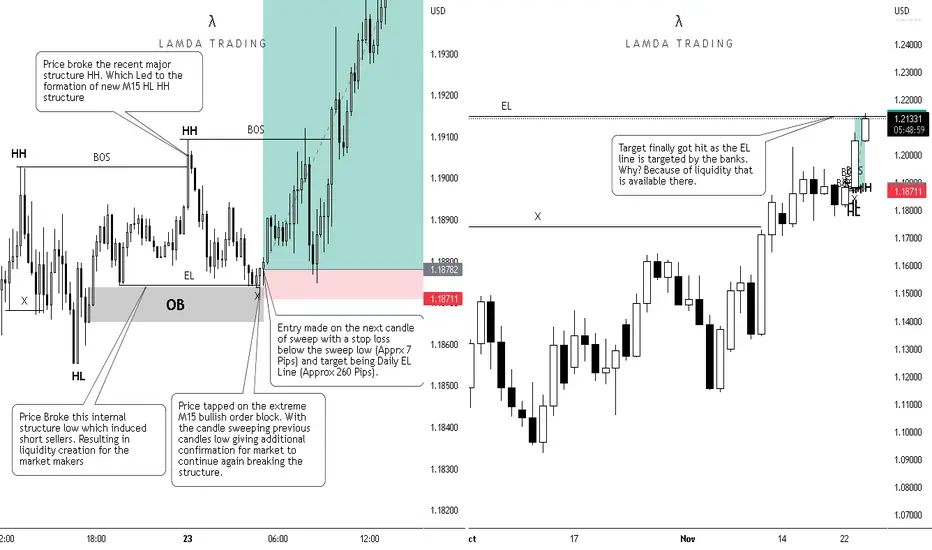
GBP USD 1:35 RR Trade Our team and our private mentor students at Lamda captured this beautiful day trade on the GBPUSD with a 1:35 RR with lowest risk and high reward. As price created a new bullish structure, our eye was on the extreme M15 orderblock that we were looking to go in at. Price took the EL on M15 which induced all the retailers as well as dumb SMC to short thus resulting in liquidity generation. Market then tapped on extreme unmitigated orderblock and our entry was defined after confirmation of candle that were formed ahead. Our target was the daily EL since the market on daily was still bearish and EL act as a liquidity point for the interbanks where it could potentially look for shift in the momentum direction.
In depth Analysis of this trade will be uploaded on YT soon. Our team is working on that. Till that time...
Happy Trading!!!
-Lamda