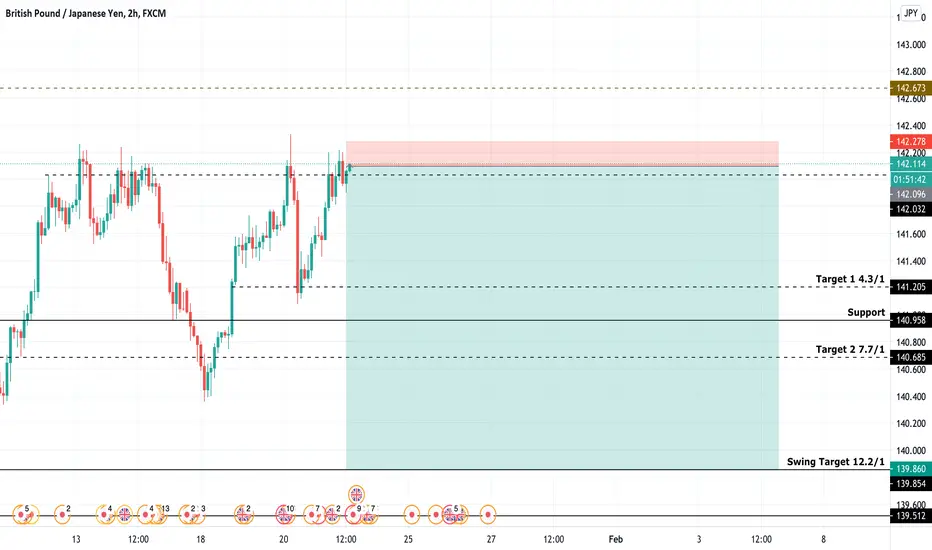
GBPJPY Short 12.2/1The Pound had a decent 2020 year, outperforming the Dollar despite uncertainty of Brexit and large relief payments made to their citizens. As it approaches
it's 2020 highs, a correction makes sense. This short is a play on break of structure which I expect would cause a lower swing.
Highreward
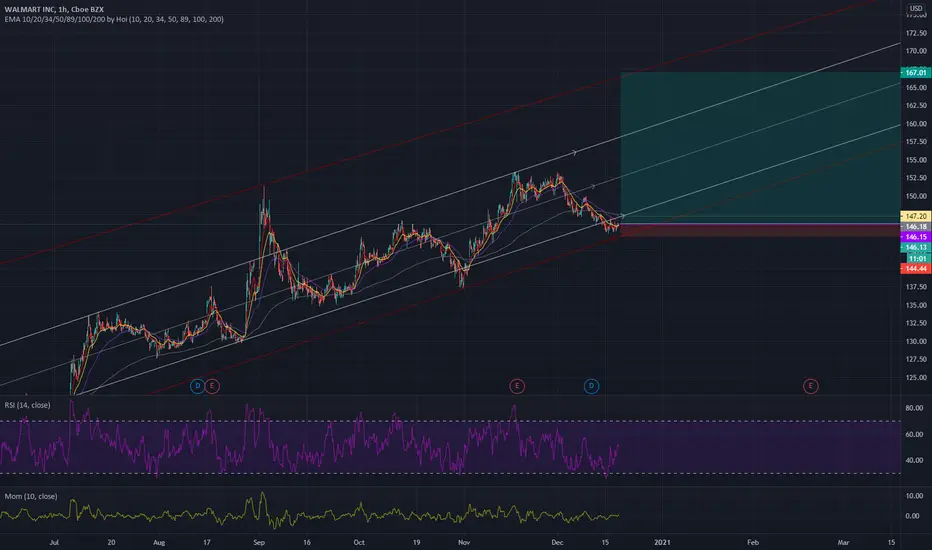
Good risk to reward ratio to buy Here is a well defined risk to reward ratio, Walmart has been doing great with holding the trendline and the upside is healthy.
with more covid-cases I can see their online sales getting another boost.
So what do you think? is it a good set up for entry ?


EURUSD - Bullish Flag Pattern - Trend Continuation + MTFAHi Traders!
The market is in an Uptrend.
Let's begin our Multiple-Timeframe-Analysis with the Daily:
The market is clearly in a strong Uptrend.
We here have an ascending Parallel Channel.
The price is also respecting those other S&R Levels.
Great, here is the H4-Timeframe:
The market was moving in a consolidation.
Then it came back and is now retesting this break.
Here comes the important part!
Now we have to consider the behavior and the price action of the market during the Retest.
What is the market telling us?
For Example:
The market is breaking down and closes.
Then it comes back and closes even above the opening price of the previos candle.
(Bullish Engulfing Pattern)
This is a sign of Bullish Power, even it did break down at first.
Or what about that:
The market is making lower highs and comes to the Support.
You realizing that this could be a descending Triangle.
This is clear bearish Power, because the Traders are willing to sell at lower and lower prices.
Is everything understandable so far?
If not, write a comment below!
Finally, here is the Entry Timeframe:
Firstly we have drawn the Fibonacci Retracement Tool.
It was falling until the Level between the 50% and the 61.8% Retracement.
Then we drawed the channel from the retracement move.
We realized that this could be the Bullish Flag Pattern.
Even we have a save SL which is far away, the RTR-ration is 1 to 4!
And we're trading WITH the trend.
We recommend to be careful at the Resistance Level.
Thanks and successful Trading :)!

#Swing #tradeIdea Long over 53. Tight stops. High R/R SetupWith markets retracing watch for a good Dip buy entry tmr!

CADCHF Short - 1:7 RRRNot a bad cadchf short with only a 15 pip stop loss.
Let's see how this one runs.
rejected the 0.786 Fib and created a strong area of resistance.

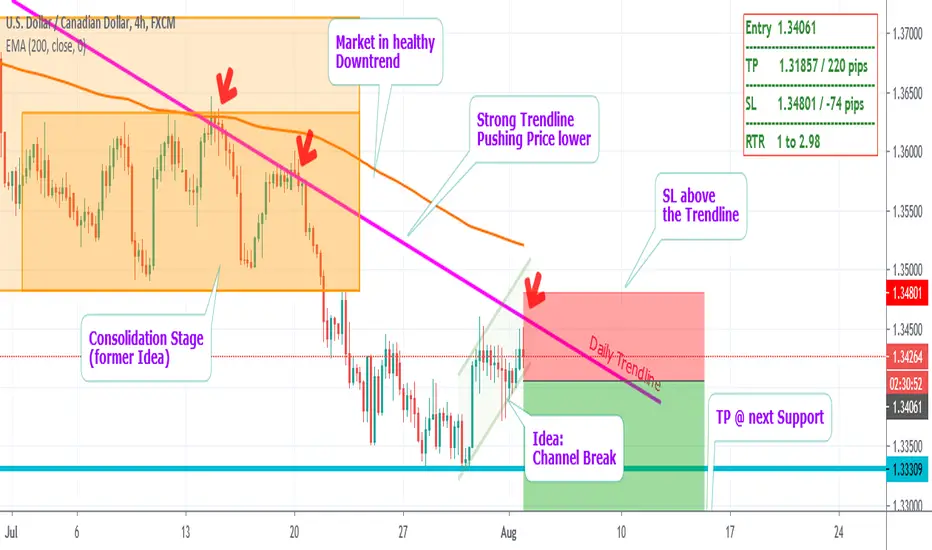
USDCAD - Strong Trend Continuation - Trendline Bounce & BreakHi Traders!
The market is in a Downtrend.
As always, let's look at the Daily Timeframe first:
So, we can see the market is strongly respecting the Daily Trendline.
We can identify the Trending Moves and the Consolidation Stages.
Pay attention to that the market is now near the Trendline again.
Now we switch to the main (H4) Timeframe.
The market is falling down after the consolidation.
It has fallen until the next Support and bounced off fastly.
Now it is in a Retracement move of the overall Trend.
It is here in a potential Channel (still need an upper touch to finally confirm it).
The Trading Idea is: Sell the bearish Breakout of the Channel / lower Trendline!
Here are some additional confirmations:
Market in an overall Downtrend
Market at Daily Trendline
200 Exponential Moving Average showing bearish Power
We recommend to trade the Breakout with a confirmation.
Thanks and successful Trading :)!
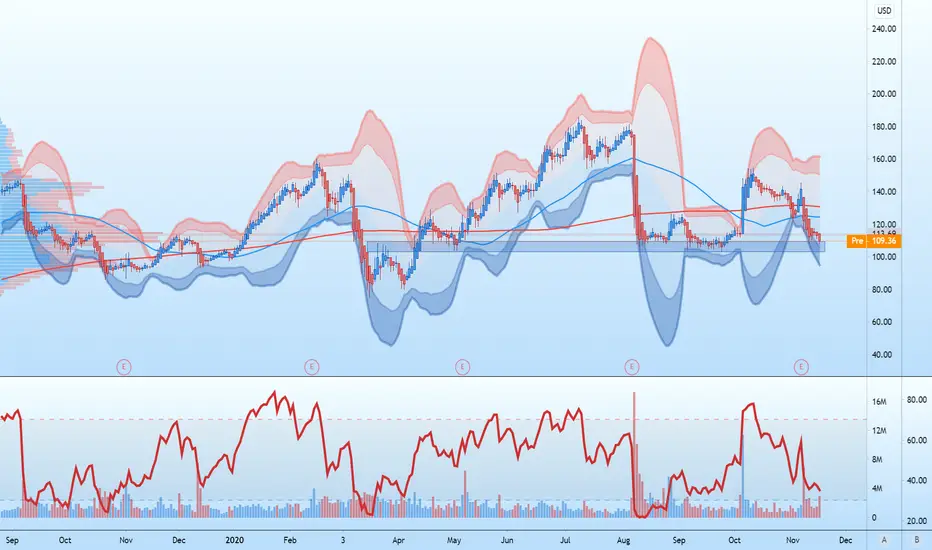
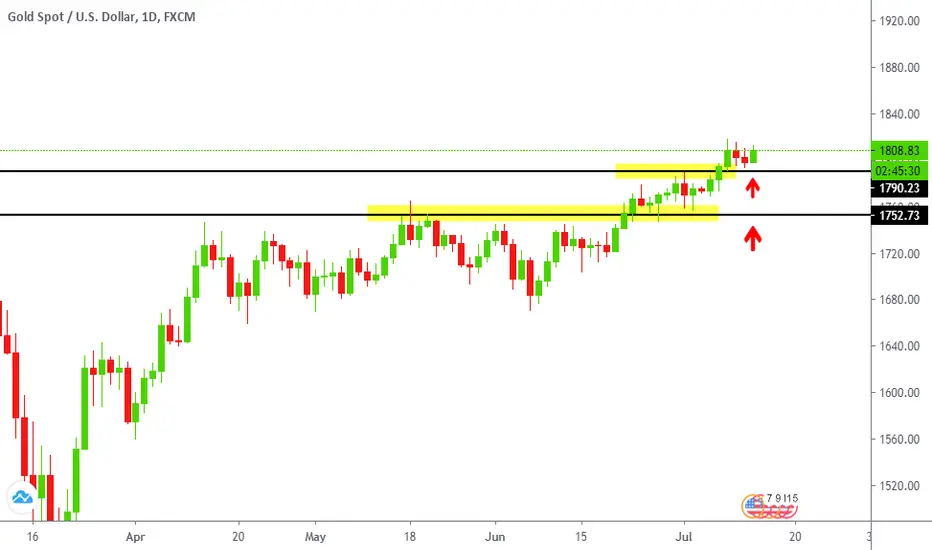
Multi-year Resistance BrokenThe multi-year resistance level we have been discussing in this market in recent times has now been broken with price making a solid move higher.
There looks to be a large amount of space for price to move higher into, so the resistance level price has just broken out of looks to be crucial.
If this old resistance can hold as a new support price flip level it could be the key for price making a new leg higher. It could also be a solid level to watch for bullish price action clues.
Thanks for your like and support
Possible Retest & Long Position - GBPCHF - 7.68% R:R Hi All! Hope you're keeping well and having a great weekend! Just wanted to share a personal analysis I've made on GBPCHF! Please feel free to comment below any questions you may have!
With GBPCHF, I would personally like to see some movement to the downside towards the marked 4hr structure, to retest it as a support for price then to move back and follow the price trend to the upside. As you may not know, the Bank of England has a speech tomorrow which will greatly affect the pound - if the speech is 'hawkish' then we could see some strength for GBP which will support this long position.
You may notice that the fib retracement isn't on the highest wick, which is something I've personally done because I feel that maybe the last two candles on Friday could be very sketchy to work off, especially towards the market close. By doing this though it's lining up perfectly with the structure, and would be nice to get a long from that position. We're also above the 40EMA which I personally work with on minor pairs which will support this - also this could count towards a touch on the ascending trendline (subjective) which could also show support.
I have chosen to have my stoploss at 20pips + 3pips for spreads, and I will be risking 1% of my capital for this trade.
Confluences:
Trendline
Structure
40EMA
Fib Retracement
Conformation
"Pending" 😉
Obviously please do your own analysis, so please don't take this as gospel and please ensure that you use the correct risk management for this trade.
Let me know your guys thoughts!
Cheers
Daniel
Instagram: @DanielJamesFX
Twitter: @DanielJamesFX

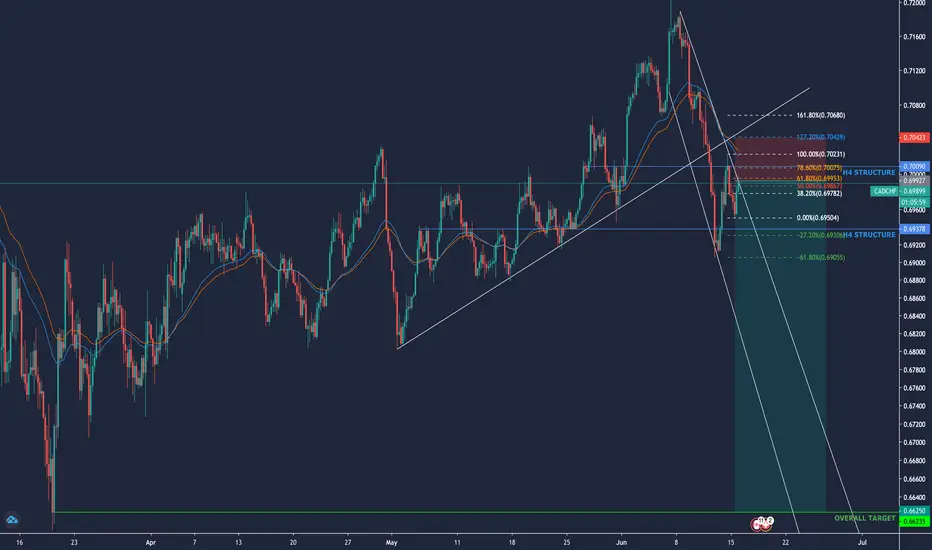
HUGE 371pip short on CADCHFToday I entered a huge huge 371pip short on CADCHF - with the reward risk ratio of 7.41.
I'm looking for a break of the marked 4H structure and for it to retest and continue down to the desired target of 0.66215. I know a lot of people will say this is ambitious, and I agree - but I from an analysis that I'm following and have checked out. I feel that this is a great opportunity for a longterm short.
Something I'll be keeping in mind would be the news coming from Canada on Wednesday - especially the CPI report which will certainly have some High Impact on the Pair.
Please let me know your guys thoughts!
*Please note this is my own personal analysis, and I strongly recommend that you carry out your own analysis before executing a trade. Please do not take this analysis as gospel.*
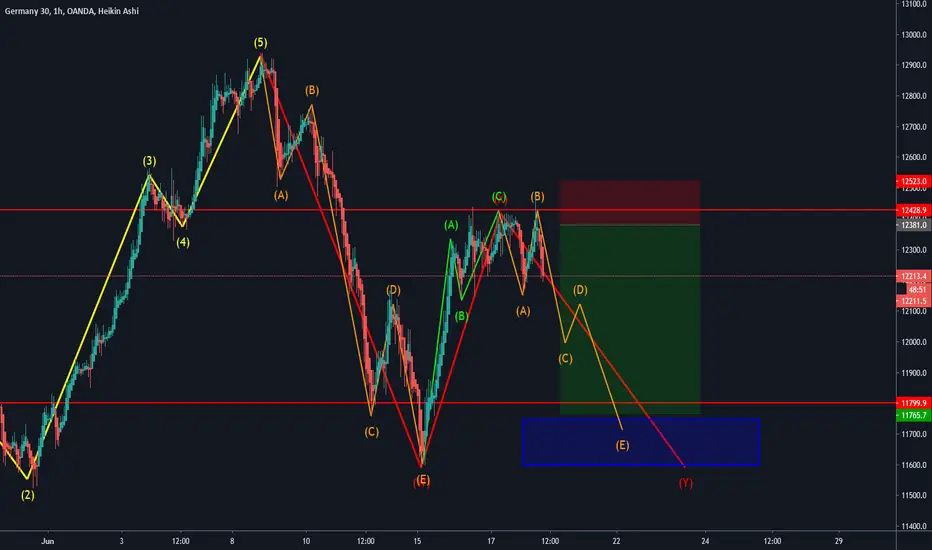
DAX Elliot correction wave - 5:3:5 zig zagHello world,
another idea regarding DAX / Germany 30. Working out quite alright already.
Unfortunately forgot to press "publish". Still a valid guess though.

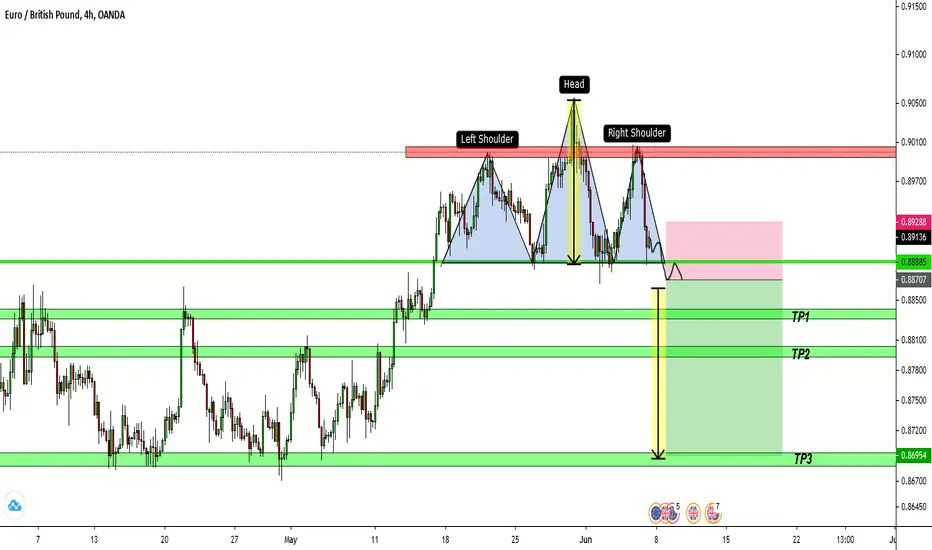
EURGBP-Head & Shoulder Short Opportunity175 pip potential trade on OANDA:EURGBP .
Enter short on neckline break.
XAUUSD => Long trade Setup Great Opportunity !we appreciate your coming for taking the time to read our idea please do not forget to hit the like it's our only reward🙌
If one of our idea can help one other person , then to me, that is success. Strive to be authentic, not perfect. Share your Ideas in Comments – that’s what enables Traders to connect. And know that there is always someone listening –
=>
if You Need Trading guide, any Notes, any information about trading Feel free to message us through Trading view.
Check today analysis
___________________________________________________________________________
Before trading our ideas make your own analysis and research properly.
Forex Trading are leveraged product & can result in the loss of your entire capital.
Please ensure you fully understand the Risks involved.
>>
I’d like to close with a big thank you. Thank you for reading and for helping us to grow. But most of all thank you for being a part of our journey…
With love,
Trading Fleet Team

Scalping Opportunity --SHORT on price rejectionHi Traders,
Hope you are doing good!!
I am going to share with you the scalping opportunity. Less risk, high rewards based on your profile.
You can trade as a normal strategy as well.
Please put a tight stop loss of 5 pips after opening the position. Make sure price rejection wick is not more than 2 pips from open position.
Target: 15 pips.

USOIL big wave coming, huge volatility.Place your bets, money to earn or lose right here. Good luck everyone.

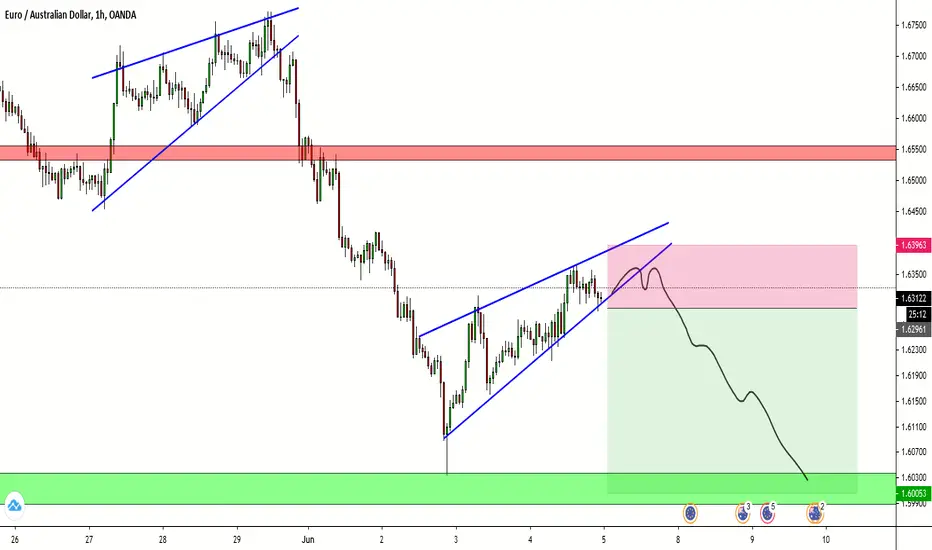
USDCAD - HIGH REWARD Trading Idea - EASY Breakout SetupHi Traders!
The market is in a downtrend.
As you can see the market is in a descending triangle.
That means, that the market is making lower highs, but no lower lows.
The effect of this pattern is this:
The sellers keep selling at the trendline.
The buyers are buying at the support, but they're making lower and lower profit.
What does that mean?
There aren't any buyers left who can push the price higher.
The SL of the buyers are directly under the support.
CONCLUSION :
If the Breakout occurs:
- The Sellers will sell because of the trendline
- The SL of the Buyers will hit and that'll push the price lower
- The Breakout traders are getting in
Never forget: The more squeezed the market is, the more explosive the breakout will be.
Thanks and good luck :)!

AUDUSD FORECAST 2 MARCH 2020 @CacbyDovish USD News
Hawkish AUD News
Checkout here ----> www.forexfactory.com

My analysis was spot on.Look at mye previous analysis of Akorn, this went exactly as forecasted. Hope some of you rode the 12% move up today.
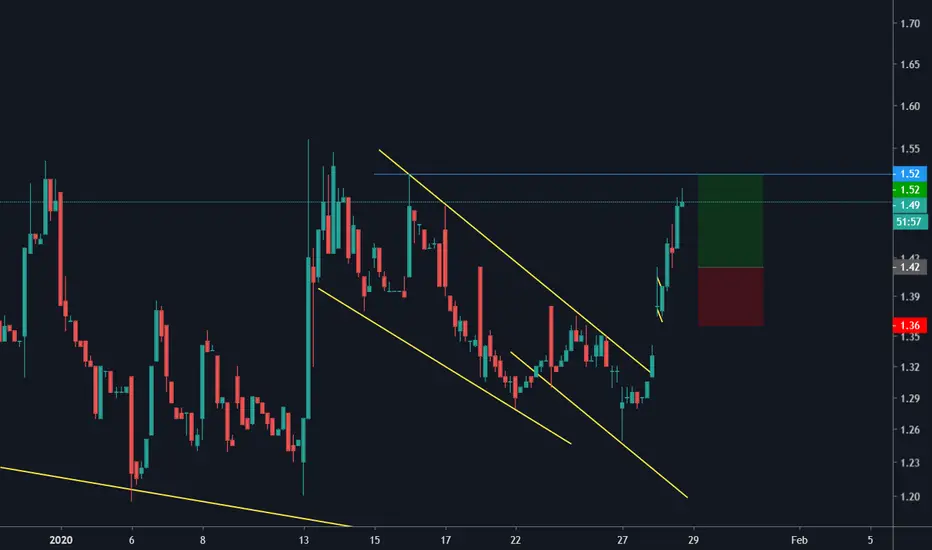
Revised analysis of AKORN inc. Please like and comment your opinion, so we all can learn.
I have now drawn on the new valid trend lines and bull falg structure. Price is currently hovering just below the upper trend channel of the "to be" Bull Flag. When price breaks, possibly on monday. We may see large impulsive moves up. High risk high reward stock atm.
