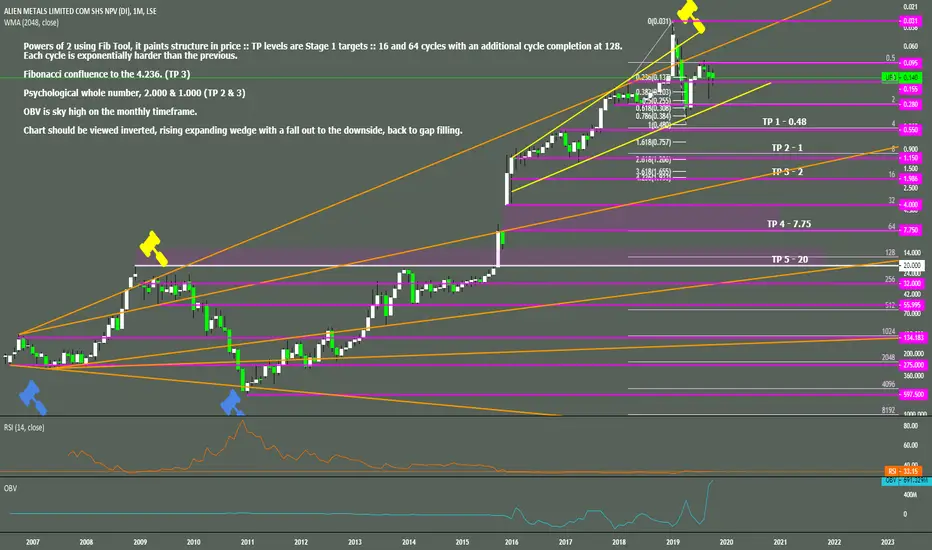
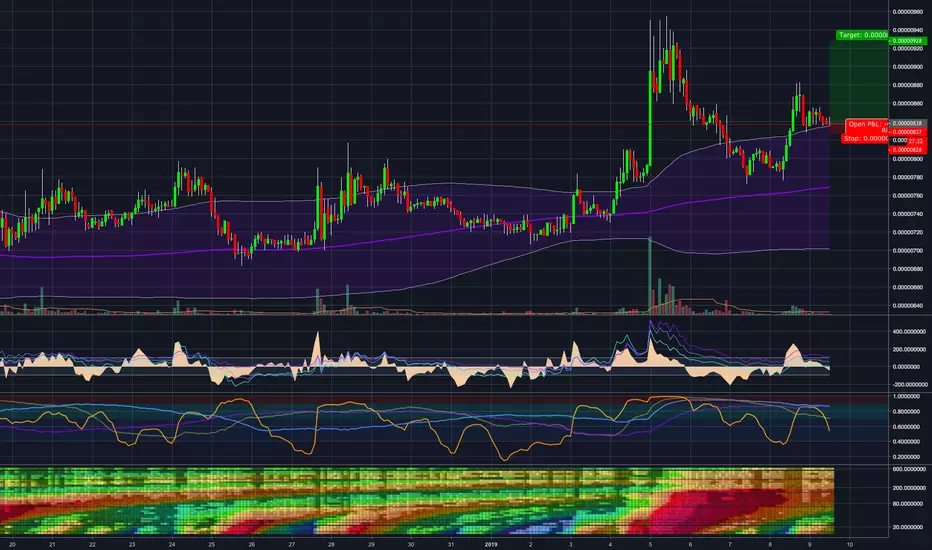
LSE:UFO ¬ Mt.BFX | Pickers Pluck ¬ Inverted ChartAll the info is on the chart, it was made inverted so any layout issues are probably because of that, 'alt + i' or right click the y axis and invert chart.
TP 1 - 0.48
TP 2 - 1
TP 3 - 2
TP 4 - 7.75
TP 5 - 20
TA
Powers of Two
Fibonacci
Gap Theory
Eliiot Wave
Trend Lines
Alien Metals (UFO) is a speculative risk investment, this is not investment advice. DYOR before investing.
Highreward
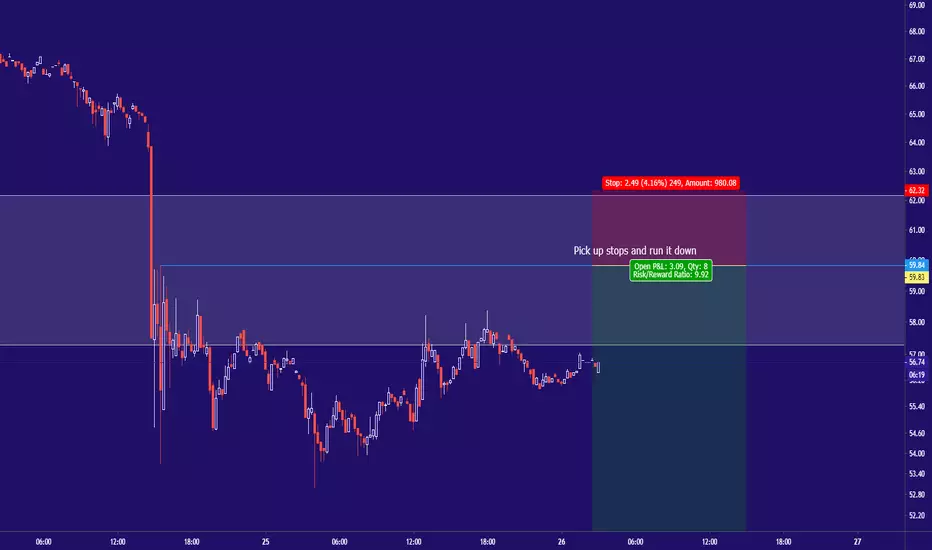
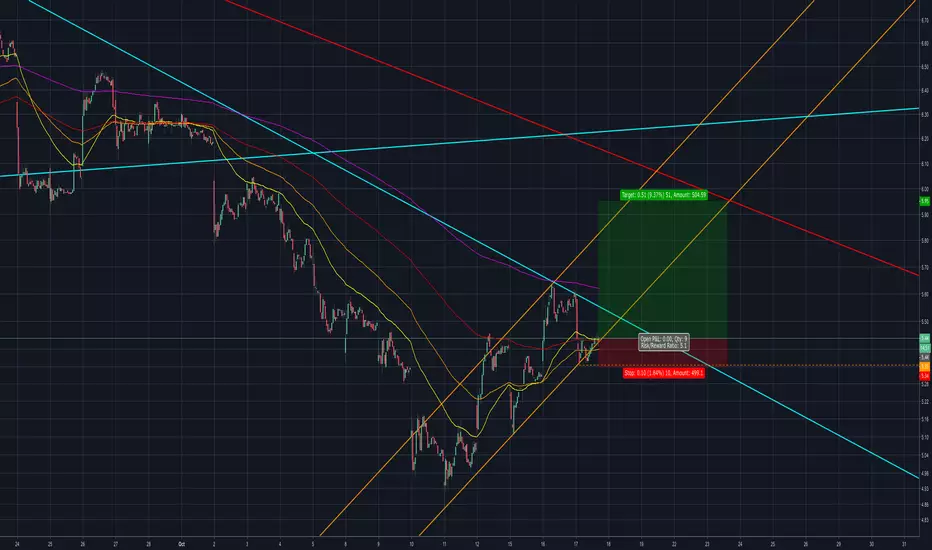
LTCUSD Short Continuation. Superb Reward/RiskHey guys, here's a simple short continuation setup for LTCUSD. Why am I taking this trade? Because I've seen similar setups so many times, that it would be stupid of me to not go for it.
I am building a website with free trading and cryptocurrency education (no nonsense analysis). www.blockchainsanctuary.com
Join my Telegram Announcer channel for updates! t.me
EUR/JPY hammer on a dynamic and static support levelAs we can see from the chart above, the cross is right on a short-term dynamic support (trendline), which has been touched with a very sharp move. Moreover, this dynamic support coincides with a static support level (around 121.22), adding confluence to the analysis. However, before entering the trade, I'm waiting for a confirmation, which I expect to appear on lower time-frames.
Nonetheless, uncertainty remains high in the markets, as Christine Lagarde takes the place of Mario Draghi as head of the ECB, because of her background as a lawyer and not as an economist, but this is not her first expirience in the field of economics. In fact, she has previously served as Managing Director and Chairman of the Internetional Monetary Fund since 2011. However, she won't take charge before November, 1st.
Therefore, if I were to open a long position on this cross, I would either close it before the 25th of July (ECB interest rates decision), or move the stop loss (more on these details in a minute) to break even; while data on inflation in the Euro zone are to be released on Wednesday (Previous: 1.2% - Forecast: 1.2%).
Moving to more technical stuff, if confirmation was to be seen, I would open a long position with a target 123.35, and a stop loss of 120.83, with a Risk/Reward of 1:5.3. But there's another level of concern a bit under the target, the resistance zone of 122.4, which should be taken into account in case of a rally.

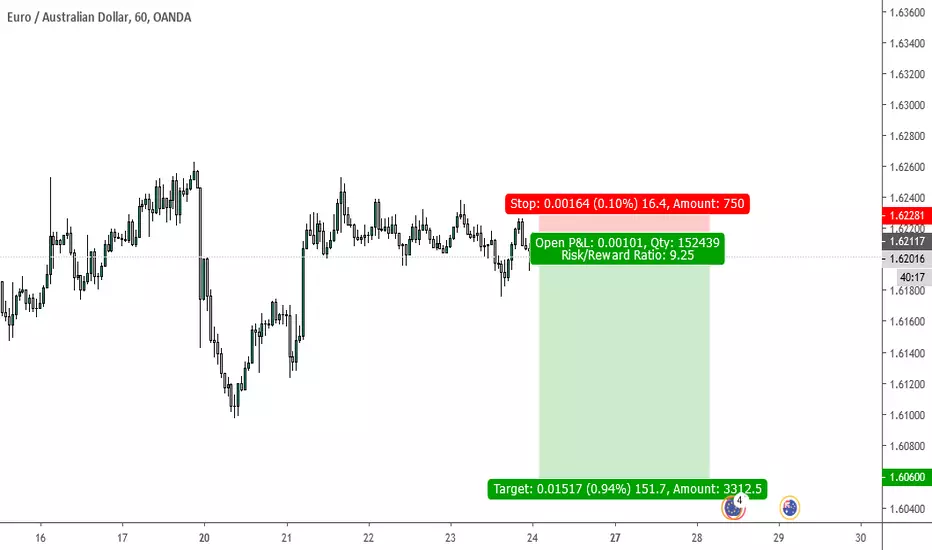
EURAUD will melt to 1.6060!EURAUD has a hard time keeping up above the 1.6200 region and is showing a slowdown in liquididty and momentum to the upside , suggesting a downside target of 1.6060 to easily be met .
Ofcourse the 1.6000 institutional region is not far away from there and could be met very shortly after we have reached the 1.6060 region.
A risk reward ratio of 1:9 is set up for this trade wich is more then decent.
Enjoy the free content!
AUDUSD LONG POSITION (TIME FOR BULLS TO KICK IN??)I am currently in a LONG position for AUDUSD and believe it is going to be a double bottom trade. It is on a support level and with the stop loss just below that, its worth taking for a very good reward potential. In addition, with the wick filled in and the 4H ending in an indecision after such a long sell off, It is time for the bulls to buy in.

SOLVE cup and handle + Golden cross soon, ultimate buy!Hello,
First of all, please take a look at the fundamentals and the great development team of Solvecare, this a great project for the long term.
Second, look at the chart! There is a clear cup and handle pattern forming and I believe that we will experience a golden cross soon, this wil take us to the goal of 0.0005367 BTC and eventually 0.00006547.
I call this a low risk, high reward potential investment.
Trade safe!

High R:R TradeGreat long opportunity with a tight stop loss.
As soon the stop loss is triggered the trade becomes a short and will revert to the mean.

Nice R:R - Expect a bounce from the meanLong at the mean and take profit at the upper band.
If the price falls through than the trade becomes a short.
USDCAD down trend continuation USDCAD reversed from Weekly ascending channel's resistance (yellow channel) around 1.3665 last days of 2018 and had 6 days of aggressive selling
It is consolidating for last 6 days
4 of last 6 candles were very weak bullish candles and couldn't go above on last bearish candle so the selling pressure is still high
there are 2 options to trade this setup :
1) breakout of bearish flag (little red channel) or breakout of 1.3180 support line
2) enter around 1.3325 and 20EMA (the red arrow down) if we had a nice bearish signal (pinbar or engulfing or ...) on 4H time frame
in both cases the stop will be above 1.3325 and targets will be channel's bottom or 1.2790 support shown with green flags
i like the second way because of higher reward to risk ratio
if price broke above 1.3325 this setup is not valid anymore
please like and follow if you like this!! :)


Vibe Is Sitting On Its Pivot PointExpect a bounce up to its previous highs.
As soon Vibe falls back into its 1st standard deviation a reversion to the mean is likely and the long becomes a short.
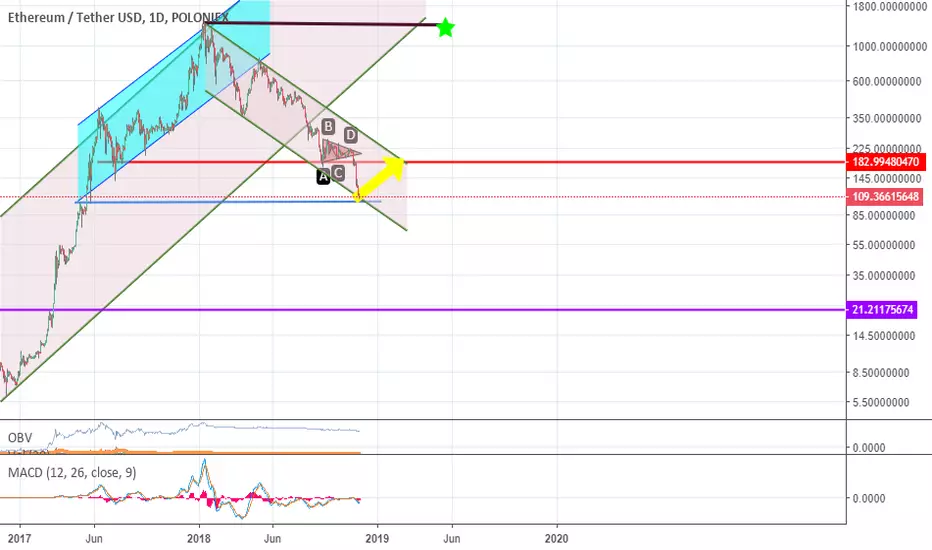
100% gains for Etherium?KRAKEN:ETHUSD has taken a beating, along with most (all) other cryptos. However, there is a possibility that we are going to see 100% gains from here - this sounds great, but considering how much ETH has fallen from all time highs almost a year ago, people who bought in back then shouldn't get too excited - there is a long way to go before you even break even...
But there is a possibility for people who are new to the market to take some profits from this point. The price has established a solid downtrending range and price has just hit to bottom of the range. This coincides with an area of support that could possibly act to help reverse the downward price action over the previous few weeks. Thirdly, price has reached it's target following the symmertrical triangle breakout.
If price manages to turn around it would not be unreasonable to expect it to hit the top of the downtrend range, at around 200.
However, keep your losses tight, as the bearish sentiment is extremely strong and I would not be surprised if it overcomes any bullish sentiment, meaning that price never manages to reach the stop of the trading range. In addition, should price fall below the bottom of the trading range, the next stop is at around 55 - so a 50% loss.
Bull flag pattern? Will the rise continue?Congratulations to everyone who followed my trade. If you would had followed my previous trade, you should be enjoying around 40% profit.
As I wrote before, it's time to analyse the market again and start looking for a new trade.
I have drawn a Bull Flag pattern, which is the most bullish scenario that can happen for NLG/BTC. If the bull flag pattern follows through, we might see a climb towards the 800 region, possibly even testing 1000 sat.
If you are a high risk trader, I'd start to accumulate and keep a tight stoploss (like below 390-415 sat). At time of writing this would be about a 10% loss. However, the reward could be a jump into 120%.
I personally do not take this risk, I prefer to wait a little, in order to see if the bull flag persists. That's when I will quickly buy and enjoy the ride.
I'll try to keep you updated.

VIPS low-risk buy, high reward potentialThis is a short term play that, if all goes well, could turn into a long-term play.
NYSE:VIPS is currently at the bottom of a micro uptrend channel (orange lines), looking to test the two major trend bear trend lines on the 4hr and Daily.
I'm using a low risk entry on the bottom of the channel with a stop under the low of today which would be a confirmation of an exit of the channel.
I'm using a profit target based on stock remaining in the channel and resistance at the Daily trend line (solid light blue line).
There will most likely be resistance at the 4hr trend line (light blue dotted line) but a break of that trend line should give enough momentum to test the major Daily trend line.
Move up stops under new lows that remain along the bottom of the upward channel, let the trade continue if it's a winner but take the profits if the channel fails.
This is a 15 minute chart.
This is a step back on the larger time frame, the Daily, to show the major trend lines that could serve as major breakouts if broken, especially if they are retested once broken and hold to show confirmation.
On the weekly chart, there is trend angle play dating back to 2012 (red line) that could come into play. If it does get broken, retested and held with confirmation, then VIPS is looking at a long term major reversal to the upside.
This is a long shot but the potential is there if the 6 year red trend line comes back into play.
But let's stick with the original game plan on the micro trend channel on the 15 min chart and if it keeps going, great.
Remember, risk management is key!
Tomorrow is another day!
Good luck!
GBPCAD SCANCaught this D point with a 5pip S/L before i had any pitchfork on nothing, want to know how hit me up with private message. madness how precise this strategy is. all about selectivity.
Educational purpose only, not giving signals, not bragging just sharing
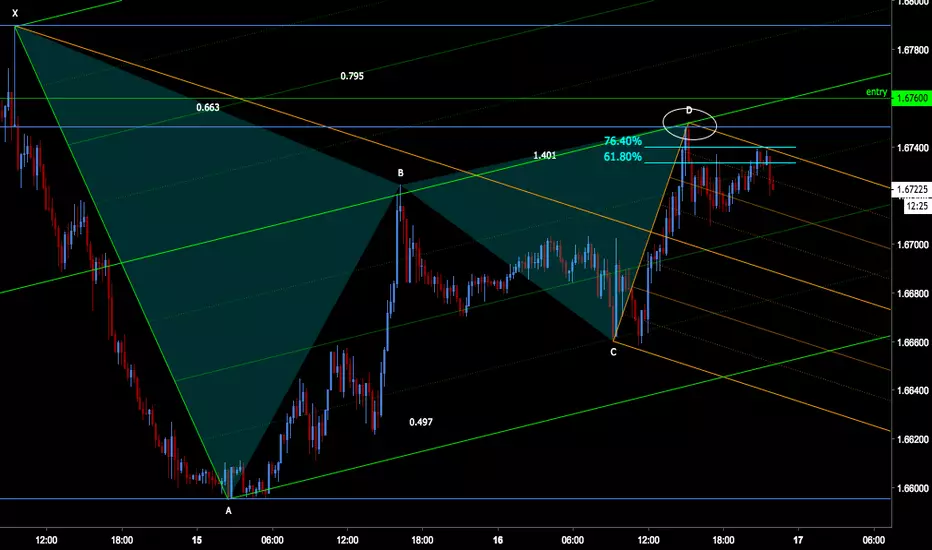
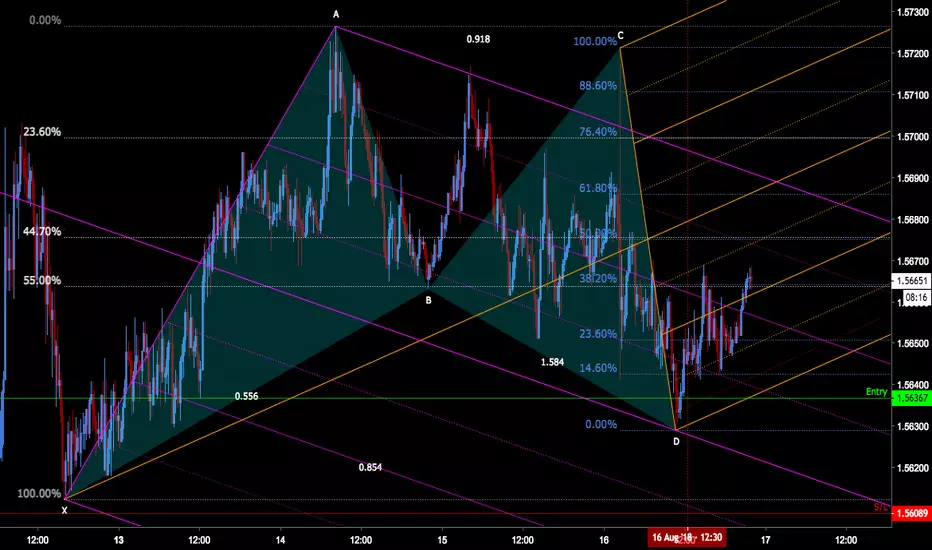
EURAUDA bit more advanced, fibonacci clusters present, double pitchfork giving us nice EP's, hence potential trades. Looking to see how price moves in this fork, can copy past this on your charts to follow price action.
Educational purpose only, use proper risk management if u should trade. Hit me up if your interested in pitchforks, the precision is maaaad.
NEW PARADIGM TRADERNew Scan just came up on USDCHF, put my Pitchforks on. Let's see what energy point will be hit :)

NEW PARADIGM TRADERThese Pitchforks have a couple nice hit on the Upper Parallel and the Median, also on the Warning Line and a few other to the pip touches

NEW PARADIGM TRADERIncredible powerful this new paradigm. If you miss the original entry on the Harmonic scanner, you still have pitchforks that will give you additional entries and many more advantages
