NEW PARADIGM TRADINGvery nice to the pip touches on the upper parallel of the XA-BF, moving down and point D of the harmonic pattern touches the median to the pip and moves off :)
Highreward

NEW PARADIGM TRADINGPitchfork of XA
Point C hit the Upper Parallel to the pip and then moved down to create point D of the entire scanner.
Possible Quickfire trade at Point D and then the CD-X traditional Pitchfork for more trades

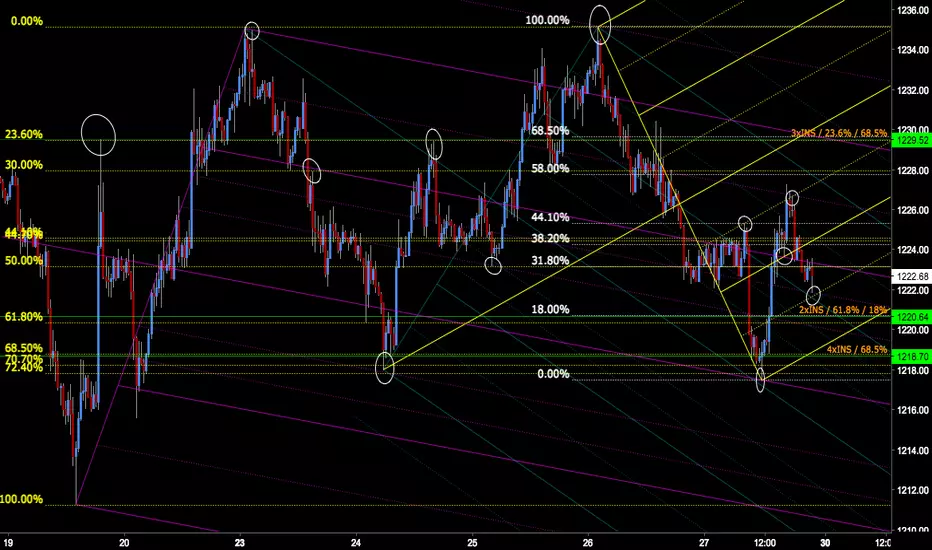
XAU/USD PitchFork MADNESSOn this chart I drew the forks on the main swings, as i was looking at the chart all this fibonacci wooowooo became clearer and clearerer.... btw we looove the wooowooo.
You are probably looking at some of these fib values and wondering where they come from or if I just made them up to suit me. NO!
My mentor backtested all of these over 15 years and thousands of charts and i am eternally grateful for that.
The circled points are the main Energy points that jumped out to me, but thats definitely not all of them.
The Green Horizontal lines are overlaps of up to 6 different Support&Resistance in combination with Fibonacci values. Again these INS lines are not random, they are S&R that is being calculated based on previous day price action, so as of monday they will change again but we do see some nice reverse compliance over the past.
This post (comment) is for educational purposes only. Past trading results DO NOT guarantee future performance.
NEW PARADIGM TRADING - PRECISION TRADINGTwo harmonic patterns with their complementary pitchforks :)

shortx2High r/r short from weird push into range.
Using this to help complement other open positions.
-7777.5, 2.5x, $XBTU18.

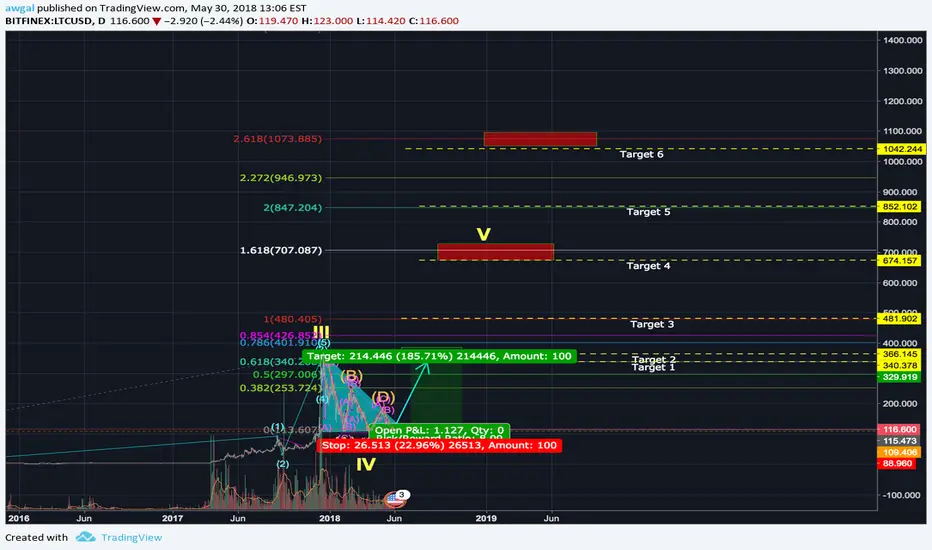
LTC the perfect Long! On the Daily we have a beautiful falling triangle, and a very low risk to extremely high reward potential play!
with my count I am getting to this correction being the end of our 4th wave, I am playing it safe by placing a take profit at 0.618% range at 330-340USD for 85% of my total LTC portfolio and remaining 15% to be divided between 0.786(400USD)-2.618(1000USD).
my stop is at 88USD.
Good luck all.
this is only my actual current trade and not an investing advice to anyone. trade at your own (low)risk ;)
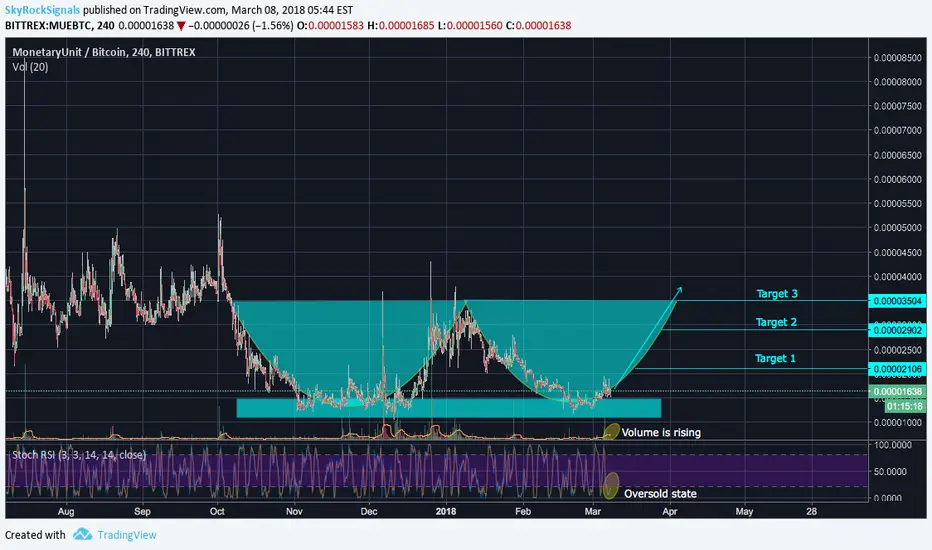
MUEBTC double bottom is formingVolume is rising, Stoch RSI is in the oversold state. We see a possibility of Double bottom formation to be finished on the 4-hour chart. Although BTC fluctuates hard this can be a safe long-term trade, targets are mentioned on the chart
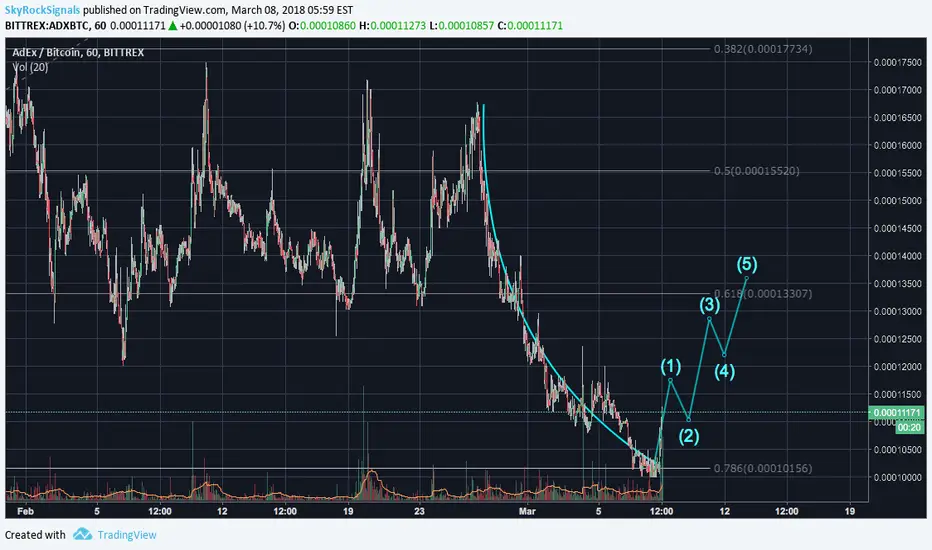
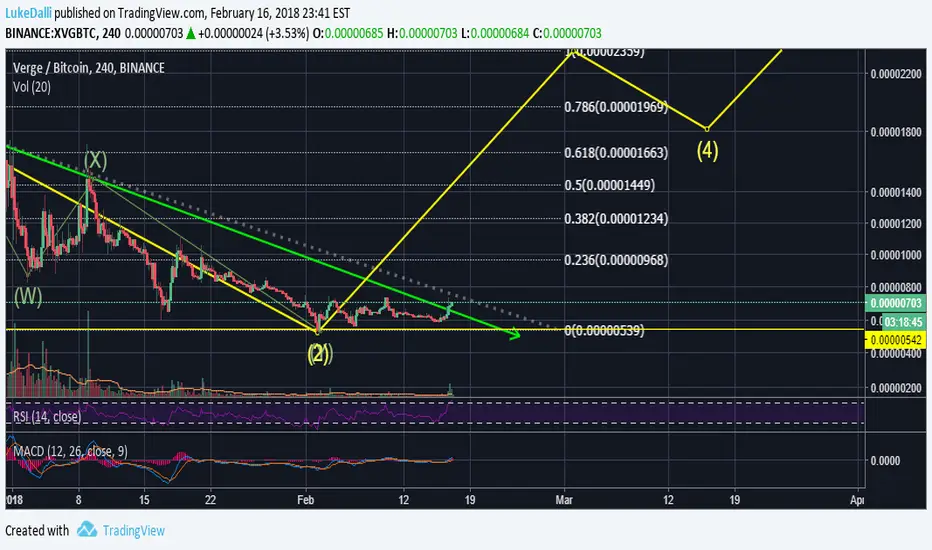
XVG Breakout after double zigzag correcti 300% profit potential!XVG Breakout after double zigzag correction, Wave 3
Targets Based of Fib levels and previous resistancess.
1150
1400
1600
1800
2300
EurCad Short, TrendLineUsing simple trendline and Support And Resistances, watching the EMA's on higher timeframe.. I see a trendline re-touch..

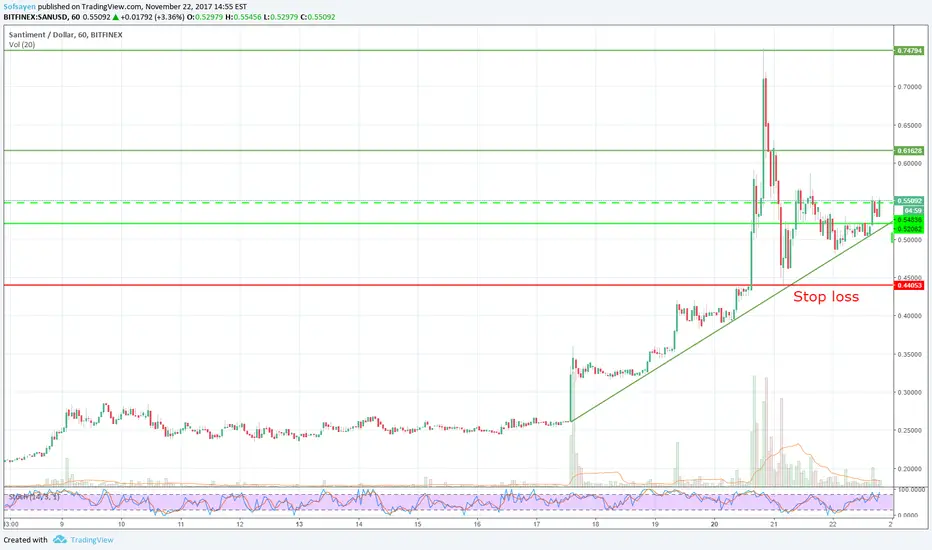
Santiment looking good !Not much risk in this trade ! Trendline has been held nicely !
Buy on entry 1 sell on target 1 . Then buy entry 2 and sell target 2
Not much more to say
*Trade at your own risk ! This is not financial advice !
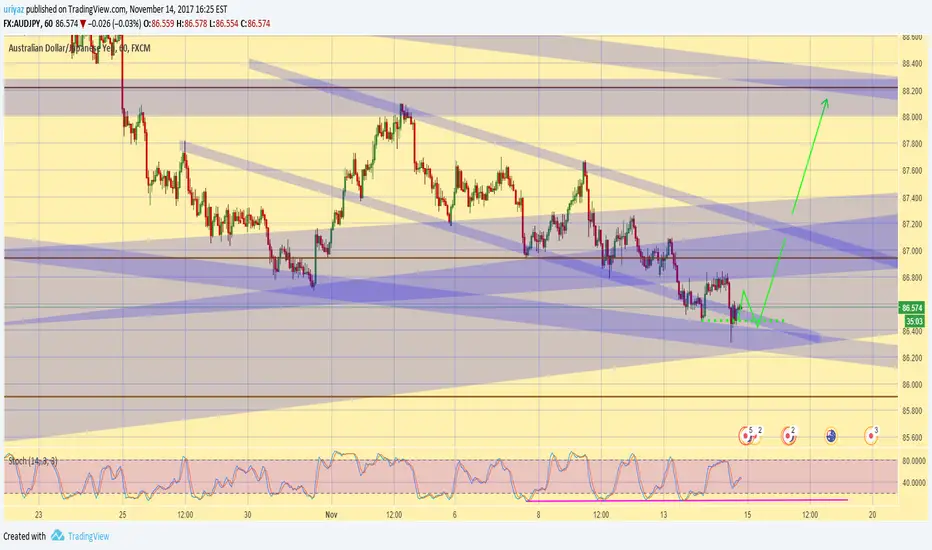
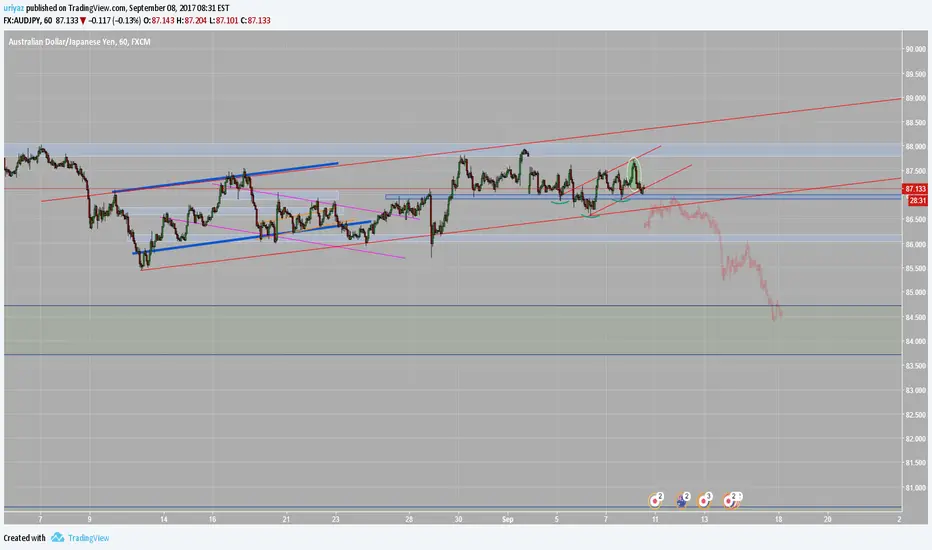
AUDJPY : looking to buy the bottomAUDJPY in a strong support zone from different timeframes.
If the daily/weekly trend will continue up it can be a low risk high reward buy opportunity.
Everything is on the chart.
Best of luck :-)
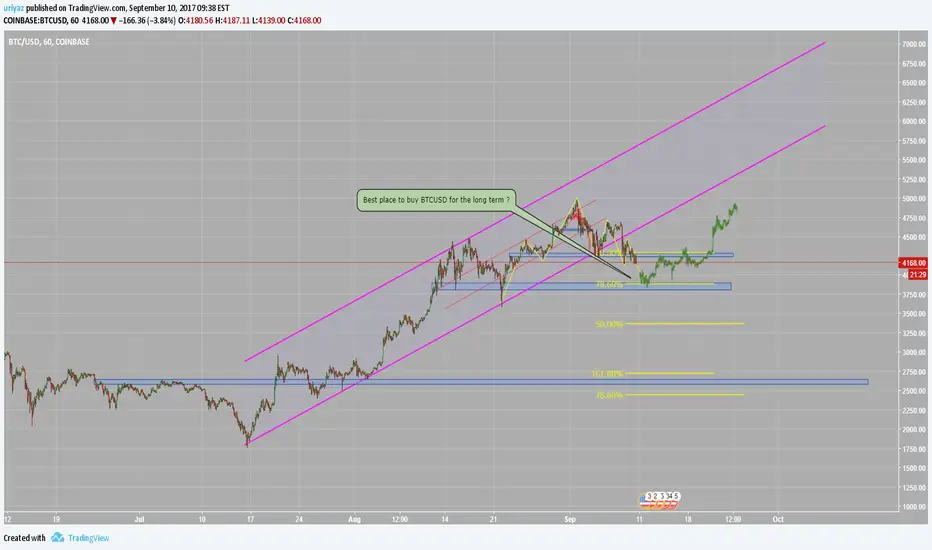
BTCUSD is heading to important support zoneIt seems like BTCUSD is going lower and will hit support zone .
If so, it will be a possible best place to buy for the long term.
Best of luck :-)
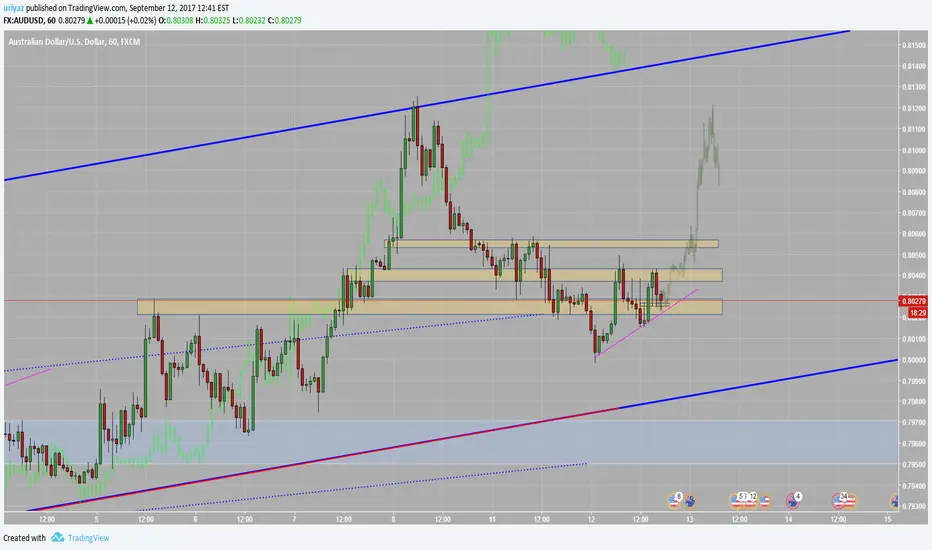
Buy audusd in support zoneThis pair is in potential reversal zone.
Target upper resistance and near top of the channel.
best of luck :-)
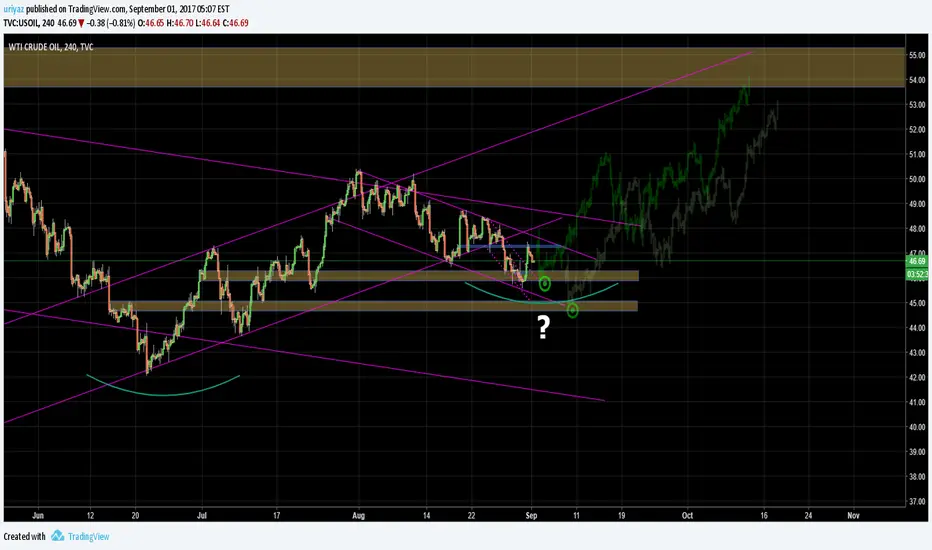
USOIL - looking to buy after more Price actionAfter a rapid move down Oil stalled on support area.
I'll be waiting for more Price action to come , will wait for a reverasl pattern / some accumulation and false break of a low before buying.
Best of luck :-)

looking to short GBPUSD - Calling the top of 500 pips? waiting the falsebreak will be confirmed by enter the channel and sell the retest.
Scenario is marked on the chart...
Best of luck :-)

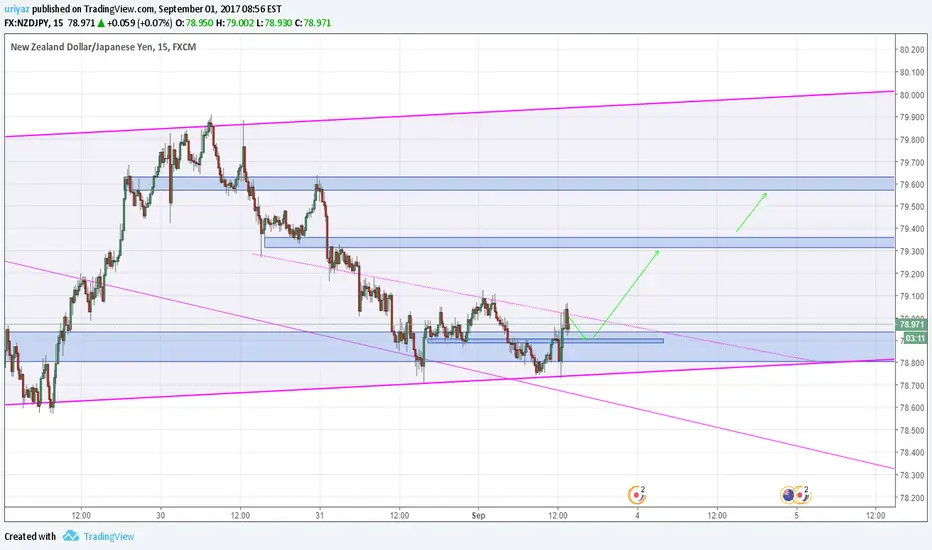
NZDJPY buy opportunitybigger support is holding the price and also tiny support broken - look to buy reversal pattern on tiny support untill resistance.
risk small pips here .
Best of luck :-)
CRUDE OIL - how to buy planWaiting to buy Oil again on support level - described on the chart.
Might be shorting up channel first if price make false break there.
Best of luck :-)
Sell AUDCHF false breakLooks like price failed to rise above channel to a new territoy , so at the moment i sell the top of the channel
If price rise again and break channel then look for long on support .
Best of luck :-)

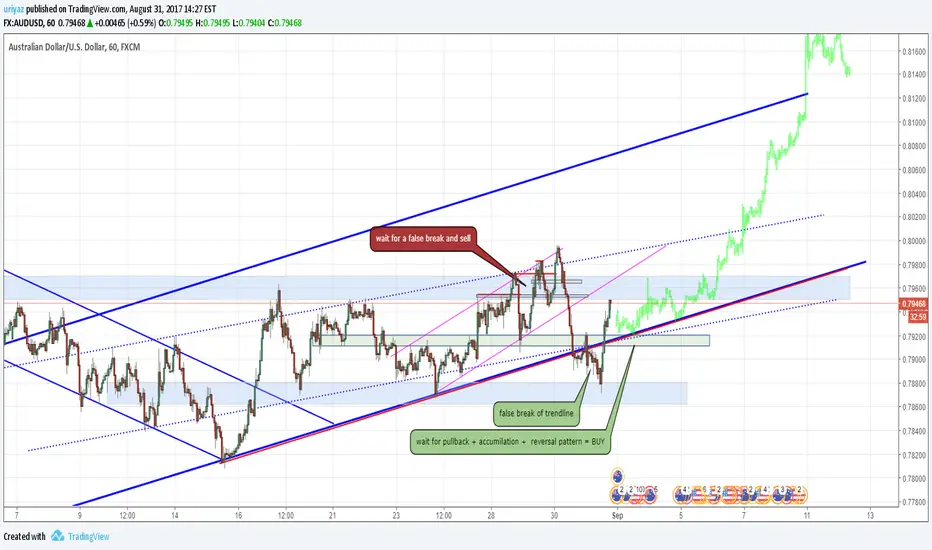
Looking to buy AUDUSD on supportMain trend is still up and confirmed by the false break of the trendline.
i'll wait to the pullback and buy on support - low risk high reward in this trade.
Further details on the chart.
please leave comments what do you think :-)
Best of luck :-)
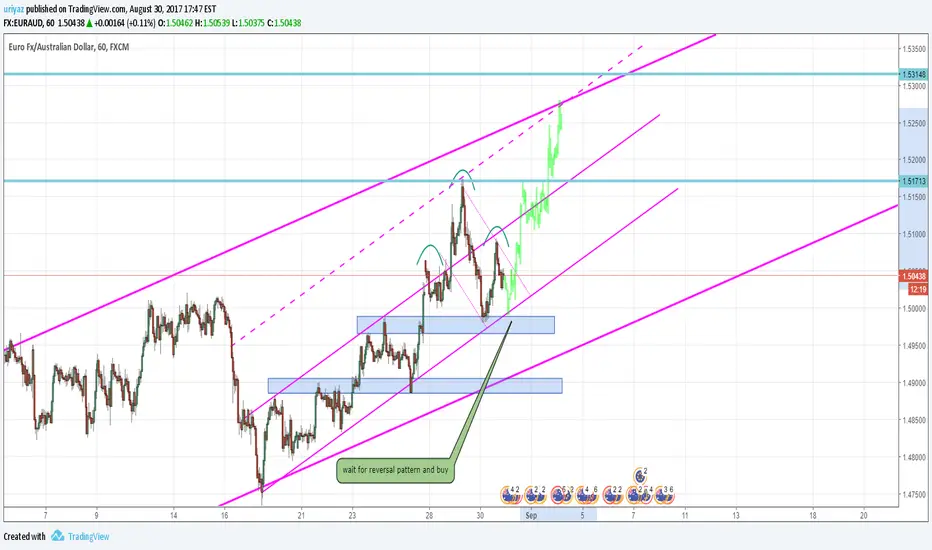
looking to buy EURAUDMain trend is up and bearish h&s pattern formed, but If we stick with the trend we should expect higher prices to the upper channel.
Therfore i will wait price to reach the support zone and buy there after a clear reversal pattern will be formed.
If that what will happen it will tell me that h&s pattern is going to fail and price will shoot up.
Best of luck :-)