Hindustan aeronautics Here is the English version, ready to copy:
---
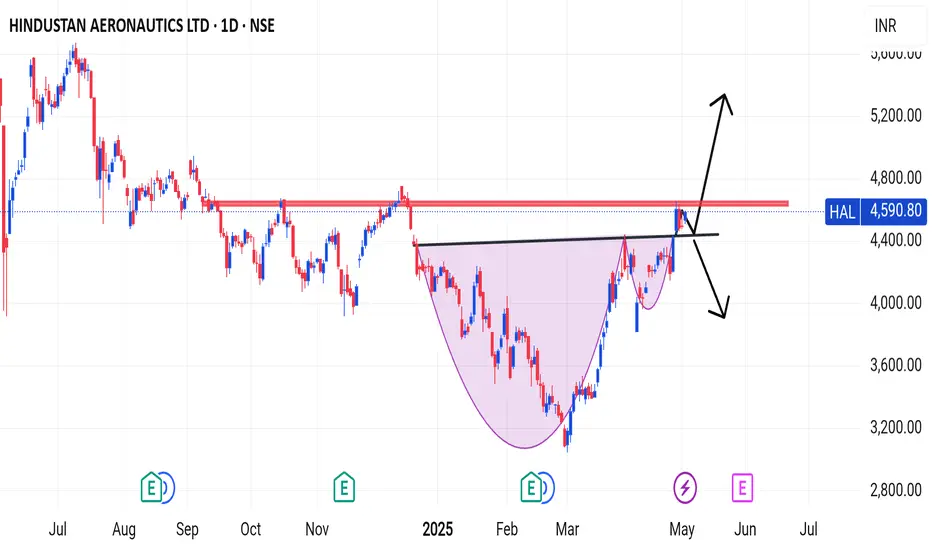
This chart is of Hindustan Aeronautics Ltd (HAL). It shows a technical pattern known as the "Cup and Handle" pattern.
The chart shows a resistance zone around 4600–4700, which the stock has recently tested.
If the breakout is successful, an upward rally can be expected.
If you find this helpful and want more FREE forecasts in TradingView, Hit the 'BOOST' button
Drop some feedback in the comments below! (e.g., What did you find most useful?
How can we improve?)
Your support is appreciated!
Now, it's your turn!
Be sure to leave a comment; let us know how you see this opportunity and forecast.
Have a successful week
DISCLAIMER: I am NOT a SEBI registered advisor or a financial adviser. All the views are for educational purpose only
Hindustanaeronut
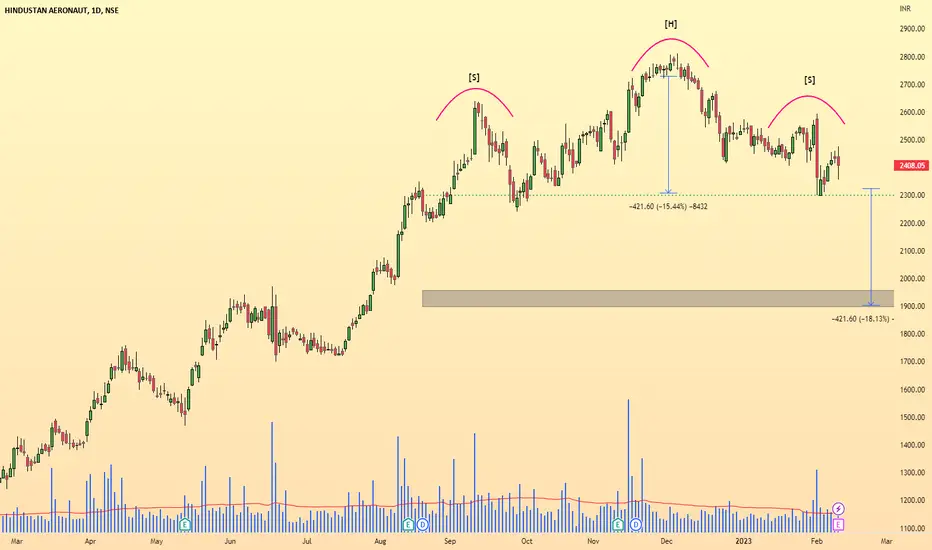
HAL- Hindustan Aeronautics - Weak structure NSE:HAL Looks very weak in all higher time frames.
1] At Monthly time frame it is a clear Bearish engulfing pattern.
2] At Weekly time frame it is having a head and shoulder pattern.
3] At Daily time frame it is clearly completed a head and shoulder pattern. The volumes are dried during the phase of H&S and started to pick heavily during down days.
4] Neckline is placed at 2300 a clear break down with heavy volume is a must for a Short entry or retest with low volume to neck line after a break down is another low risk entry opportunity.
5] Usually the targets in such pattern is the difference to neckline, in this case it 420 points or 1900. Interestingly the NSE:HAL chart has meaning full support only at 1900.
Good Luck