SPOT: KOTAKBANK SUPPORT LEVEL@ 1230,BELOW THAT WILL FALL TO 1190SPOT: HOLD : KOTAKBANK SUPPORT LEVEL @ 1230,
BELOW THAT TAKE SHORT TRADE FOR TARGET 1190, SL 1270
RISK REWARD 1:1
HOLD

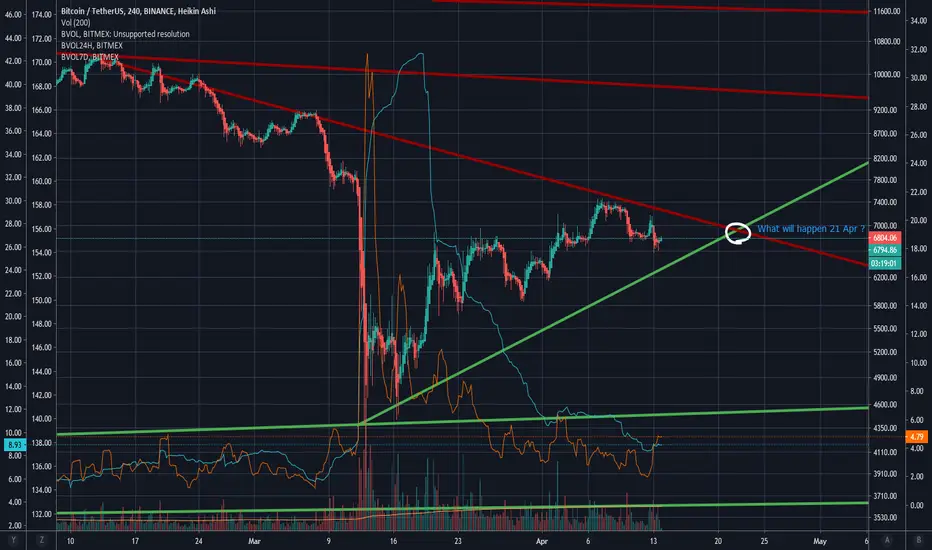
BTC/USDT What will happen on 21 Apr ?BINANCE:BTC/USDT What will happen on 21 Apr ?
Long to 8.2k breaking 1D MA 200 ?
Short to 6.2k remaining under 1D MA 200 ?
Buy & hold : FUD/FOMO intensifies ?
Breaking above 8.2k and remaining at this price for one month would attract investors for the halving incoming
Remaining at 6.2k would mean that BTC is becoming a stablecoin (and attract more investors ? ^^)
Buy & hold : BVOL increasing and go back to 4.5k ?
Nobody is able to predict the future.
Real Estate, time to buy or sell?Real estate during a stock market crash. What is going on. Are they related? Is it a good time to buy a house. I'm considering selling, should I wait. Well, let's take a look.

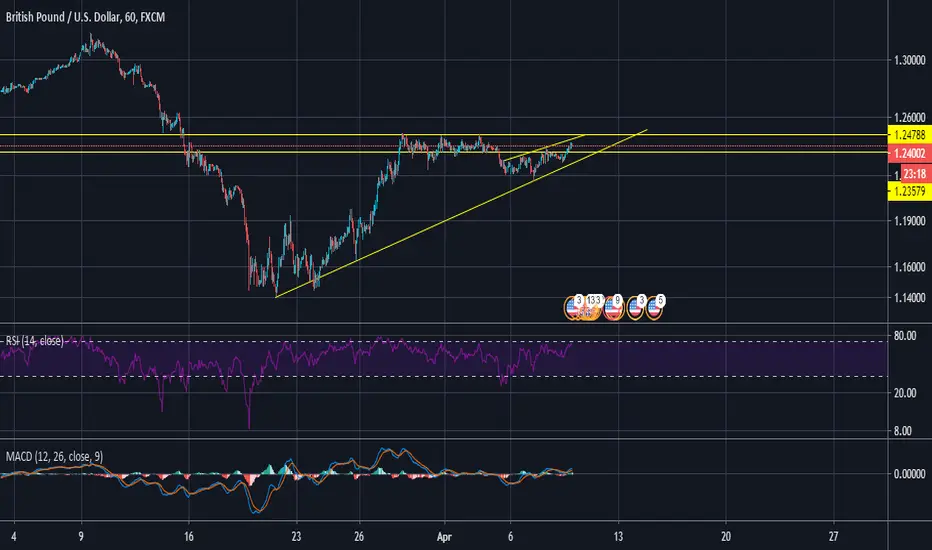
08-Apr-2020: GBPUSD may touch 1.24788 soonGBPUSD may touch 1.24788 soon before correction Support @ 1.23013

SPOT:HOLD RIL Support/SL Level @ 1030, Target 1100, & 1150RIL taking Support around Level @ 1030, Can be hold for Target 1100, & 1150

HOLD: SHORT TERM SUPPORT LEVEL @ $6525 & TARGET $7740, $8000LOOKS GOOD AS LONG AS IT HOLDS LEVEL @ $6525 , IT MAY MOVE TO TARGET LEVEL OF $7740, $8000

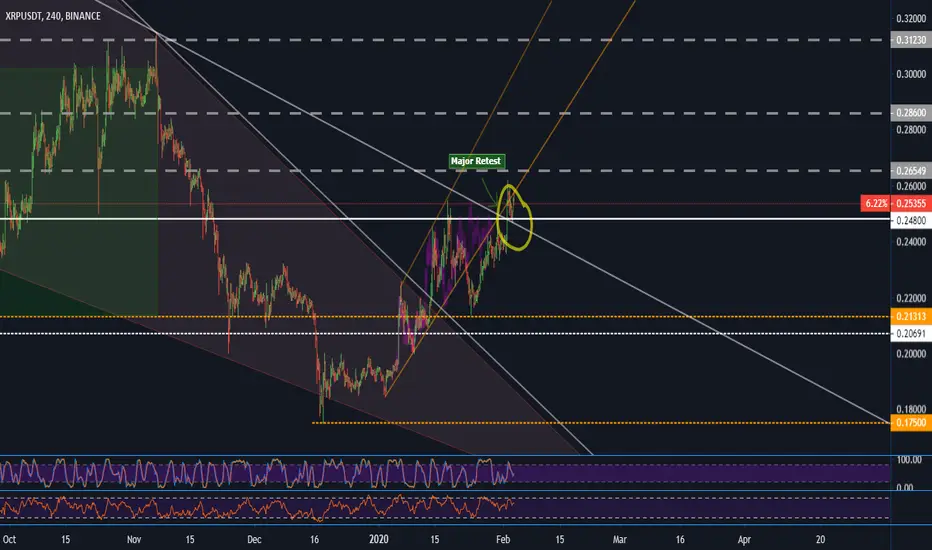
[Bullish] XRP - Possible Targets I see XRPUSD Breaking the channel, let's wait for it to break some important zones as weekly resistance, then break the overall trendline, retest it and blow UP. Let's still be patient and don't rush it!

18.3.2020 - Bitcoin (BTC / USD)Hi Traders!
The history of cryptocurrencies will certainly remember the last week as a tragic one and therefore we will discuss bitcoin again today.
In the last analysis, we also marked the lower trend line on the chart. Probably, no one expected it to be tested just a couple of days later. At the moment, we are probably on the strongest trend line and on key levels.
There are 3 strong supports awaiting:
1. Last LOW - $ 3,234
2. 2017 Swing - $ 2,976
3. Swing LOW from 2017 - $ 1,801
Where's the bottom?
This is probably the basic question often followed by another question - when is the best time to buy? However, no one knows the answer to these two questions. Bitcoin and cryptocurrencies are experiencing economic collapse for the first time in their history. Although Bitcoin came into existence in 2008 (during the last financial crisis), it was of no value at that time and trading volumes were practically close to nothing.
The crypto fundament is now secondary, as well as halving. On the Internet, there is a growing belief that the price cannot fall further due to the mining process. The truth is, in the short-term the price may still decrease.
What's next?
At the moment it's best to simply wait and possibly buy for a long-term hold. Problems in the world won't be solved quickly. The most important thing, for now, is to keep the trend line. If we break it downwards, we would follow the listed supports, where we would set up purchase orders.
May the crypto be with you!

Long oil September - don't get trappedThe dark cloud will pass. Buy early and you shall win.
I shorted this on the way down (see linked idea). Now is the time to go long. TF 6 months

Year end target for American AirlinesLong term hold. The virus crisis will pass and people will still need to fly after.

Year end goal for Royal Caribbean CruisesOnce the dark cloud of the virus passes, we should start to see this trending up quite a bit.

nifty overview support resistance zone nifty
as can be seen in chart
hurdle at 11350/11450 zone
while support at 11050/11150 zone
always pay attention to open = high candles and vice-versa

XRP Holds Above Channel | Big MovesQuick TA on XRP/USD. just broke channel resistance. The pop is coming...
DotcomJack | People don't plan to fail, they fail to plan...
Second Trendline HoldingSilver technically broke down from the initial up trend line but seems to be bouncing up off a less significant trendline the last several days. Breaking the trendline is bearish in the short run. With that being said Silver is a major long term buy for many fundamental reasons qe, negative rates, inflation, gold/silver ratio and silver in the long run will catch up to Gold. Also remember other than the trend-line this is an area of strong support.

One Month Returns of the 10th Hash Ribbon BuyDid you buy $BTC?
The Bitcoin Hash Ribbon Buy (indicator released October 2019) was exactly one month ago today.
Let's check in on performance to date:
- Max downdraw: -5%
- Max Returns: +26%
So far, all within the normal historical range.

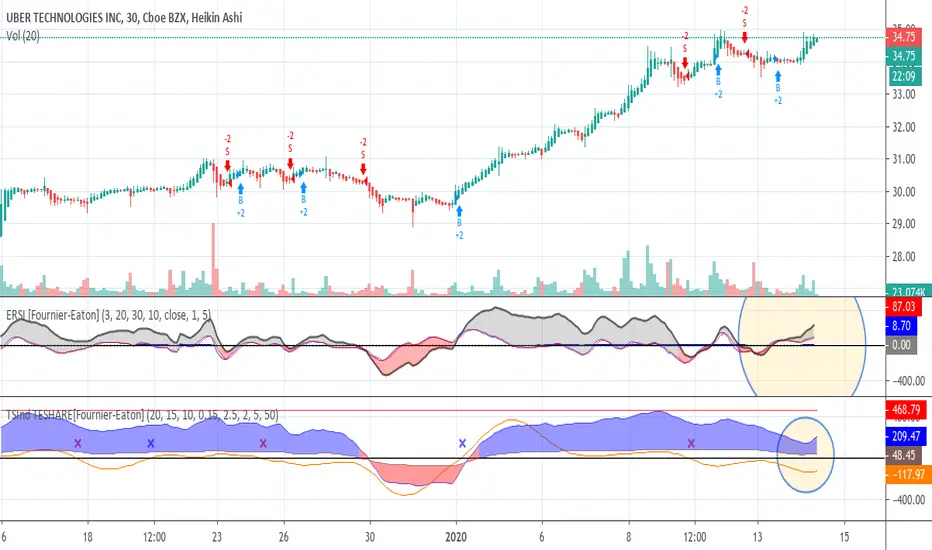
Still looking strong New more reliable indicator: ERSI-- "Early Reversal Signal Indicator" show positive strength on the 1M chart.
Trend Shift Indicator also showing positive opening
EARS (for very early reversal info showing red to green).
Conclusion: not yet time to sell.

STILL GOING STRONG: hang on a bit more
ERSI: Early Reversal Signal Indicator showing opening momentum
Trend Shift Indicator: showing reopening momentum.
Looks like we can hold a bit longer before a breather.
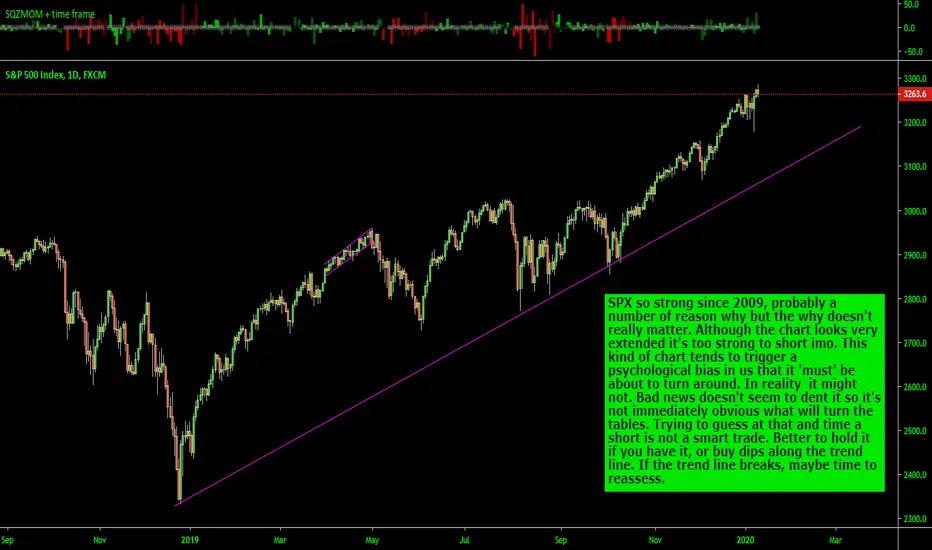
S&P 500, ride the pg.SPX so strong since 2009, probably a number of reason why but the why doesn't really matter. Although the chart looks very extended it's too strong to short imo. This kind of chart tends to trigger a psychological bias in us that it 'must' be about to turn around. In reality it might not. Bad news doesn't seem to dent it so it's not immediately obvious what will turn the tables. Trying to guess at that and time a short is not a smart trade. Better to hold it if you have it, or buy dips along the trend line. If the trend line breaks, maybe time to reassess.
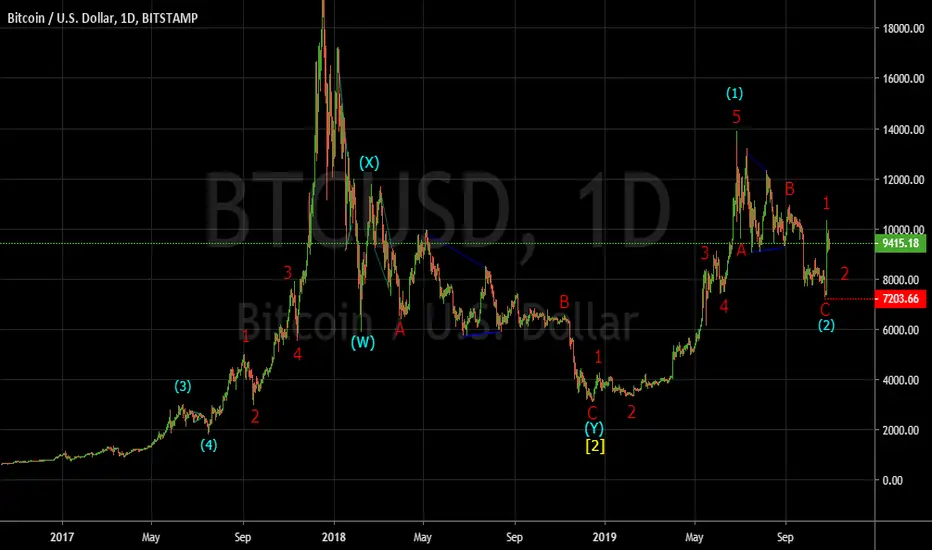
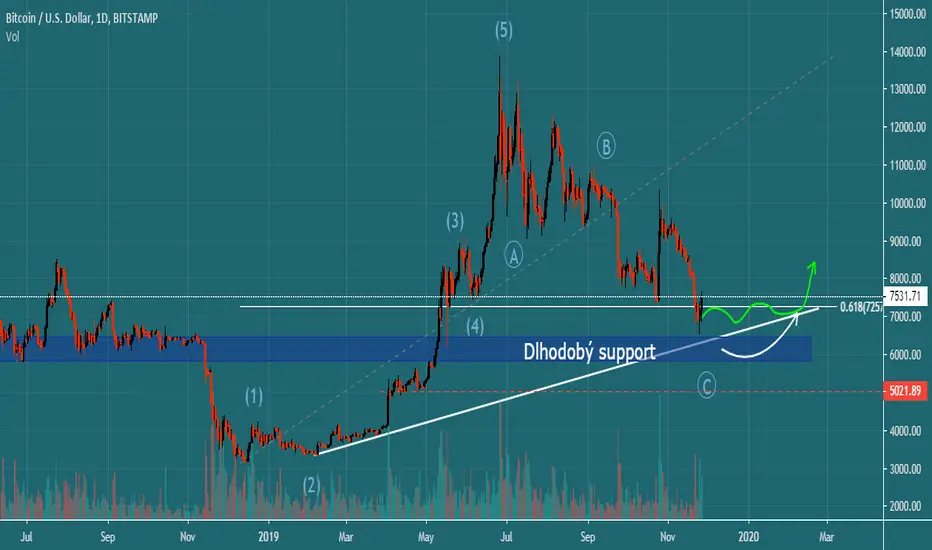
27.11.2019 - Bitcoin (BTC / USD)Hi Traders!
What's going on with Bitcoin? You probably wonder why we are sinking so much and what's going on? Today's analysis is devoted to Bitcoin and its daily chart. Again, we will present a few possible scenarios.
To begin the analysis we need to say that there are currently many possibilities for future development. Few expected a record 42% pump to be completely cleared. We also got a confirmation that the institutions were short on Bitcoin last week so they had known what was going to happen. How to deal with the whole situation now?
1. The best option
The best thing that we could await is the scenario that we are currently at the bottom and we would go higher. We cleared more than 65% of the entire growth and that's a sufficient retracement. Only in 35% of cases in cryptocurrencies, the chart reaches such retracement. In addition, we've tested a key level of $ 6400, which is a long-term “point of control”. From this point of view, the chart has passed the test and could point upwards.
2. Consolidation
This option seems more likely. Rarely happens that after such a rapid fall an immediate growth comes. The chart usually recovers for a few weeks. In this case (indicated by a green arrow on the chart). Institutions tend to buy Bitcoin in large numbers via OTC at this time, and the market is flooded with negative information. We can see something similar now.
3. The bottom is yet to come
No one knows where the real bottom is. Neither the best trader nor the best analyst can pinpoint this. Even at this point, we can be at the bottom. Where could we go in case of continuous decline? Quite many talk about the level of $ 5000.
Our recommendation? It may be too late to go short and too early to go long. How to figure the situation out? Buy more for the long-term portfolio.
May the crypto be with you!

BITCOIN: YOUR WILDEST OPPORTUNITY IS NOW!GET READY! BITCOIN is going to the moon. BUY and HOLD. Stop Loss $7276.83. Targets beyond the previous high of $19,000.
Don't miss the bus.