HOT/BTC IS LOOKING HOOTT TODAY - Day Trader ExplainsLads and Ladies,
Welcome back to TJs' Trade Corner, today we will be taking a look at HOT/BTC after it got some nice attention online, let's see what is actually behind the hype of your favorite shillers.
There are multiple points that I want to cover and we will start with market structure.
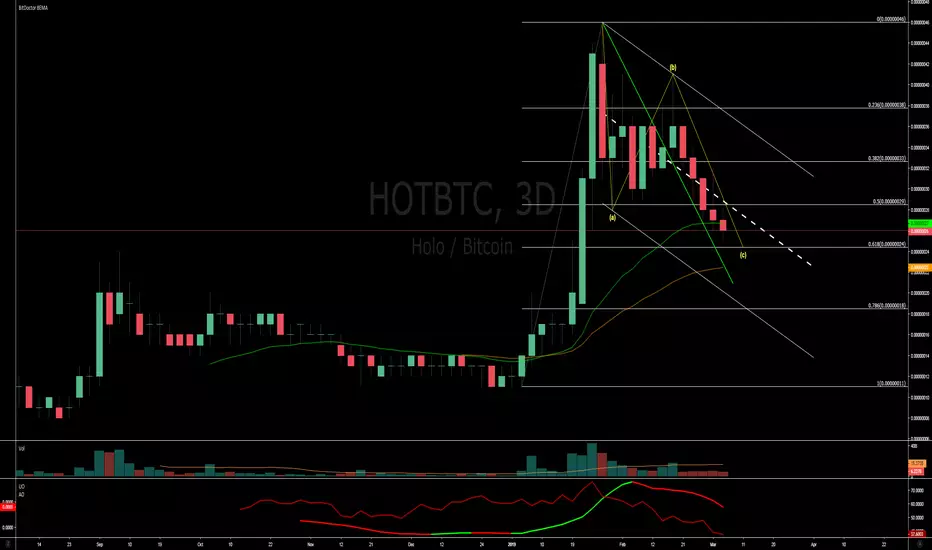
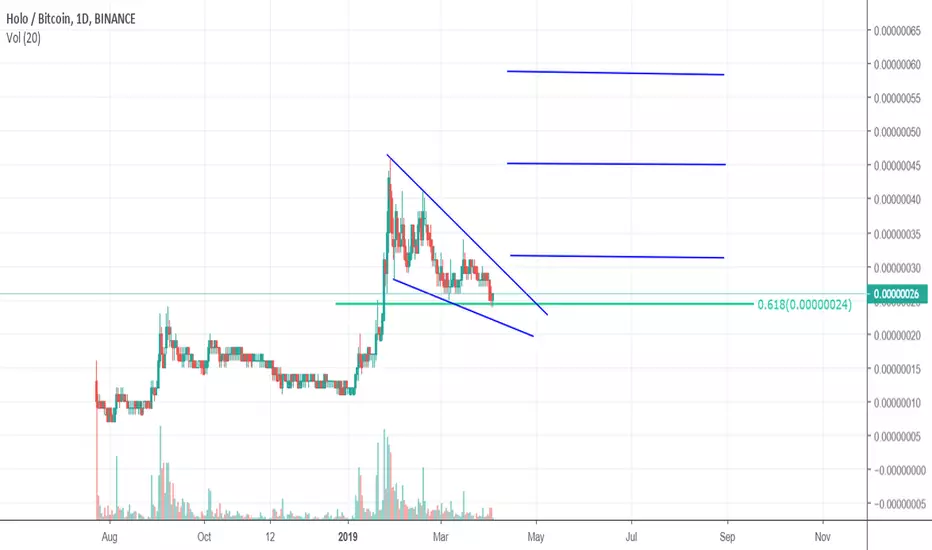
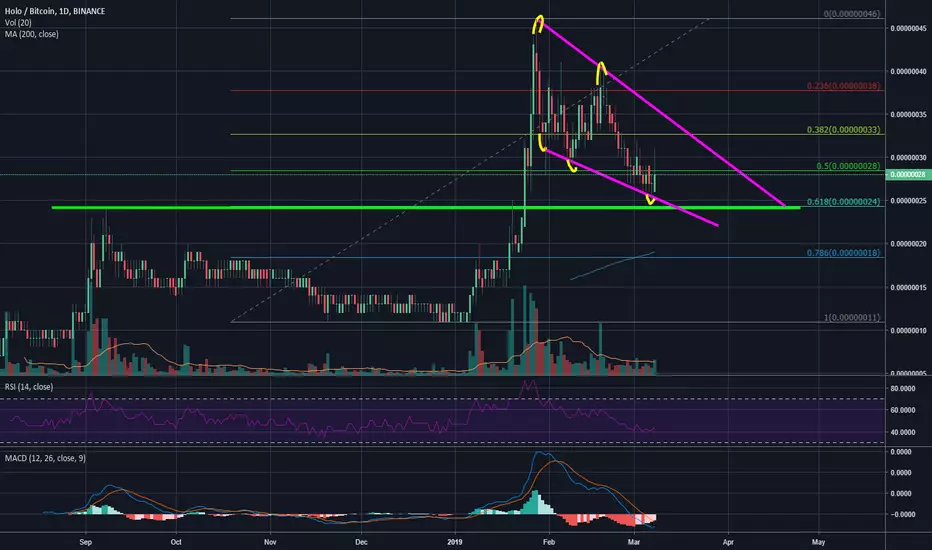
Clearly, as many have seen it, we have a falling wedge. This falling wedge has been drawn exactly on the line-chart, where we go only for the closes. I see that there is a second possibility for a falling wedge, focusing on the wicks. Nevertheless, the closing prices have more weight to it and since it aligns perfectly, I stick with them.
The second step is to look at the retracement itself. We see that HOT/BTC had an immense push, yet everthing that goes up, must come down again. This happened here as well, we come once again to a point where is our uptrend broken? To which point can we retrace before the uptrend is officially broken and there is no reason to long anymore?
This is the 61.8% line of the Fibonacci tool. As we can see we are exactly at this point right now and normally we see a strong bounce at these levels.
I have to say, here the Fibs start at the start of the clear uptrend, but end below the very top of it. This is because I want to always have at least 3 confirmation points for any horizontal- or trend-lines.
After identifying the structure, key levels and the trend, we take a look at the volume. Here, the volume has been very significant during the uptrend, yet during the retracment, the volume has been nowhere near significant levels: Still, we had some buy volume spikes in that time, where it should be exactly opposite. This is a clear sign that this is just a retracement and not a new downtrend. Giving us the best foundation for a long position.
Looking next at the TJ-Stoch, we see it trending up, during the retracement, which is a bullish divergence and a good buying opportunity. Moreover, we just saw a crossover and can expect a nice push pretty soon. Especially, if we stay above the 40p line.
Now, lets take a look at what is necessary for a clear breakout.
To be sure of a nice and clear breakout, we need to see a daily close above the 50% Fibs line. At that point, we would have a clear break of the retracement, also, significant volume should be important. The medium target would be at 33 sats, yet it could continue with a 200% push if we break the previous high.
This trade has been published before in my private learning group "ETG".
We are going over many observations and possible trades very frequently.
It is meant for only those who are really interested in becoming a self sufficient trader and learning about all the secrets of trading.
Should you be interested in ETG or the indicators I use, join my discord channel and say hi in chat, then I will give you a free trial for which you might be interested.
Like and Follow me and you will find the space interesting because I am a TA expert and professional day trader in crypto since 2012 that does daily updates and new posts about the hottest and most discussed coins.
Cheers TJ
HOTBTC

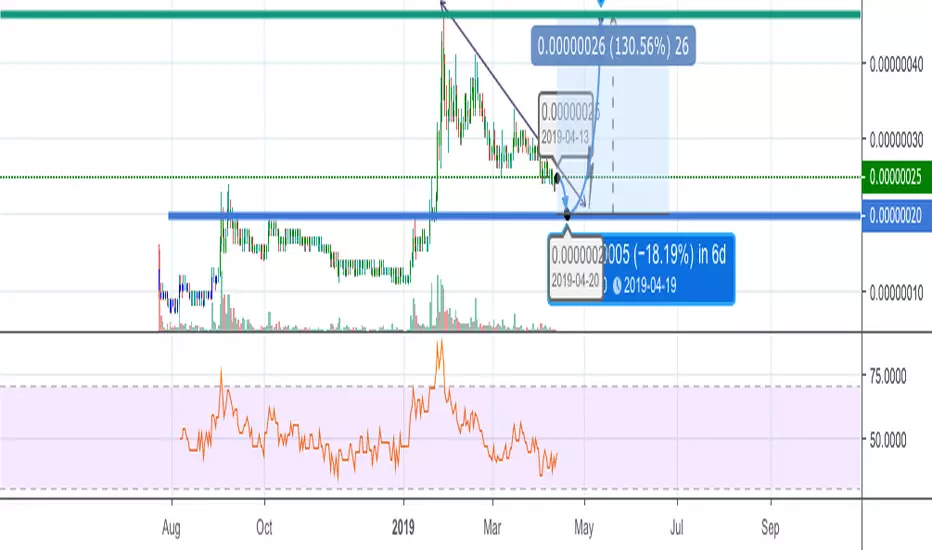
HOT BTC Bear is on the huntI see a opportunity to fill in the bags if it continues down to 20-22 as it should quickly recover to 26 and above once BTC stabilize

HOT. Buy Range : 20 sat. Sell around : Do not sell wtf ?I honestly invest a lot a money in this project (weeks ago) and I truly believe in it !
But also do think we're in bearish trend - till next pump which should be around 20 sat.
+ In my opinion it is to early to predict long term expectation...
Like and feel free to comment
HOLO fractal anyone? HOT looking decent here dropping slowly back down to support
If we get a bounce in those demand zones below, we could see a repeat of the previous rise in price on a extremely low sat coin
Thanks guys!
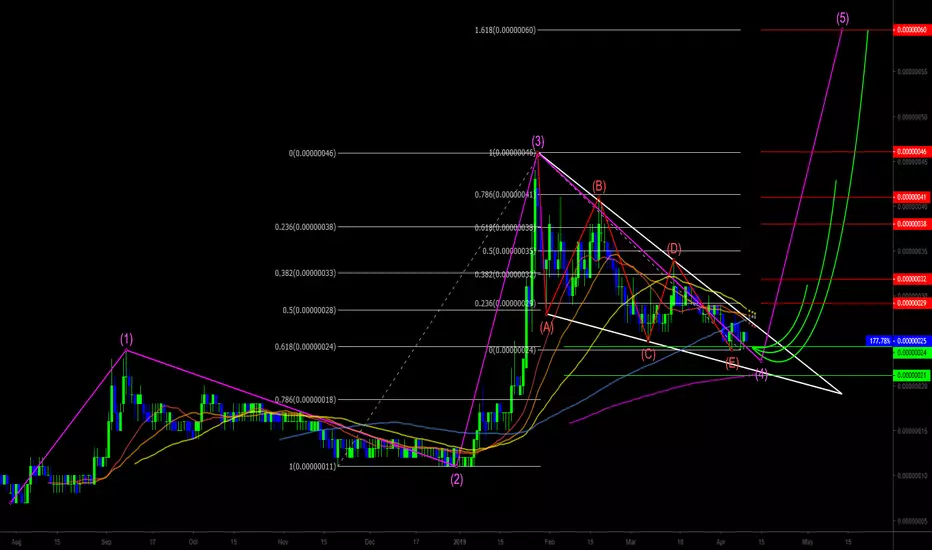
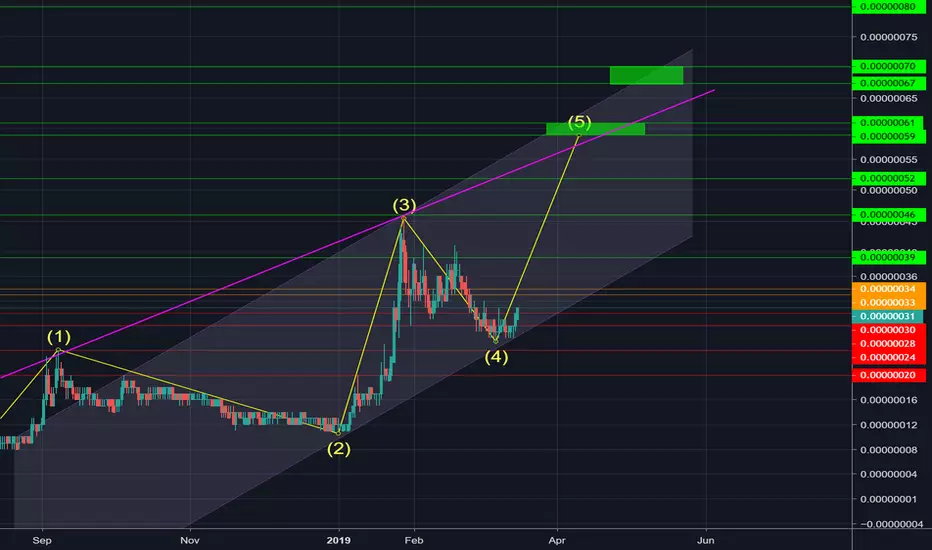
Possible impulse for HOT?HOT is sitting on the 0.618 fib level, also too note we can see the Daily SMA200 is currently not far below at 21 sats so I am expecting some sort of bounce here. I have outlined what could be a massive impulse run for HOT where price is in wave 4 and about to transition into wave 5. First I am looking to see if we can close a daily candle above the 0.382 fib, if this happens I will then expect price to jump back into the 40s, and if price rises above our ATH at 46 sats the final target would be the 1.618 fib currently at 60 sats although this 1.618 can slightly vary if price does infact drop down lower to the daily SMA200. Whether or not this mega impulse run plays out.... I see reason to believe we trade a nice bounce here!
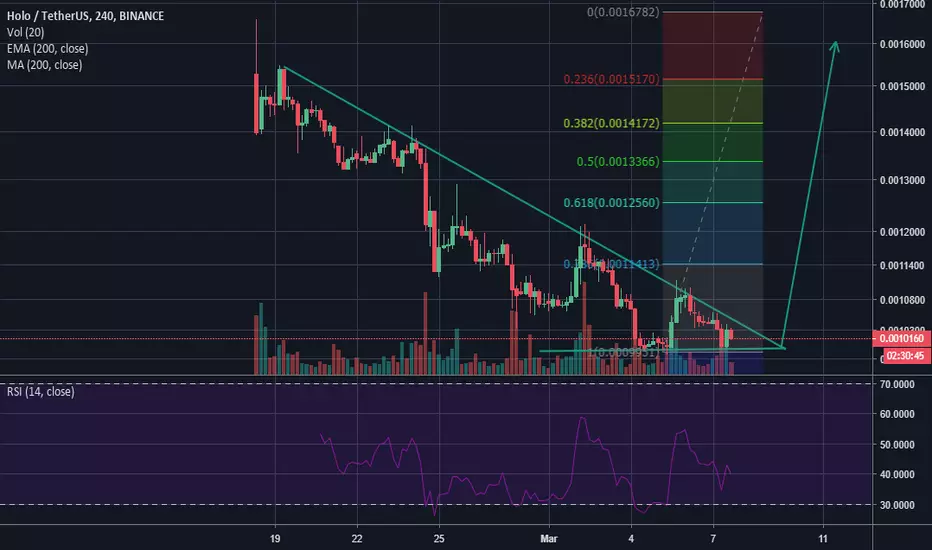
Got some $HOT here* it made a 61.8% fib retracement
* S/R flip
* $HOTUSDT chart looks great
* if this level doesn't hold, I'll be setting my buys at 18 sat

Daily Bullish Signal $HOT #HOT #HOTBTC #BTC $BTC (07 April)RED ARROW indicates the EXPECTED Time and Targets
Level Stoploss point up to maximize profit and reduce risk
I'm working all the time, even in Bearish Market

HolochainBecause of market conditions I chanced my previous thoughts about it.
If it wants to go up I will follow it and its sitting above fib 618
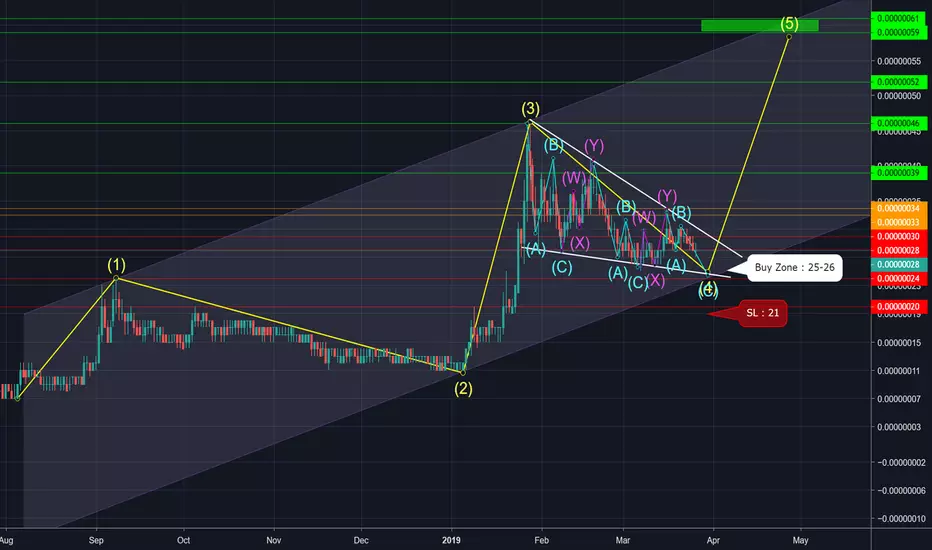
HOTBTC : 100% Profit4th Waves last more than we expect in last analysis..25 and 26 is good for buy to profit from 5th wave..
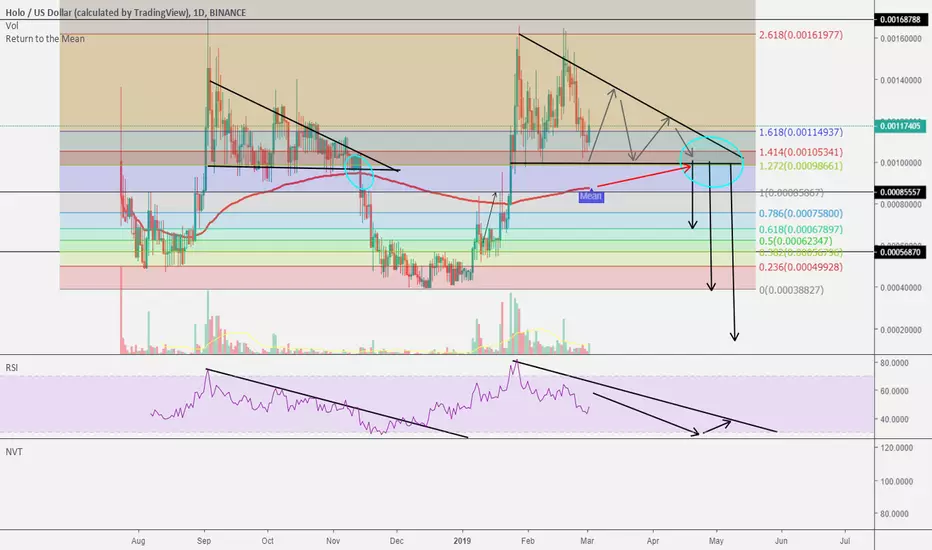
HOTBTC: UPDATE Q1 2019Oversell support searching for a new lowest low
Overbuy resistance waiting for the price to come check if there is an option to settle above
Looks like this summer HOT may become a very HOT one
Buy Target: .00000026
Sell Target: .0000007

Holo - HOT - Fundamental and technical analysisGoing through all the fundamentals and technicals of Holo that have lead up to this big move

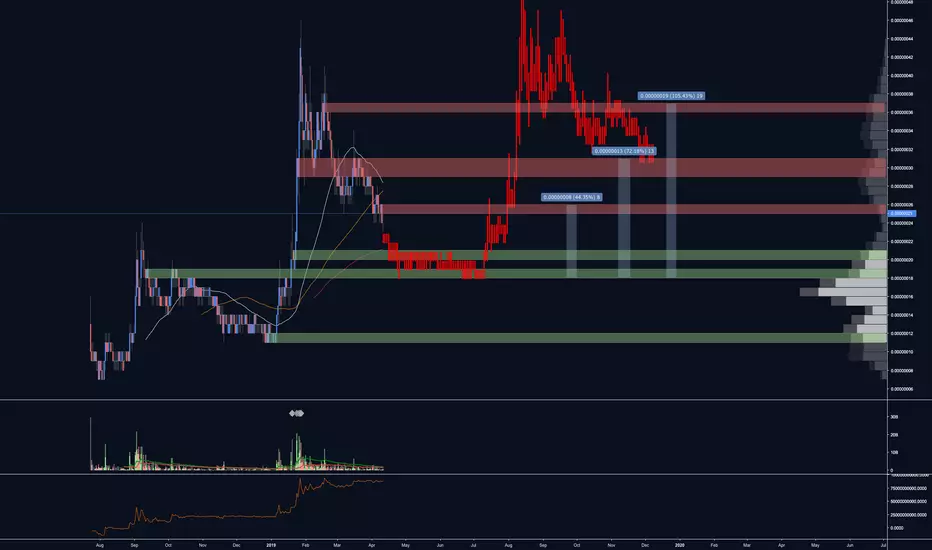
HOTBTC : About 100% ProfitGreen Zones are HOT targets. We can expect the price reach to targets less than 45 days.


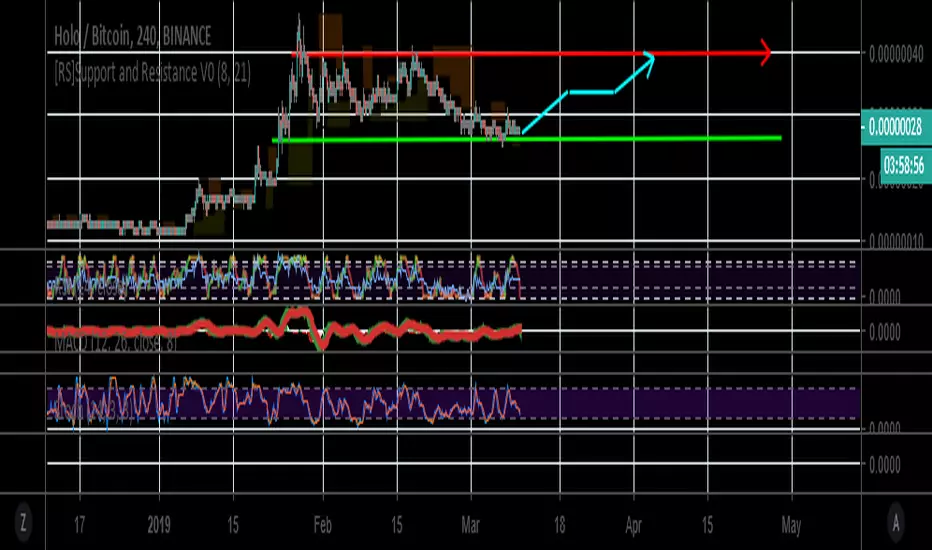
HOT HOTBTC Forming for move upEntry at green line
Exit at red line
SL:24
This is just a tip/ do your own research/ check the 1 day chart down!
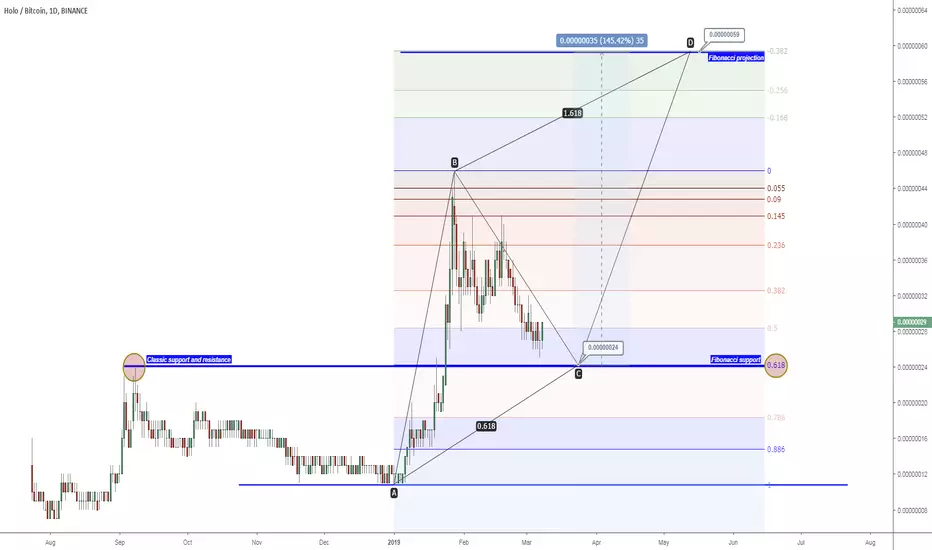
HOTBTC (request analysis)This coin perform strong bearish from Januari, and almost reach fibonacci support at 24.
This support also as classic support and resistance.
If 24 able to hold bearish movement, We have 145% profit target at 59.
Good luck
*if you agree, let me know by like this idea ^_^
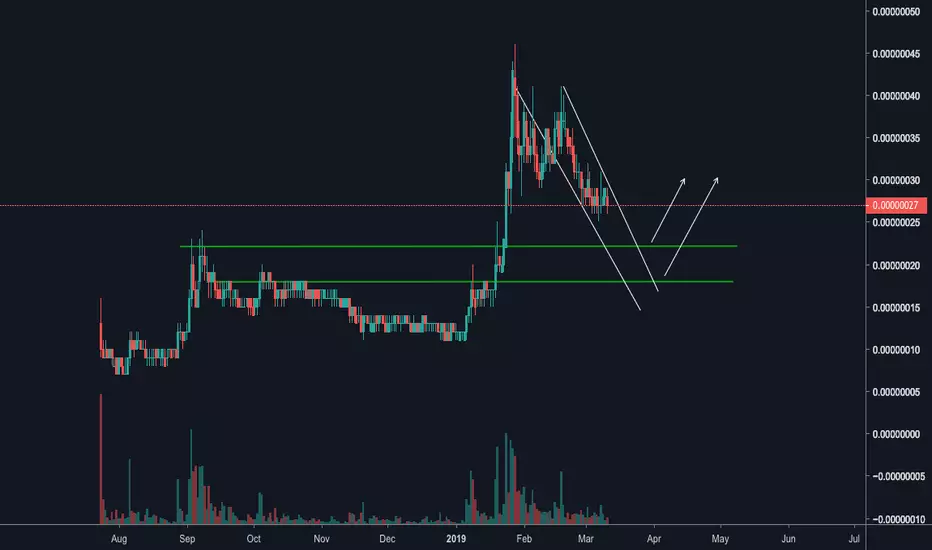
HOT - Are you done correcting?Not financial advice. Do your own research. The ideas shared here are the personal opinions of the BitDoctor team. Trade at your risk.
About 2 or 3 weeks ago I shared an idea that HOT was going to correct down to 24 satoshis and at the time it was at 33 on a retrace. At the time I said there was more upside to the corrective move (and there was) but since then we're in a slow bleed down to... guess where? We're at 25 right now and I still think 24 is in the cards.
Here are the scenarios:
1. Buy at 24 or 25 but keep a very tight stop at 23. More than likely you can close at 24 with a stop trigger at 23 with the way charts are moving.
2. If 24 does break, we're going back to 18
The problem here is if we're in any kind of elliott wave, we can't break 24 and if we do then there's something else going on. Even though HOT has a trading history going back several months we're still in a price discovery phase. The volume for the last 2 weeks has been negative. I'm cautiously optimistic.
Trade safely friends!
<3 -CE-