HOT/USDT — Testing Demand Zone: Major Accumulation or Breakdown?📊 Overview
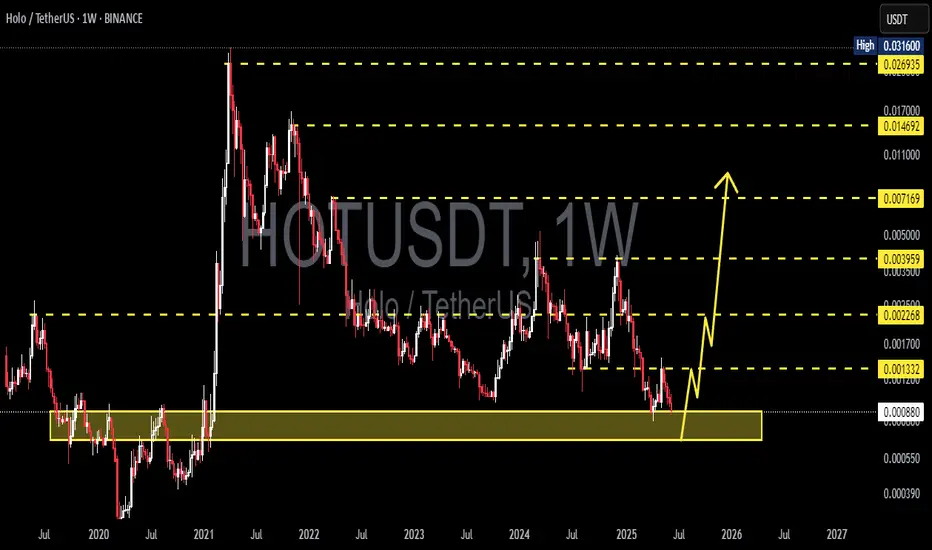
HOT (Holochain) is now trading at a multi-year demand zone that has been significant since 2019–2020. This zone is critical because:
1. It served as the launchpad for the massive 2021 rally.
2. It has been retested multiple times during extreme market downturns.
3. Price has returned to this area after more than 4 years — making it one of the most important levels in HOT’s price history.
In other words, the market is at a crossroads: will this demand zone trigger another rally, or finally break down and lead to new lows?
---
📌 Key Technical Levels
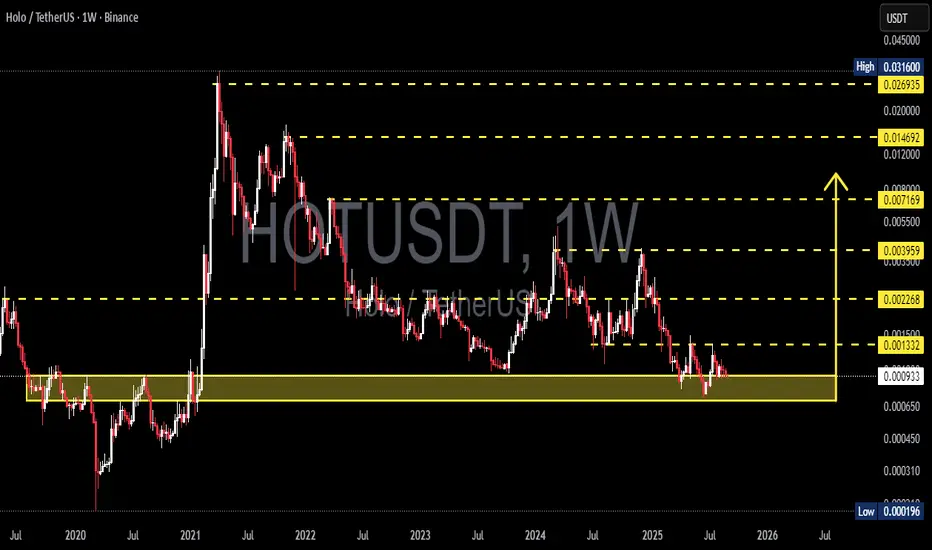
Current Price: ≈ 0.000932 USDT
Demand Zone (Historical Support): 0.00065 – 0.00120
Historical Low: 0.000196
Key Resistances:
R1: 0.001332
R2: 0.002268
R3: 0.003959
R4: 0.007169
R5: 0.014692
R6: 0.026935
R7 (ATH): 0.031600
---
📈 Bullish Scenario
1. A weekly close above the demand zone signals that buyers are still defending this key area.
2. A confirmed breakout and hold above 0.001332 would mark the first step of reversal.
3. Medium-term targets: 0.002268 → 0.003959.
4. Stronger breakouts could open the path toward 0.007169 and even 0.014+ in a broader bull cycle.
➡️ In this case, the current zone may represent a long-term accumulation opportunity with significant upside potential.
---
📉 Bearish Scenario
1. If HOT closes weekly below 0.00065, the demand zone collapses.
2. This breakdown could trigger capitulation with the next target around the historical low of 0.000196.
3. Such a move would confirm long-term distribution, with sellers fully in control.
➡️ Traders must be cautious, as the downside risk remains large if this critical support fails.
---
🌀 Structure & Patterns
Macro Trend: Bearish since the 2021 peak with consistent lower highs.
Current Setup: Range accumulation within the demand zone; potential triple bottom or re-accumulation if strong rejection occurs.
Confirmation Needed: Weekly close and volume reaction will determine whether this is accumulation or a breakdown.
---
📌 Conclusion
HOT is at one of its most crucial levels in 5 years.
Bullish case: demand zone holds → possible rebound with upside targets up to 0.003959 and beyond.
Bearish case: breakdown below 0.00065 → risk of capitulation toward 0.000196.
Key focus for traders/investors right now: Watch the weekly close + volume confirmation to validate the next move.
---
#HOT #HOTUSDT #Holo #Crypto #Altcoin #CryptoTrading #Accumulation #SupportResistance #TechnicalAnalysis
Hotusdtbuy
#HOT/USDT#HOT
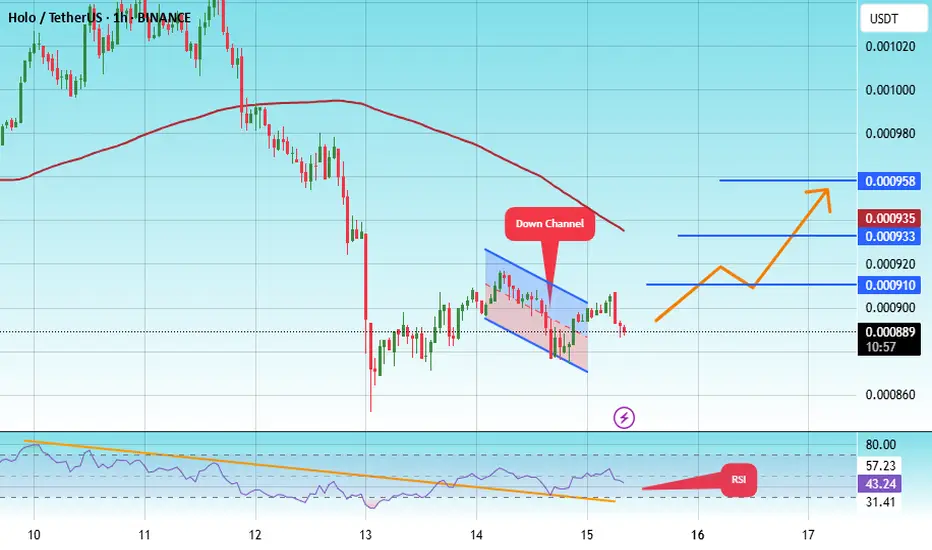
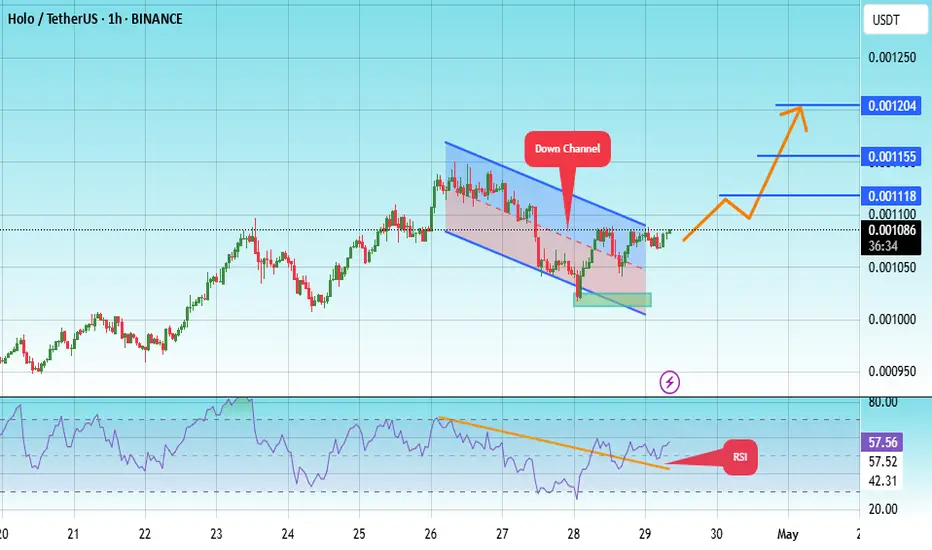
The price is moving within a descending channel on the 1-hour frame, adhering well to it, and is heading for a strong breakout and retest.
We are experiencing a rebound from the lower boundary of the descending channel. This support is at 000873.
We are experiencing a downtrend on the RSI indicator, which is about to break and retest, supporting the upward trend.
We are in a trend of consolidation above the 100 moving average.
Entry price: 0.000888
First target: 0.000910
Second target: 0.000933
Third target: 0.000958
HOT/USDT Breakout Confirmation or Bull Trap? Critical Retest!🧠 In-Depth Technical Breakdown (Daily Timeframe):
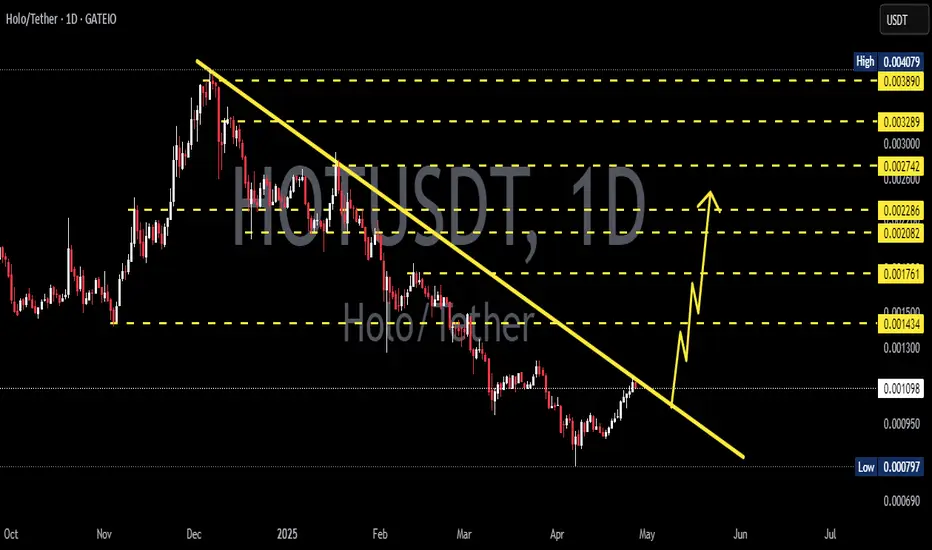
HOT/USDT (Holo vs Tether) is currently at a crucial inflection point, following a confirmed breakout from a long-standing downtrend. The price is now retesting a major demand zone, and how it reacts here will determine its next big move.
Let’s dive deeper into the technical structure, chart patterns, and the possible bullish and bearish scenarios:
---
🔻 1. Trend Structure & Major Breakout
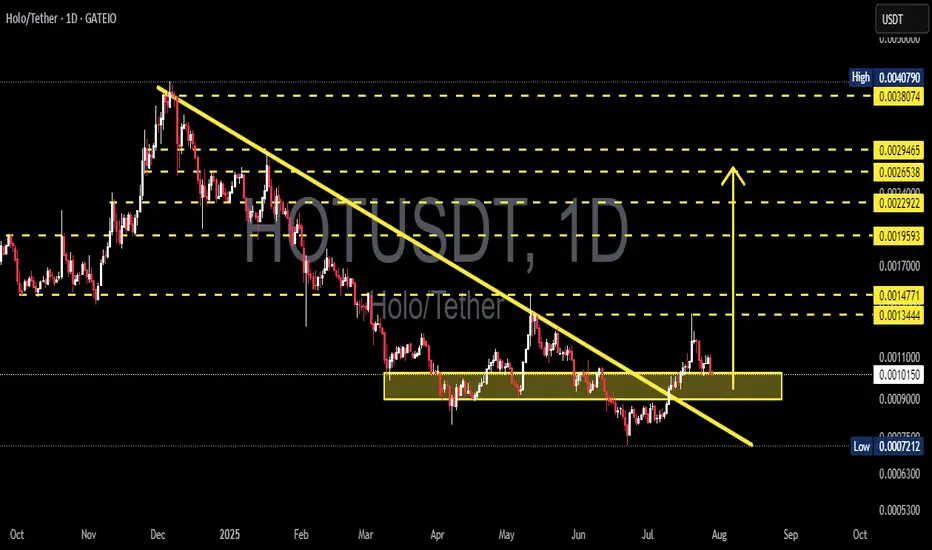
Since peaking in late December 2024, HOT/USDT was trapped in a descending trendline (yellow diagonal line).
In mid-July 2025, price successfully broke above this downtrend, signaling a potential trend reversal.
This breakout suggests a shift in market sentiment from bearish to neutral-to-bullish.
---
🟨 2. Retesting the Key Demand Zone (Support Flip)
Price is currently testing a critical demand/support zone between 0.00090 – 0.00110 USDT (highlighted in the yellow box).
This area served as a major consolidation base in the past and is now being tested as support after the breakout.
A successful retest will validate the breakout and could spark a continuation to the upside.
---
📐 3. Chart Pattern: Falling Wedge Breakout
Price action clearly formed a Falling Wedge pattern, typically a bullish reversal setup.
The breakout from the wedge confirms bullish momentum and the potential start of a new trend.
---
🔮 4. Price Scenarios Moving Forward
✅ Bullish Scenario:
If the price holds above the 0.00090–0.00100 zone:
1. Potential upside targets:
TP1: 0.00134 (minor resistance)
TP2: 0.00147 (key structural level)
TP3: 0.00159 (breakout continuation zone)
TP4: 0.00229 – 0.00246 (historical range highs)
TP5: 0.00380 – 0.00407 (major highs from previous cycle)
2. This structure could mark the beginning of a higher low + higher high uptrend, if confirmed.
❌ Bearish Scenario:
If the price breaks below 0.00090 with strong volume:
1. Likely a return to previous support at:
0.00072 USDT (historical low and major support level).
2. This would invalidate the breakout and possibly confirm a bull trap, resuming the downtrend.
---
🧩 Other Key Technical Notes (Not Shown in Chart but Useful):
Volume: Look for high volume on the breakout and retest to confirm validity.
RSI/Divergence: Check for hidden or bullish divergence on the last swing low.
EMA 50/200: If price crosses or holds above these EMAs, it adds further confirmation of trend reversal.
---
📊 Summary & Trading Strategy:
HOT/USDT is in a critical phase of retesting a major breakout, offering traders a great opportunity to either buy the dip or wait for confirmation.
Suggested Strategy:
Conservative Entry: Wait for a bullish candle close above 0.00100 with strong rejection from the support zone.
Aggressive Entry: Buy near 0.00090–0.00100 with a tight stop loss below 0.00087.
Use resistance levels for scaling out profits or setting targets.
#HOTUSDT #HoloToken #AltcoinAnalysis #CryptoBreakout #TechnicalAnalysis #ChartPattern #BullishReversal #FallingWedge #SupportZone #CryptoTA
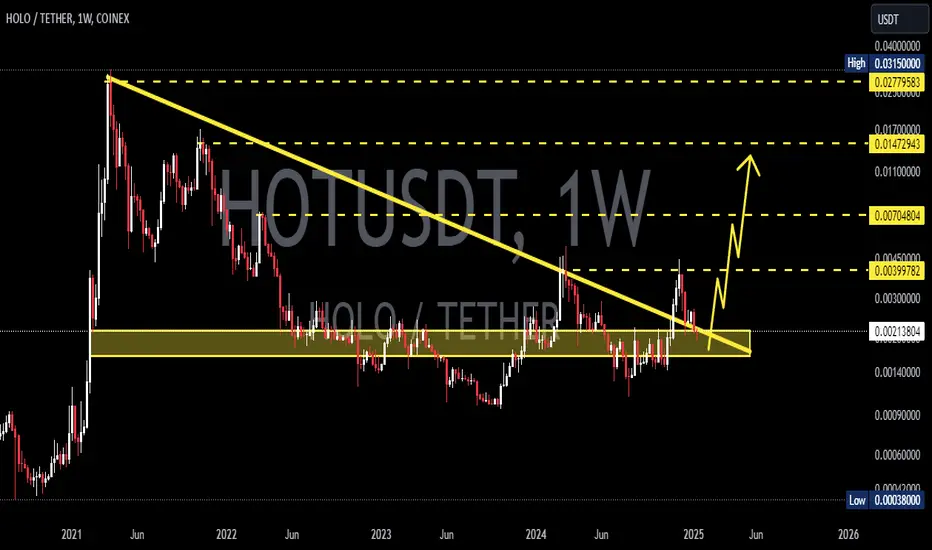
HOTUSDT 1W AnalysisHOT ~ 1W Analysis
#HOT Buy gradually from here if you still have confidence in this coin with a short term target of at least 20%+ from this support block.
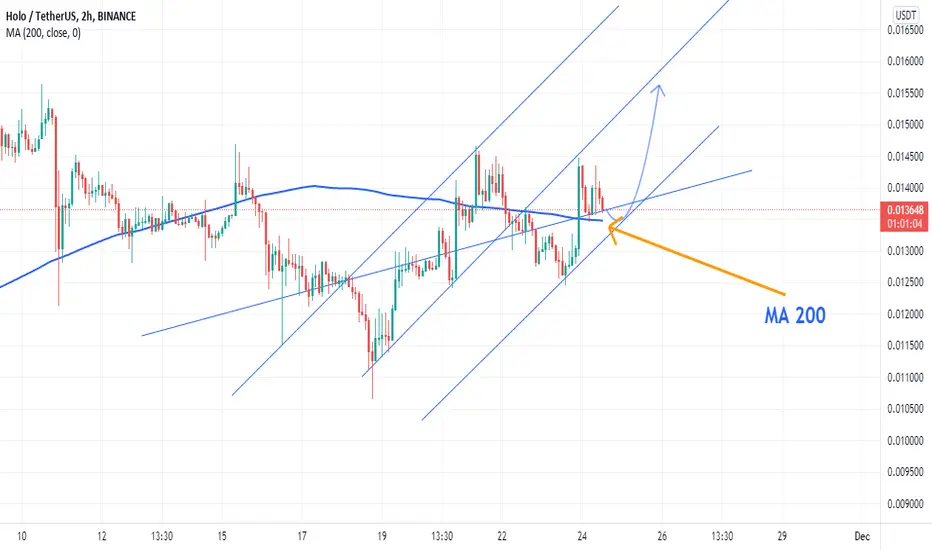
#HOT/USDT#HOT
The price is moving within a descending channel on the 1-hour frame, adhering well to it, and is on its way to breaking it strongly upwards and retesting it.
We are seeing a bounce from the lower boundary of the descending channel, this support at 0.01018.
We have a downtrend on the RSI indicator that is about to break and retest, supporting the upward trend.
We are looking for stability above the 100 moving average.
Entry price: 0.01086
First target: 0.001118
Second target: 0.001155
Third target: 0.001200
HOTUSDT 1D AnalysisHOT ~ 1D Analysis
#HOT Buy after successfully penetrating this resistant line with a short -term target of at least 10%+ from here.
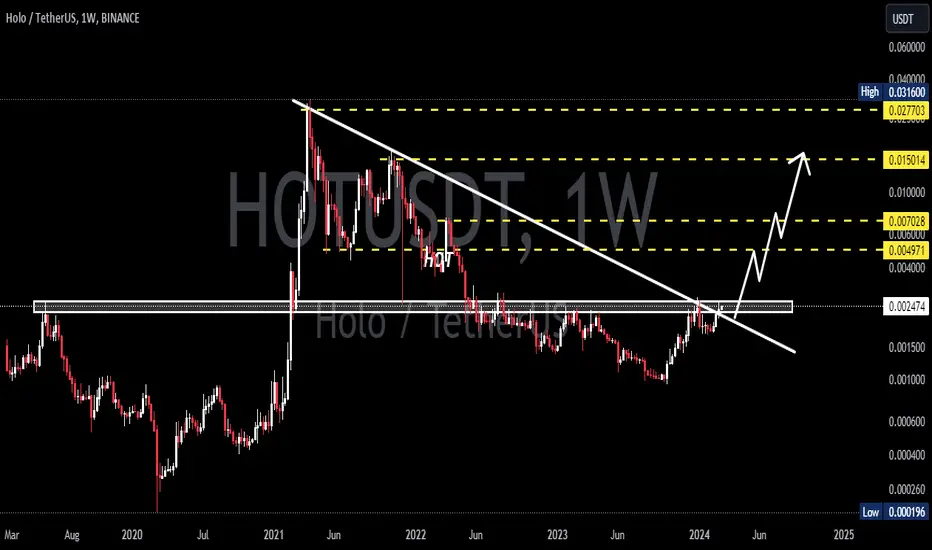
HOTUSDT 1WHOT ~ 1W Analysis
#HOT Buy gradually from here if you still have a Conviction on this coin with a short -term target of at least 20%+.

HOTUSDT 1WHOT ~ 1W Analysis
#HOT This support has been maintained so far. Buy from here if you still have a Conviction on this coin with a minimum target of 20%+

HOTUSDT 1WHOT ~ 1W
#HOT If you still have Conviction on this coin,. This support block would be a very good buying place for now,. Buy in stages with a target of 20%+
#HOT/USDT#HOT
The price is moving in a descending channel on the 4-hour frame and is sticking to it very well and is expected to break it upwards
We have a bounce from a major support area in green at 0.001300
We have a downtrend on the RSI indicator that was broken upwards which supports the rise
We have a trend to stabilize above the 100 moving average which supports the rise
Entry price 0.001540
First target 0.001700
Second target 0.001850
Third target 0.002030

HOTUSD 1WLSE:HOT ~ 1W
#HOT Successfully Breaking this Resistance Line, Bulls Seem to be Taking Control, Buy Gradually from Here, Target at least 20%++
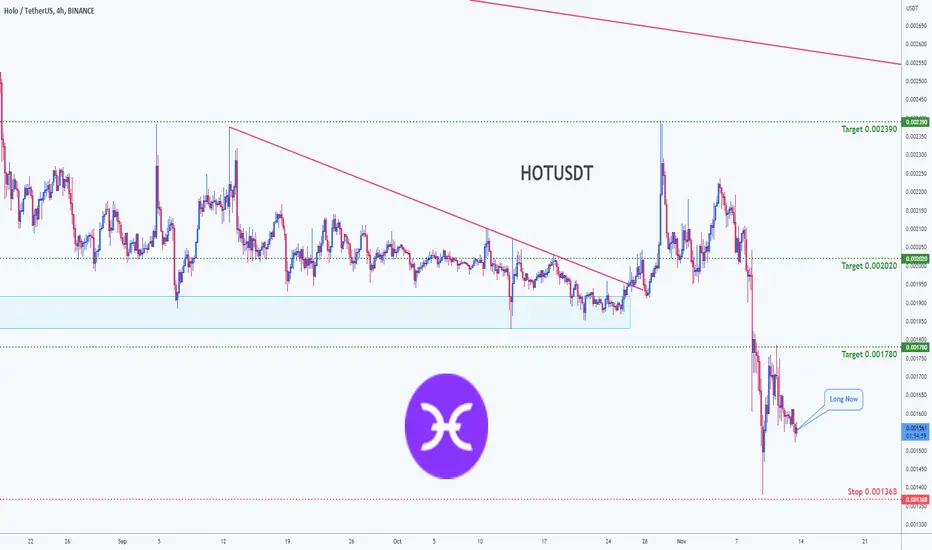
Trading opportunity for HOTUSDT HoloBased on technical factors there is a Long position in :
📊 HOTUSDT
🔵 Long Now 0.001557
🧯 Stop loss 0.001368
🏹 Target 1 0.001780
🏹 Target 2 0.002020
🏹 Target 3 0.002390
💸RISK : 1%
We hope it is profitable for you ❤️
Please support our activity with your likes👍 and comments📝
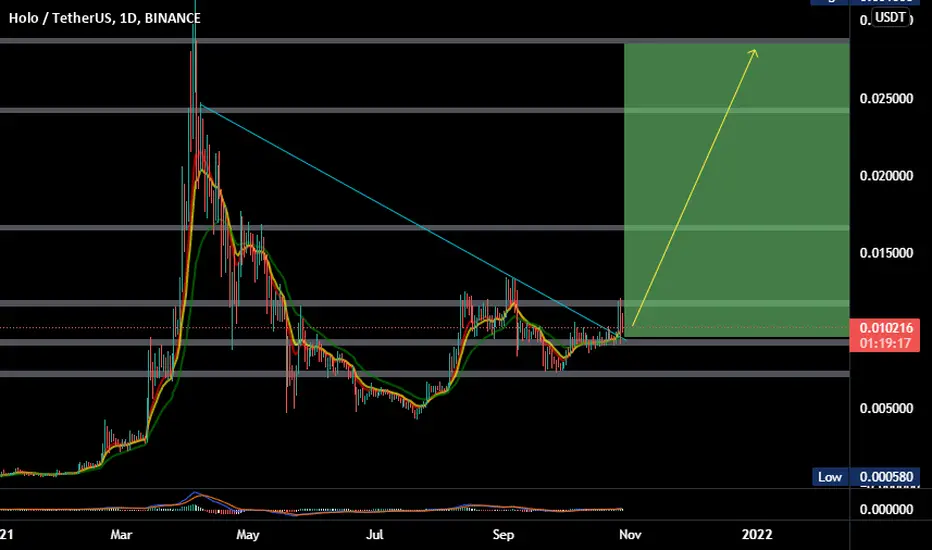
HOT about to MAKE A BIG MOVE!Hello, I am back with an idea on HOTUSDT pair, time frame 1 day. HOT for an entire year has been following a descending triangle for an entire year now that has held a strong support in the area between 0.004-0.0045. This pattern very soon can trigger a big movement, either a reversal or a follow up to the downtrend. But at the moment, to me it looks as a good entry either way following the trade with a SL in the area below 0.004.
1st Scenario - it is usually the scenario I think has more chances of happening. Looking at the daily RSI, the pattern feels ready for a small breakout of the falling wedge leading to a near 100% (dependable on the entire market movement) as generally I see a small bullish trend near March for most coins(likely altcoins). This move could be followed by a 300% move from where we are now if it break the triangle. Always look for breakout areas out of the pattern.
2nd scenario- BTC is following up with my analysis which I expect one last drop. Due to that drop, a fakeout can happen and a wick can be see formed lower than the support. However I see HOT not going lower than 0.003, and if we lose that no lower than 0.002 and from there a consolidation could take place. And then HOT can enter the triangle again.
A reminder, follow the breakout areas in either sides, but most likely we will see a huge breakout or wick very soon as the volume indicates that too. If you have any comment, you are welcome.
Trade safe, trade smart, and always use SL during this time. :)

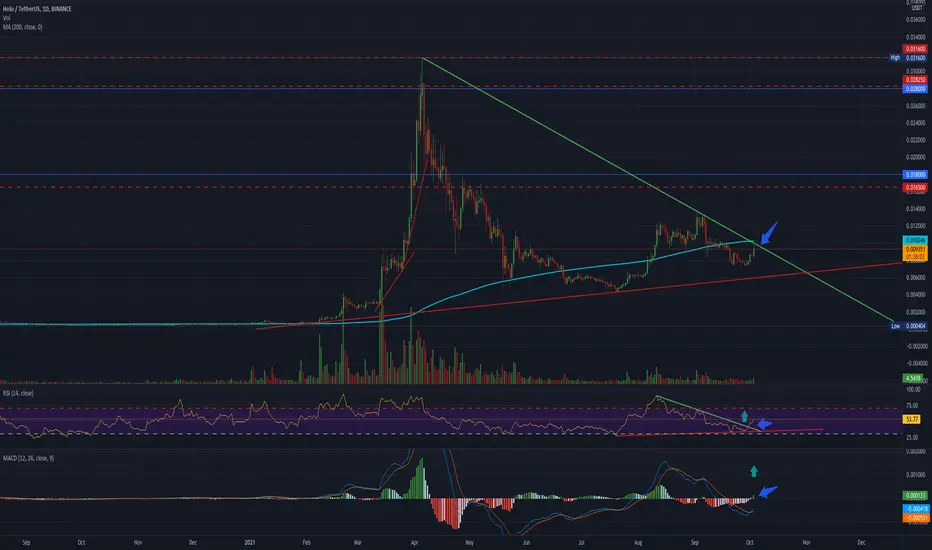
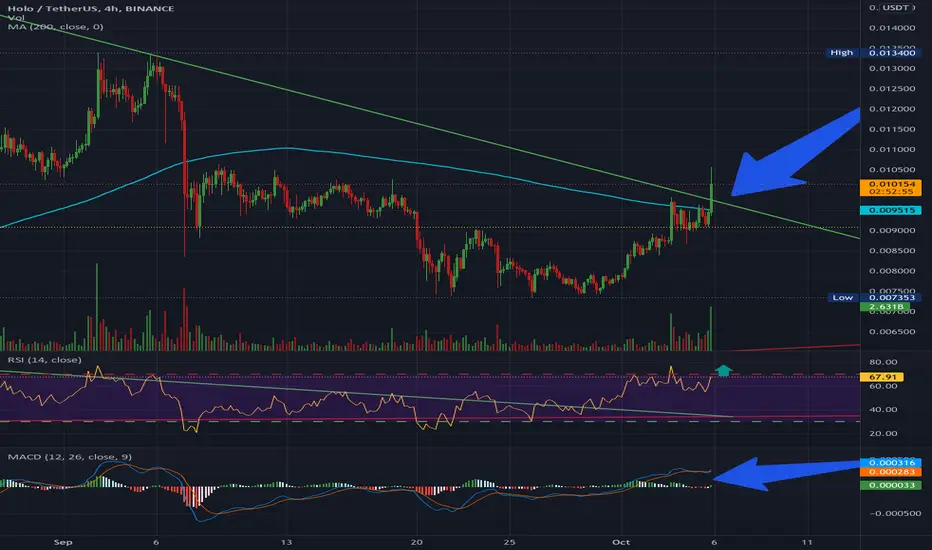
Holochain (HOT) looking to explode soonAnalysis of HOT/USDT chart. MACD indicator is starting to show positive momentum being built. RSI indicator shows how we have broke a downtrend while being positioned at a good mid-level of about 53%, ready to take off. If we break the downtrend on the daily chart, big green candles would be printed really fast in my opinion. Let's see what time will tell us.
Take Profit Levels (TPs):
1st = $0.01650
2nd = $0.02825
3rd = $0.03160
HOTUSDT setup | Holo buy signalHolo after forming a setup, prepares for an upward movement of up to 20%... Good luck
follow us on the new Page: Signalsfortrade
HOTUSDT setup | Holobuy signalHolo after forming a setup, prepares for an upward movement of up to 20%... Good luck
follow us on the new Page: Signalsfortrade
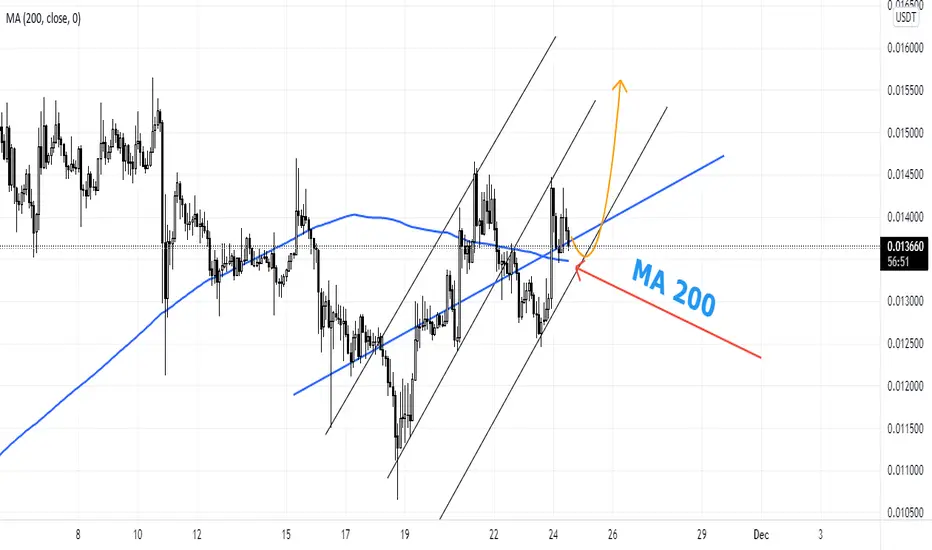
#HOT is in uptrend channel and ready to pump #HOT in it's #USDT pair is in an uptrend channel and retest the static and dynamic support line at the 0.010500 area and start moving again and broke out the strong static resistance at 0.013200
next resistance levels can be available targets for #HOLO

HOT/USDT aaaanddd we have a lift off!Take a look at how this beauty breaks resistance. Look at my previous HOT/USDT chart to see what the TP levels are.
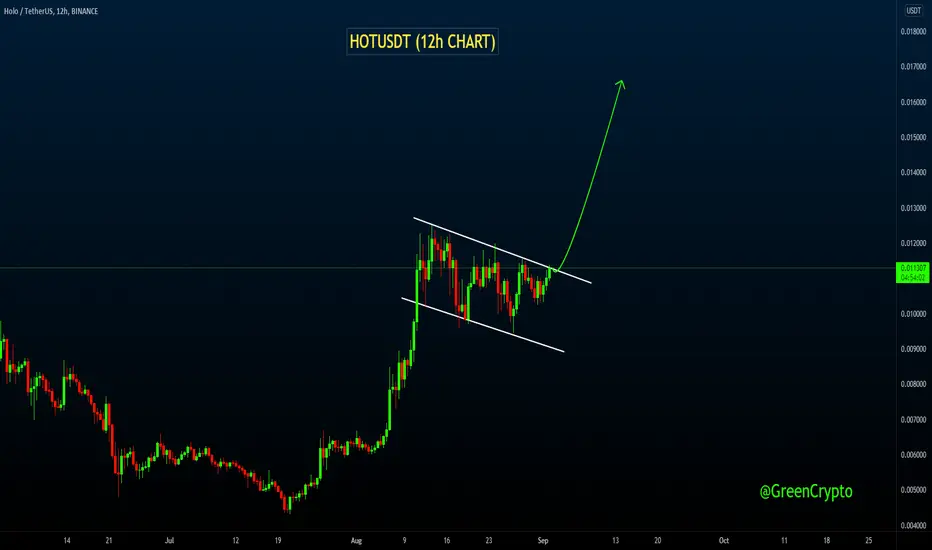
HOTUSDT (12h CHART) - Next Target!?HOTUSDT (12h CHART) Technical Analysis
Flag Pattern
HOT/USDT (12h CHART) currently trading at $0.0112
Buy-level: Above $0.0113
Stop loss: Below $0.0096
Target 1: $0.0122
Target 2: $0.0130
Target 3: $0.0145
Target 4: $0.0166
Max Leverage: 2X
ALWAYS KEEP STOP LOSS...
Follow Our Tradingview Account for More Technical Analysis Updates, | Like, Share and Comment Your thoughts.