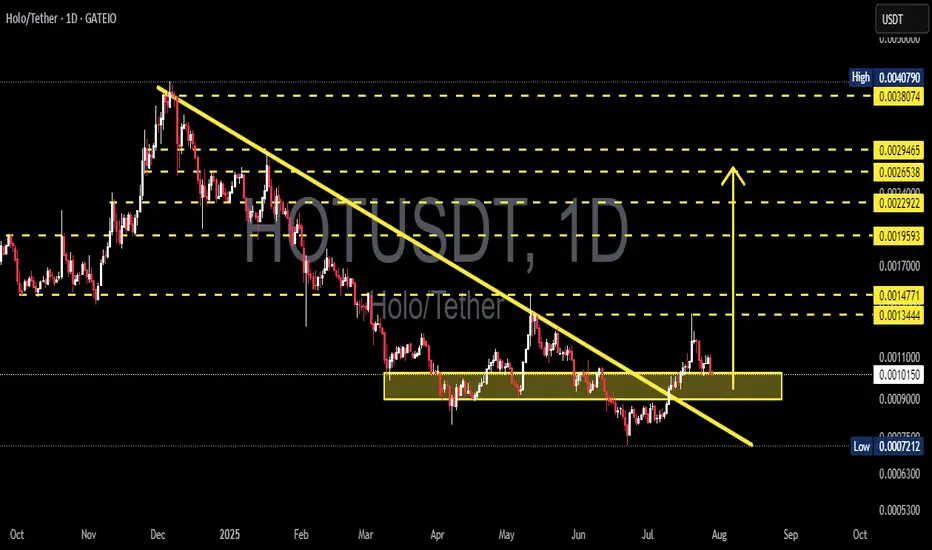
HOT/USDT Breakout Confirmation or Bull Trap? Critical Retest!🧠 In-Depth Technical Breakdown (Daily Timeframe):
HOT/USDT (Holo vs Tether) is currently at a crucial inflection point, following a confirmed breakout from a long-standing downtrend. The price is now retesting a major demand zone, and how it reacts here will determine its next big move.
Let’s dive deeper into the technical structure, chart patterns, and the possible bullish and bearish scenarios:
---
🔻 1. Trend Structure & Major Breakout
Since peaking in late December 2024, HOT/USDT was trapped in a descending trendline (yellow diagonal line).
In mid-July 2025, price successfully broke above this downtrend, signaling a potential trend reversal.
This breakout suggests a shift in market sentiment from bearish to neutral-to-bullish.
---
🟨 2. Retesting the Key Demand Zone (Support Flip)
Price is currently testing a critical demand/support zone between 0.00090 – 0.00110 USDT (highlighted in the yellow box).
This area served as a major consolidation base in the past and is now being tested as support after the breakout.
A successful retest will validate the breakout and could spark a continuation to the upside.
---
📐 3. Chart Pattern: Falling Wedge Breakout
Price action clearly formed a Falling Wedge pattern, typically a bullish reversal setup.
The breakout from the wedge confirms bullish momentum and the potential start of a new trend.
---
🔮 4. Price Scenarios Moving Forward
✅ Bullish Scenario:
If the price holds above the 0.00090–0.00100 zone:
1. Potential upside targets:
TP1: 0.00134 (minor resistance)
TP2: 0.00147 (key structural level)
TP3: 0.00159 (breakout continuation zone)
TP4: 0.00229 – 0.00246 (historical range highs)
TP5: 0.00380 – 0.00407 (major highs from previous cycle)
2. This structure could mark the beginning of a higher low + higher high uptrend, if confirmed.
❌ Bearish Scenario:
If the price breaks below 0.00090 with strong volume:
1. Likely a return to previous support at:
0.00072 USDT (historical low and major support level).
2. This would invalidate the breakout and possibly confirm a bull trap, resuming the downtrend.
---
🧩 Other Key Technical Notes (Not Shown in Chart but Useful):
Volume: Look for high volume on the breakout and retest to confirm validity.
RSI/Divergence: Check for hidden or bullish divergence on the last swing low.
EMA 50/200: If price crosses or holds above these EMAs, it adds further confirmation of trend reversal.
---
📊 Summary & Trading Strategy:
HOT/USDT is in a critical phase of retesting a major breakout, offering traders a great opportunity to either buy the dip or wait for confirmation.
Suggested Strategy:
Conservative Entry: Wait for a bullish candle close above 0.00100 with strong rejection from the support zone.
Aggressive Entry: Buy near 0.00090–0.00100 with a tight stop loss below 0.00087.
Use resistance levels for scaling out profits or setting targets.
#HOTUSDT #HoloToken #AltcoinAnalysis #CryptoBreakout #TechnicalAnalysis #ChartPattern #BullishReversal #FallingWedge #SupportZone #CryptoTA
Hotusdtidea
HOTUSDT 1W AnalysisHOT ~ 1W Analysis
#HOT Buy gradually from here if you still have confidence in this coin with a short term target of at least 20%+ from this support block.
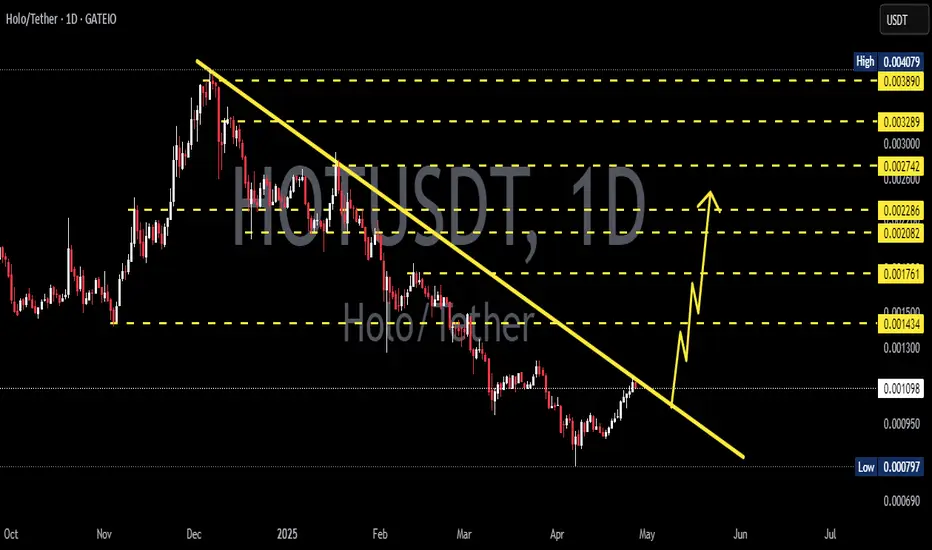
HOTUSDT 1D AnalysisHOT ~ 1D Analysis
#HOT Buy after successfully penetrating this resistant line with a short -term target of at least 10%+ from here.
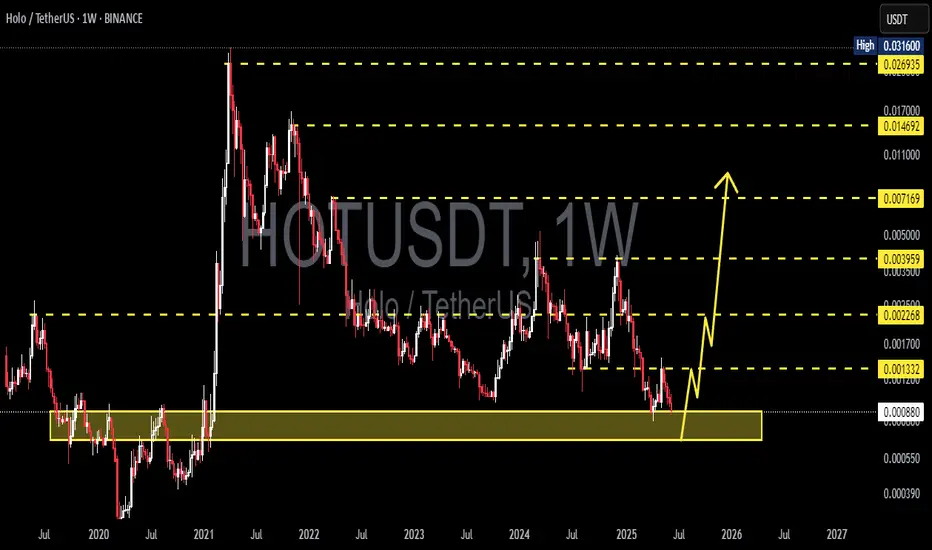
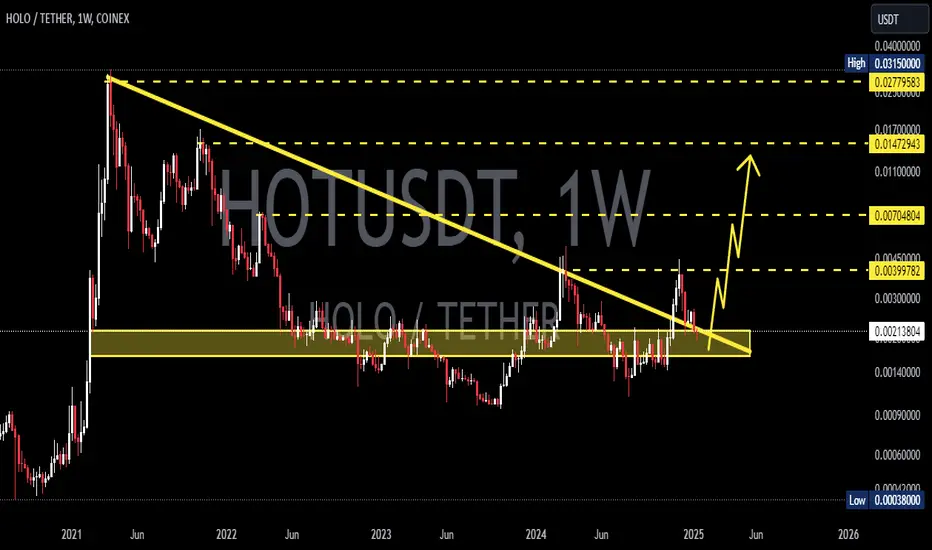
HOTUSDT 1WHOT ~ 1W Analysis
#HOT Buy gradually from here if you still have a Conviction on this coin with a short -term target of at least 20%+.

HOTUSDT 1WHOT ~ 1W Analysis
#HOT This support has been maintained so far. Buy from here if you still have a Conviction on this coin with a minimum target of 20%+

HOTUSDT 1WHOT ~ 1W
#HOT If you still have Conviction on this coin,. This support block would be a very good buying place for now,. Buy in stages with a target of 20%+
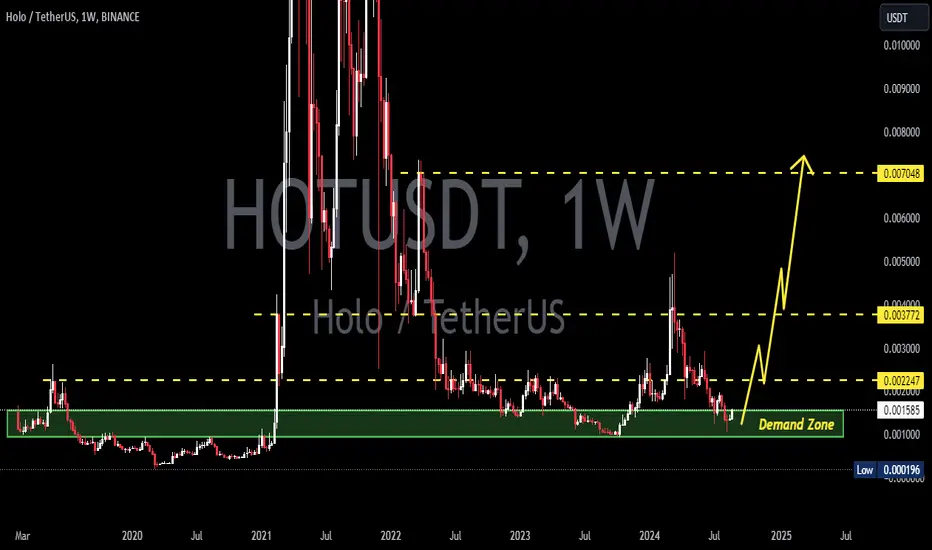
HOTUSDTHOT ~ 1W
#HOT demand zone that you might need to pay attention to to start buying if you have Conviction on this NASDAQ:COIN
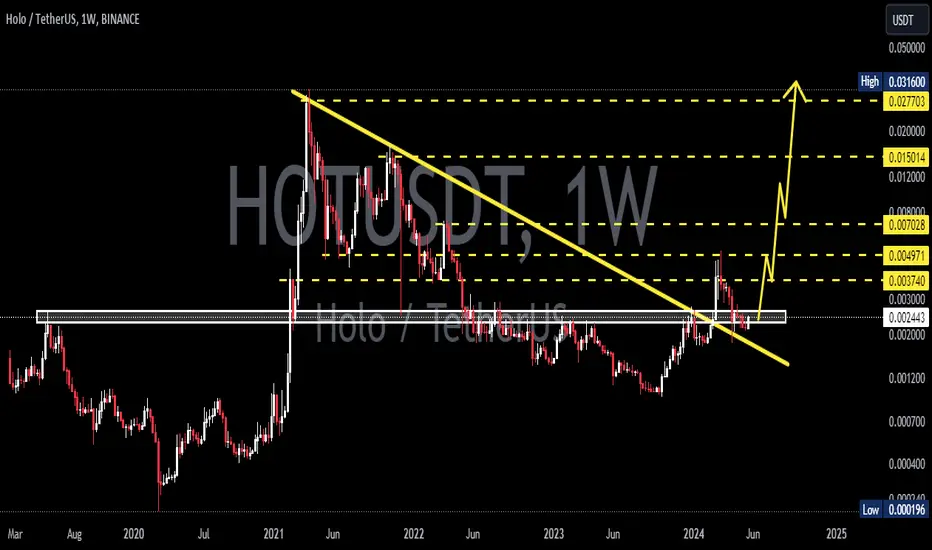
HOTUSD 1WHOT ~ 1W
#HOT Retesting this Support Line has been successful.
Make purchases gradually starting from here. The bulls will start to push the price to continue rising.
HOTUSDT Analysis (LOCAL VISION)Hello friends.
Please support my work by clicking the LIKE button👍(If you liked). Also i will appreciate for ur activity. Thank you!
Everything on the chart.
Entry: market and lower
Target: 0.0055 - 0.0063 - 0.0072
Stop: ~0.0037 (depending of ur risk). ALWAYS follow ur RM .
after first target reached move ur stop to breakeven
Risk/Reward: 1 to 4
risk is justified
Good luck everyone!
Follow me on TRADINGView, if you don't want to miss my next analysis or signals.
It's not financial advice.
Dont Forget, always make your own research before to trade my ideas!
Open to any questions and suggestions.

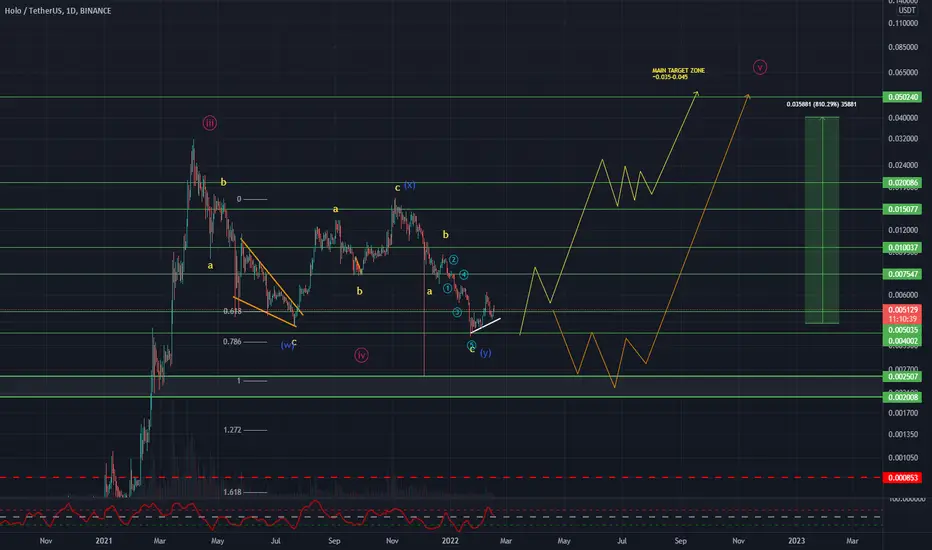
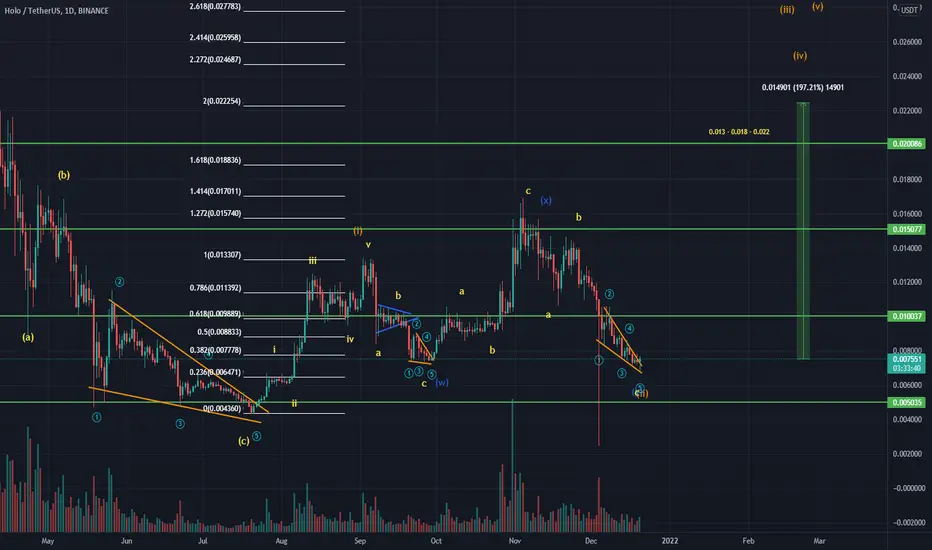
HOTUSDT WAVE Analysis (GLOBAL VISION)Hello friends.
Please support my work by clicking the LIKE button👍 (If you liked).Thank you!
Everything on the chart.
Globally we're in double zigzag (wxy) wave of (IV).
Waiting for an upward movement either from the current price, or through a small update of the last low (will depend on #BTC).
Entry: market and lower
MAIN TARGET ZONE AT THE END OF BULL RUN: 0.035 - 0.045$
Stop: (depending of ur risk). ALWAYS follow ur RM .
cancellation of growth,consolidation below ~0.001$
Risk is justified.
Good luck everyone!
Follow me on TRADINGView, if you don't want to miss my next analysis or signals.
It's not financial advice.
Dont Forget, always make your own research before to trade my ideas!
Open to any questions and suggestions.
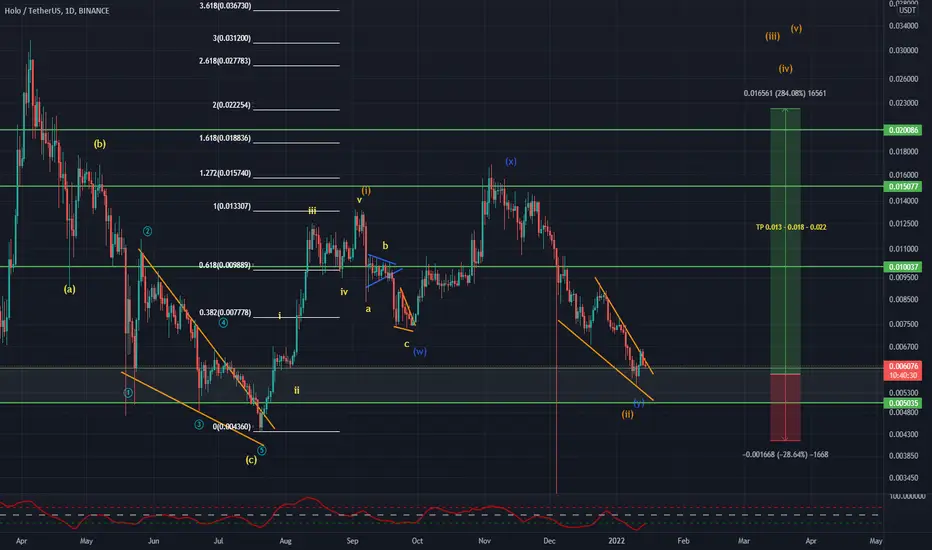
HOTUSDT Analysis (HUGE BULLISH POTENTIAL)Hello friends.
Please support my work by clicking the LIKE button👍(If you liked). Also i will appreciate for ur activity. Thank you!
Everything on the chart.
Nothing has changed from my last idea.
Entry: market and lower
Target: 0.013 - 0.018 - 0.022
after first target reached move ur stop to breakeven
Stop: (depending of ur risk). ALWAYS follow ur RM .
cancellation of growth, consolidation below 0.0043
Risk/Reward: 1 to 10
risk is justified
Good luck everyone!
Follow me on TRADINGView, if you don't want to miss my next analysis or signals.
It's not financial advice.
Dont Forget, always make your own research before to trade my ideas!
Open to any questions and suggestions.
HOTUSDT Analysis (x2 potential from here)Hello friends.
Please support my work by clicking the LIKE button(If you liked).Thank you!
Everything on the chart.
open pos: market and lower
target: 0.013 - 0.018 - 0.022
after first target reached move ur stop to breakeven
cancellation of growth, consolidation below 0.005
stop: im w/o stop (depending of ur risk). ALWAYS follow ur RM .
risk is justified
Good luck everyone!
Follow me on TRADINGView, if you don't want to miss my next analysis or signals.
It's not financial advice.
Dont Forget, always make your own research before to trade my ideas!
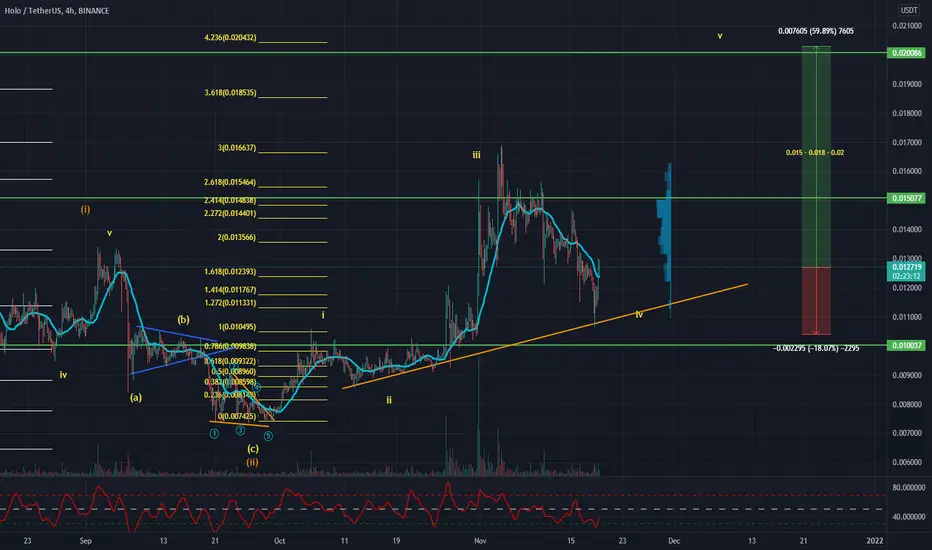
HOTUSDT AnalysisHello friends.
Please support my work by clicking the LIKE button(If you liked).Thank you!
Everything on the chart.
open pos: market and lower
target: 0.015 - 0.018 - 0.02
after first target reached move ur stop to breakeven
stop: ~under 0.01(depending of ur risk). ALWAYS follow ur RM .
risk/reward 1 to 3
risk is justified
Good luck everyone!
Follow me on TRADINGView, if you don't want to miss my next analysis or signals.
It's not financial advice.
Dont Forget, always make your own research before to trade my ideas!
Open to your questions or suggestions.
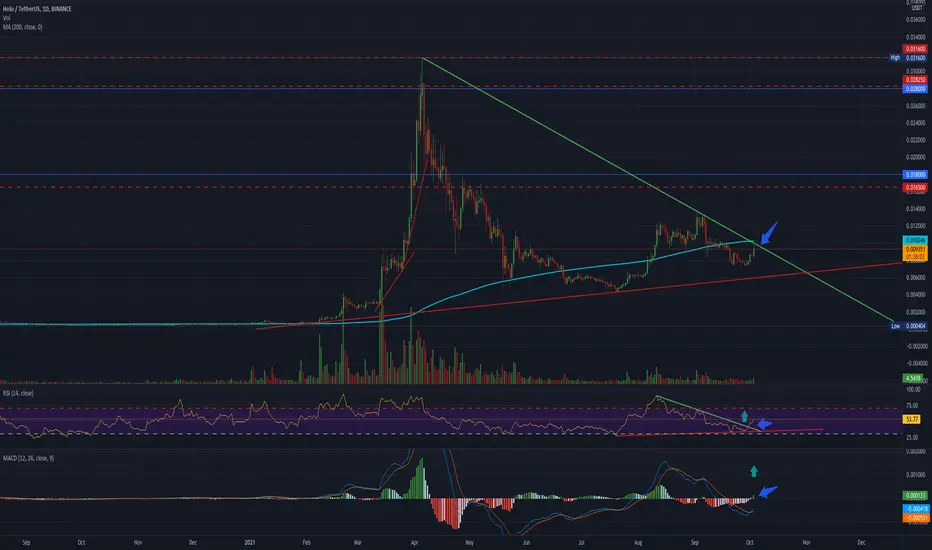
Holochain (HOT) looking to explode soonAnalysis of HOT/USDT chart. MACD indicator is starting to show positive momentum being built. RSI indicator shows how we have broke a downtrend while being positioned at a good mid-level of about 53%, ready to take off. If we break the downtrend on the daily chart, big green candles would be printed really fast in my opinion. Let's see what time will tell us.
Take Profit Levels (TPs):
1st = $0.01650
2nd = $0.02825
3rd = $0.03160
HOTUSDT setup | Holo buy signalHolo after forming a setup, prepares for an upward movement of up to 20%... Good luck
follow us on the new Page: Signalsfortrade
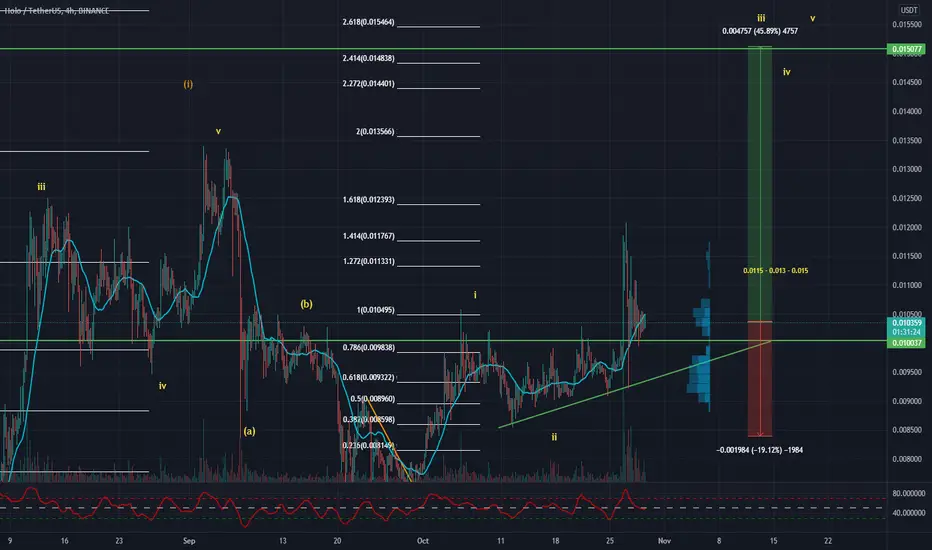
HOTUSDT AnalysisHello friends.
Please support my work by clicking the LIKE button(If you liked).Thank you!
Everything on the chart.
open pos: market and lower
target: 0.0115 - 0.013 - 0.015
after first target reached move ur stop to breakeven
stop: ~0.0083 (depending of ur risk). ALWAYS follow ur RM .
risk/reward 1 to 3
risk is justified
Good luck everyone!
Follow me on TRADINGView, if you don't want to miss my next analysis or signals.
It's not financial advice.
Dont Forget, always make your own research before to trade my ideas!
Will be very APPRECIATE FOR UR DONAT/coins :)
Open to your questions or suggestions(Looking for investors!).