AMMN - POWER PLAYI bought my positions today
September 29, 2023
The reasons:
1. Low-risk entry with a crisp pivot point
2. The stock is up >100% in less than 8 weeks
3. Corrected the least during the pause, less than 25% correction
4. Volume dries up as a sign of less supply coming to the market
5. Good close and decent volume on the breakout
6. A high alpha stock with a low standard deviation
7. One of the leaders in this market environment
The flaw:
The market is still in a hard-penny environment with only 36% of total stocks above the 200-day MA.
This is a Velocity Play of a current IPO stock. I expect to see some positive price action in the upcoming days.
HTF

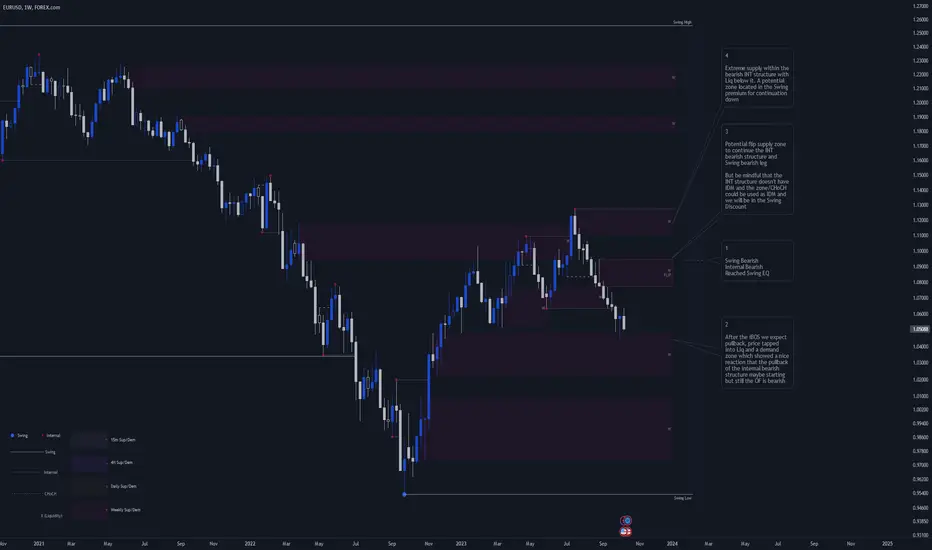
EURUSD 16-20 Oct 2023 Weekly AnalysisThis is my Weekly analysis on EURUSD for 16-20 Oct 2023 based on Smart Money Concept (SMC) which includes the following Time Frames:
Weekly
Daily
4H
Weekly
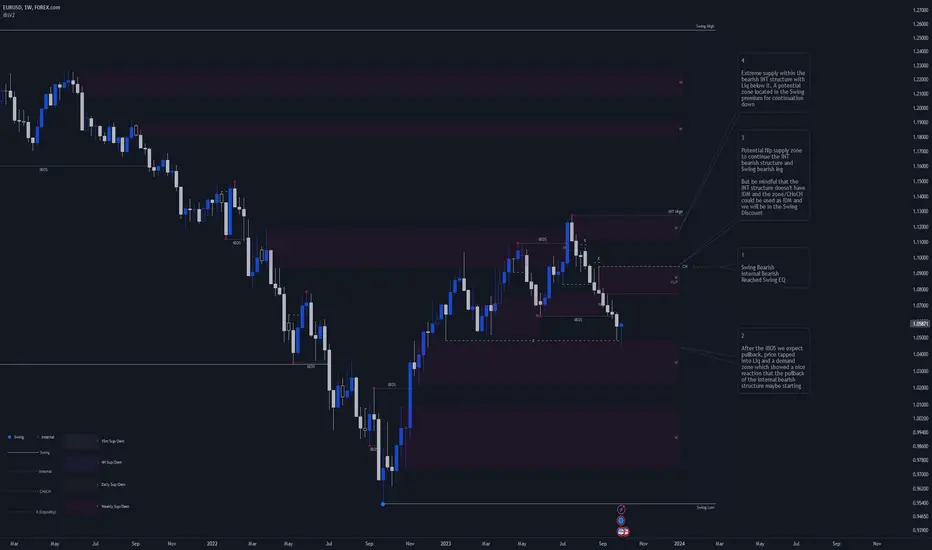
1.
Swing Bearish
Internal Bearish
Reached Swing EQ
2.
After the iBOS we expect pullback, price tapped into Liq and a demand zone which showed a nice reaction that the pullback of the internal bearish structure maybe starting but still the OF is bearish
3.
Potential flip supply zone to continue the INT bearish structure and Swing bearish leg
But be mindful that the INT structure doesn't have IDM and the zone/CHoCH could be used as IDM and we will be in the Swing Discount
4.
Extreme supply within the bearish INT structure with Liq below it. A potential zone located in the Swing premium for continuation down
Daily
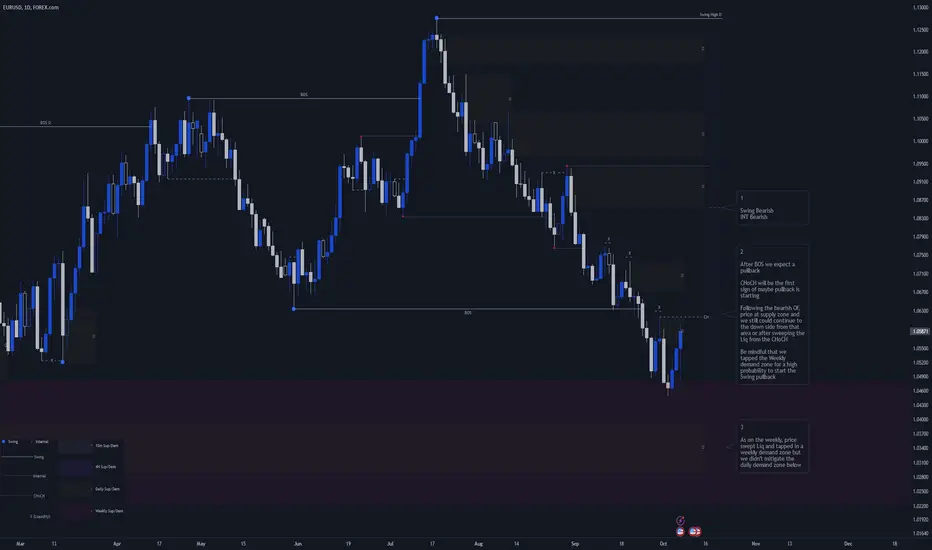
1.
Swing Bearish
INT Bearish
2.
After BOS we expect a pullback
CHoCH will be the first sign of maybe pullback is starting and yesterday price did a CHoCH confirming INT Low formation.
OF still bearish so we don't have confirmation yet that we are starting the pullback for the recent Bearish BOS
3.
As on the weekly, price swept Liq and tapped in a weekly demand zone but we didn't mitigate the daily demand zone below
Daily
1.
Swing Bullish
INT Bearish
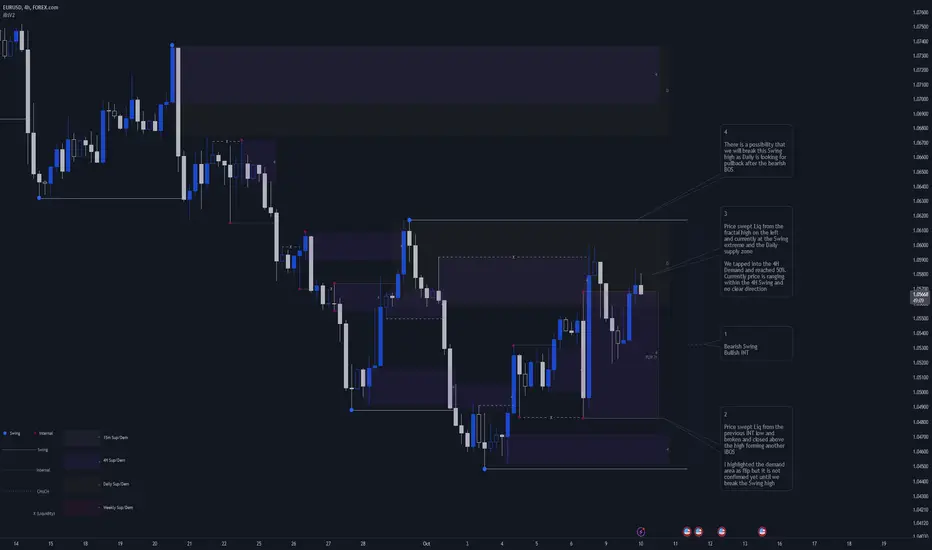
1.
Swing Bullish
INT Bearish
2.
Price swept Liq from the previous INT low and broken and closed above the high forming another iBOS
3.
Price made a Bullish Swing BOS and we expecting after a break of structure a Swing pullback
As price turned bearish, and reached EQ, our expectations now that Demand zones in Discount will provide a good opportunity for longs
4.
Daily and 4H Supply zone that current price action is targeting and could provide reaction for shorts opportunity using Entry Model with LTF confirmation
5.
Price could be targeting the Liq. below the 4H previous INT Low above the 4H extreme demand zone for longs
BTC: BIG PICTURE!!Hello everyone, if you like the idea, do not forget to support it with a like and follow.
Welcome to this important BTC update.
BTC is ranging between FWB:25K -$30k for more than 200 days and currently, it is trading around $26.7k level.
Now, one of the biggest questions in everyone's mind is where we are heading after these 2 years
of the bear market. I'll try to explain in this post.
BTC made a low of $15.5k last year in Nov. month and Imo we won't see that level again. As you know halving is after 6 months and before that, we might see a drop up to FWB:23K -$24k (as you see in the chart).
Perma Bears wants a new low or big crash before the halving and Perma Bulls wants a continuous pump from here but IMO market maker disappoint both of them.
I'm betting on a move towards $ 23.5k-$ 24.5k zone and then a move upwards (for a new uptrend).
Mind it that a wick can even go below $23.5k however weekly candle close will likely happen within this zone itself.
What do you think about this? Share your thoughts in the comment section.
Hope this chart helps you to take better trade decisions.
Thank You!

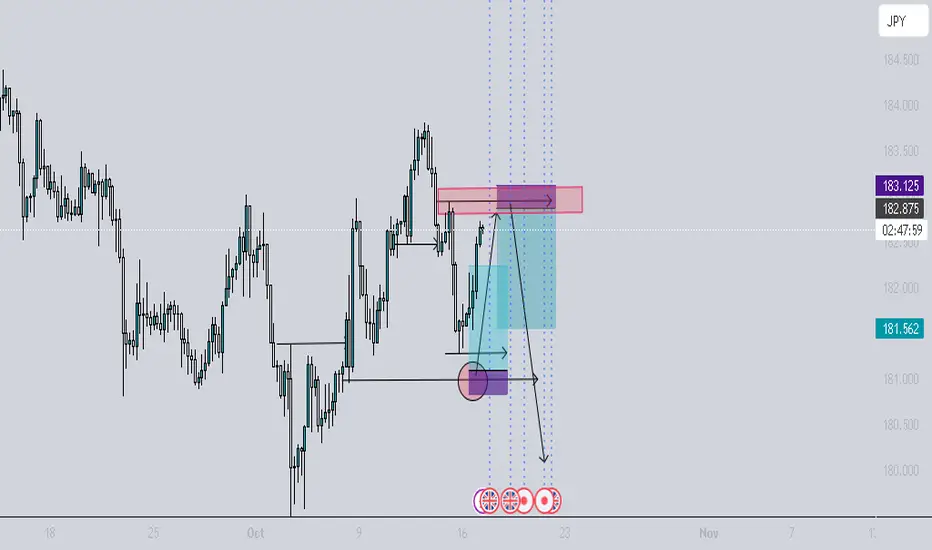
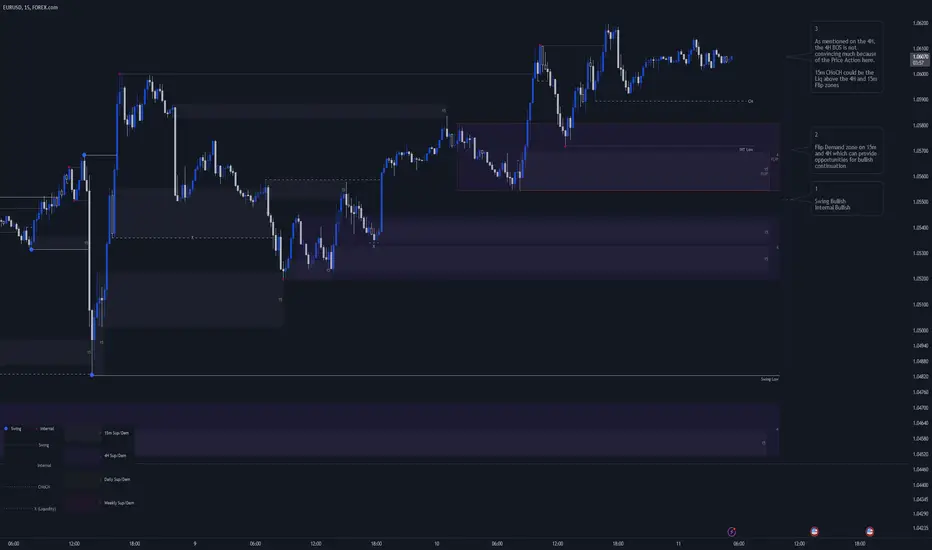
EURUSD 11 Oct 2023 Intraday AnalysisEURUSD 11 Oct 2023 Intraday Analysis
This is an intraday analysis for EURUSD on 15m chart based on Smart Money Concept (SMC)
Daily:
4H:
15m:
EURUSD 9-13 Oct 2023 - DailyEURUSD 9-13 Oct 2023 - Daily
This is a high level analysis for EURUSD on Daily chart based on Smart Money Concept (SMC)
EURUSD 10 Oct 2023 Intraday Analysis 4HEURUSD 10 Oct 2023 Intraday Analysis 4H
This is a high level analysis for EURUSD on 4H chart based on Smart Money Concept (SMC)
PANI - POWER PLAYI bought my positions today
September 25, 2023
The reasons:
1. Low-risk entry point
2. The stock is up >100% in less than 8 weeks
3. Corrected the least during the pause, less than 25% correction
4. Volume dries up as a sign of less supply coming to the market
5. High alpha stock with a low standard deviation
6. Good close on the breakout
The flaw:
The market is still in a hard-penny environment with only 36.7% of total stocks above the 200-day MA.
I'm still trading small with a pilot position until I see some trades work out fine.

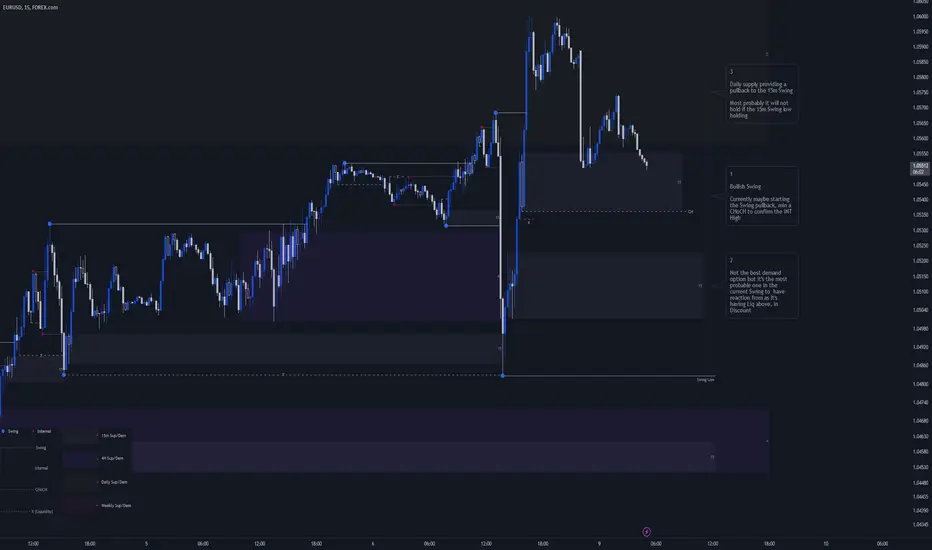
EURUSD 9 Oct 2023 Intraday Analysis 15mEURUSD 9 Oct 2023 Intraday Analysis 15m
This is an intraday analysis for EURUSD on 15m chart based on Smart Money Concept (SMC)
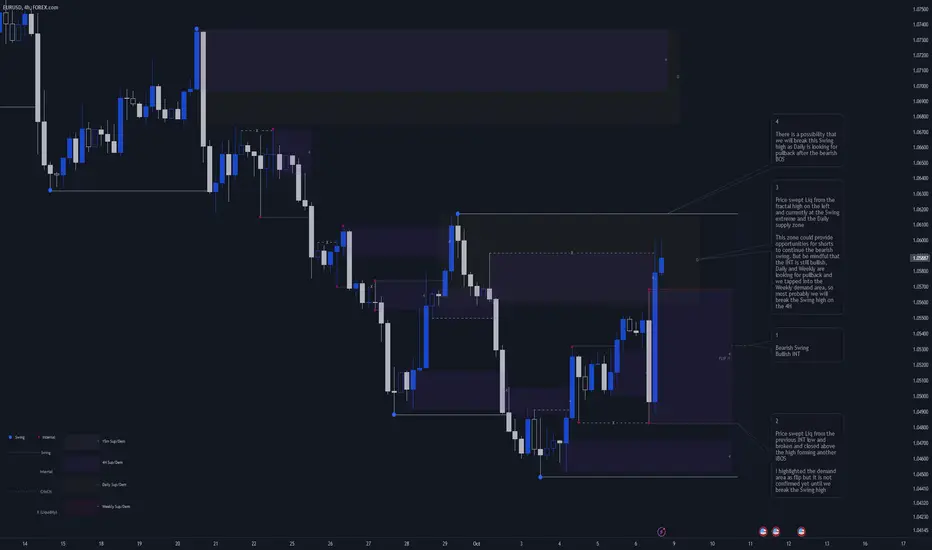
EURUSD 9-13 Oct 2023 - 4HEURUSD 9-13 Oct 2023 - 4H
This is a high level analysis for EURUSD on 4H chart based on Smart Money Concept (SMC)
EURUSD 9-13 Oct 2023EURUSD 9-13 Oct 2023
This is a high level analysis for EURUSD on weekly chart based on Smart Money Concept (SMC)
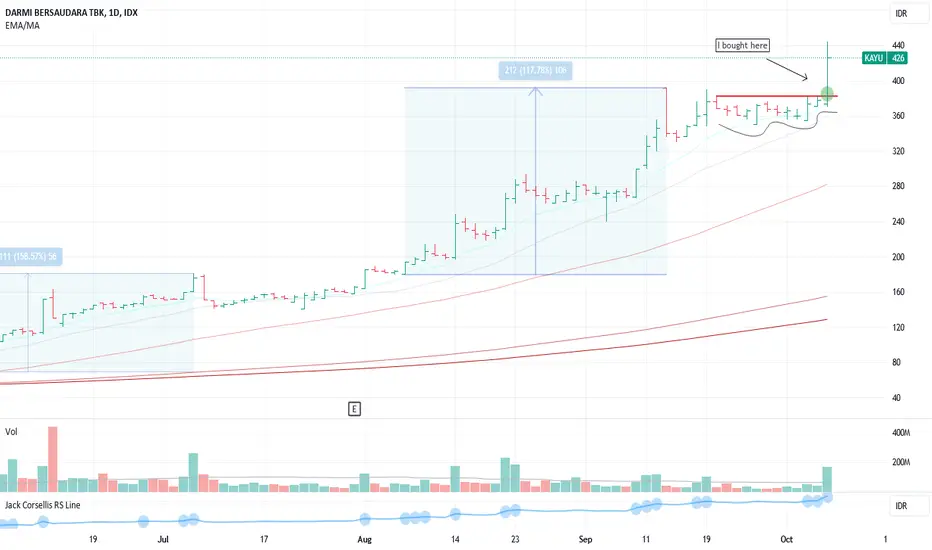
KAYU - POWER PLAYI bought my positions today
October 6, 2023
The reasons:
1. Low-risk entry with a crisp pivot point
2. The stock went up >100% in less than 8 weeks
3. VCP characteristics during the pause
4. The pause has less than 25% correction
4. Volume dries up as a sign of less supply coming to the market
5. Good close and Huge volume on the breakout
6. A high alpha stock with a low standard deviation
7. One of the leaders in this market environment
The flaw:
The market is still in a hard-penny environment with only 31% of total stocks above the 200-day MA.
This stock is so strong, a Power Play on top of a Power Play. I like to see some follow-throughs in the upcoming days.
SPX / USD - JOURNAL - ACTIVE SERIESThis is an ACTIVELY managed BLOG CONTRIBUTION, which will be UPDATED DAILY with comments and trade ideas.
| This way, I generate a SERIES for you, where you, as a reader, can - ACTIVELY - learn from the analyses, decisions, & interactions |
In the following analysis, I highlight a possible SHORT / LONG scenario in the > $FX:SPXUSD <
We focus on the technical KEY points and KEY areas which will be relevant in the next hours & days.
The highlighted scenario is supported by the higher timeframes, which we are ACTIVELY monitoring in an existing post.
This can be found under the following name: " SPX / USD - HTF JOURNAL - WEEKLY SERIES " (Listed under this post at "RELATED IDEAS")
As soon as the temporary direction of the price emerges, I will update the post accordingly, with entries, stop-loss & take-profit levels.
How do I save an idea so that I receive a notification when it’s updated?
MARKED POINTS OF INTENTION (POI)
We are at a superior "Point of Interest", which are the "Higher Low" from 2020 (1.06359) & the "Higher Low" from 1991 (1.06030).
We are at a superior "Point of Interest," which is the "Lower High" from 2022 (4325.2).
This point will almost certainly be fought over in the "medium and smaller time intervals" (intraday and day) and plays a decisive role in the following direction of movement.
(SHORT) Should this point be successfully broken, then the next approach target would be the "Higher High" from 2023 (4194.2).
(LONG) If the market can recapture these levels, then the next "HTF Resistance Level", the "Higher High" from 2023 (4463.4), will come into play.
In the smaller timeframes, a consistent momentum rise can be seen, which, however, does not have a heavy weighting in the valuation because we get a new "NEWS event" almost every day this week. For this reason, it becomes very volatile in the market, and every day it requires a re-evaluation.
# Positioning after confirmation of this thesis = LONG & SHORT
Z - Don't let the noise blind you; recognize its face and use it for yourself - Z
| ZielIstDieAutarkie |
If this idea and explanation have added value to you, I would appreciate a COMMENT or BOOST very much.
Thank you and happy trading!
Z

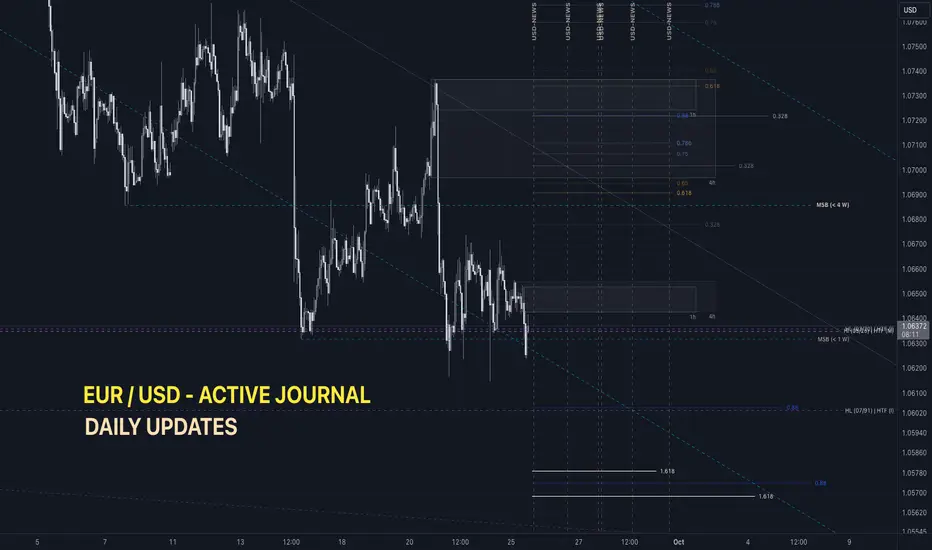
EUR / USD - JOURNAL - ACTIVE SERIESThis is an ACTIVELY managed BLOG CONTRIBUTION, which will be UPDATED DAILY with comments and trade ideas.
| This way, I generate a SERIES for you, where you, as a reader, can - ACTIVELY - learn from the analyses, decisions, & interactions |
In the following analysis, I highlight a possible SHORT / LONG scenario in the > FX:EURUSD <
We focus on the technical KEY points and KEY areas which will be relevant in the next hours & days.
The highlighted scenario is supported by the higher timeframes, which we are ACTIVELY monitoring in an existing post.
This can be found under the following name: " EUR / USD - HTF JOURNAL - WEEKLY SERIES " (Listed under this post at "RELATED IDEAS")
As soon as the temporary direction of the price emerges, I will update the post accordingly, with entries, stop-loss & take-profit levels.
How do I save an idea so that I receive a notification when it’s updated?
MARKED POINTS OF INTENTION (POI)
We are at a superior "Point of Interest", which are the "Higher Low" from 2020 (1.06359) & the "Higher Low" from 1991 (1.06030).
These points are just fought over in the "higher time intervals" (day or week) and are decisive for the following movement direction.
(SHORT) If these two points are successfully broken, then the next approach target would be the "Higher Low" from 2023 (1.05160).
(LONG) If the market can hold these levels, then the next "HTF Resistance Level", the "Lower High" from 2022 (1.07868), will come into play.
In the smaller timeframes, a consistent momentum rise can be seen, which, however, does not have a heavy weighting in the valuation because we get a new "NEWS event" almost every day this week. For this reason, it becomes very volatile in the market, and every day it requires a re-evaluation.
# Positioning after confirmation of this thesis = LONG & SHORT
Z - Don't let the noise blind you; recognize its face and use it for yourself - Z
| ZielIstDieAutarkie |
If this idea and explanation have added value to you, I would appreciate a COMMENT or BOOST very much.
Thank you and happy trading!
Z
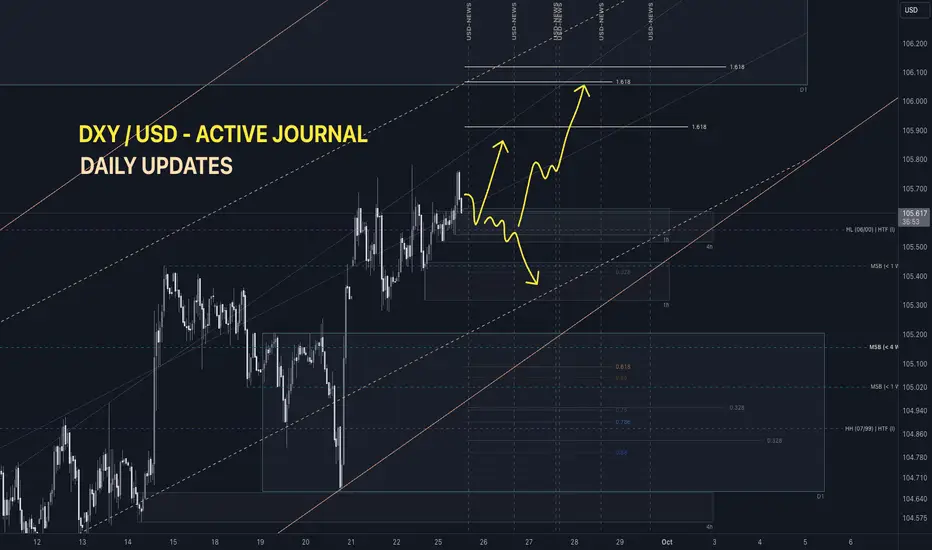
DXY / USD - JOURNAL - ACTIVE SERIESThis is an ACTIVELY managed BLOG CONTRIBUTION, which will be UPDATED DAILY with comments and trade ideas.
| This way, I generate a SERIES for you, where you, as a reader, can - ACTIVELY - learn from the analyses, decisions, & interactions |
In the following analysis, I highlight a possible SHORT / LONG scenario in the > TVC:DXY <
We focus on the technical KEY points and KEY areas which will be relevant in the next hours & days.
The highlighted scenario is supported by the higher timeframes, which we are ACTIVELY monitoring in an existing post.
This can be found under the following name: " DXY - HTF JOURNAL - WEEKLY SERIES " (Listed under this post at "RELATED IDEAS")
As soon as the temporary direction of the price emerges, I will update the post accordingly, with entries, stop-loss & take-profit levels.
How do I save an idea so that I receive a notification when it’s updated?
MARKED POINTS OF INTENTION (POI)
We are at a superior "Point of Interest", which is the "Higher Low" from the year 2000 (105,560). This point is just fought over in the "higher time intervals" (day or week) and is decisive for the following direction of movement.
(LONG) If this point is successfully broken, the next target would be the "Higher High" from 1989 (106,560).
(SHORT) If the market cannot conquer this level, then the next "HTF Support Level", the "Higher High" from 1999 (104,880), will come into play.
In the smaller timeframes, a consistent momentum loss can be seen, which, however, does not have a heavy weighting in the valuation because we get a new "NEWS event" almost every day this week. For this reason, it becomes very volatile in the market, and every day it requires a re-evaluation.
# Positioning after confirmation of this thesis = LONG & SHORT
Z - Don't let the noise blind you; recognize its face and use it for yourself - Z
| ZielIstDieAutarkie |
If this idea and explanation have added value to you, I would appreciate a COMMENT or BOOST very much.
Thank you and happy trading!
Z
XAG / USD - JOURNAL - ACTIVE SERIESThis is an ACTIVELY managed BLOG CONTRIBUTION, which will be UPDATED DAILY with comments and trade ideas.
| This way, I generate a SERIES for you, where you, as a reader, can - ACTIVELY - learn from the analyses, decisions, & interactions |
In the following analysis, I highlight a possible SHORT scenario in the > FX:XAGUSD <
We focus on the technical KEY points and KEY areas which will be relevant in the next hours & days.
The highlighted scenario is supported by the higher timeframes, which we are ACTIVELY monitoring in an existing post.
This can be found under the following name: " XAG / USD - HTF JOURNAL - WEEKLY SERIES " (Listed under this post at "RELATED IDEAS")
As soon as the temporary direction of the price emerges, I will update the post accordingly, with entries, stop-loss & take-profit levels.
How do I save an idea so that I receive a notification when it’s updated?
MARKED POINTS OF INTENTION (POI)
We are in a superior and inferior downtrend channel, which served as very good resistances in the past. In most price action indicators, we are in over bought areas (HTF) which will be reflected in price action (ITD) in the near term. In the smaller timeframes, a divergence is starting to form, which serves as additional confirmation for the trade in all the resistance areas. In intraday, this calls for a SHORT - SWING - entry, but caution is advised; the price is still not unlikely to break through the levels and continue its rise.
# Positioning after confirmation of this thesis = SHORT
Z - Don't let the noise blind you; recognize its face and use it for yourself - Z
| ZielIstDieAutarkie |
If this idea and explanation have added value to you, I would appreciate a COMMENT or BOOST very much.
Thank you and happy trading!
Z

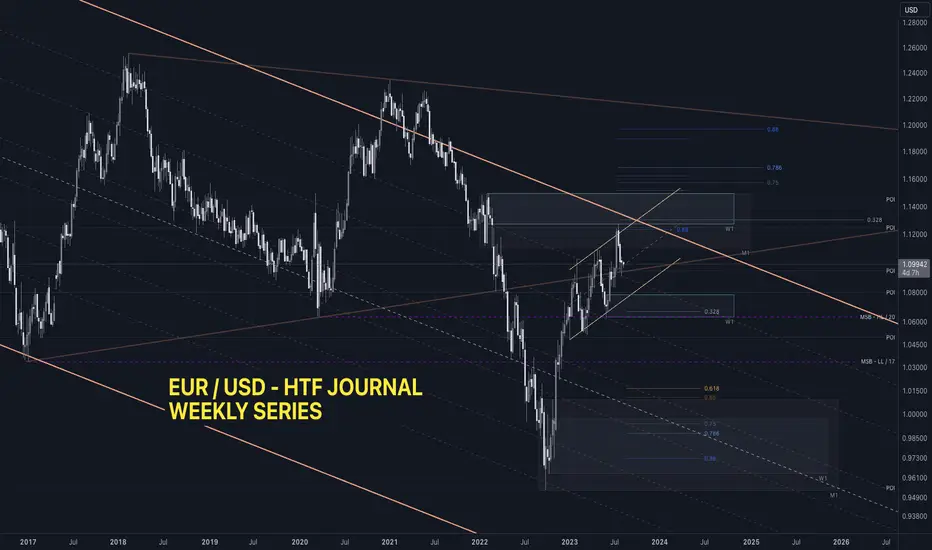
EUR / USD – HTF JOURNAL - WEEKLY SERIESThis is an ACTIVELY managed BLOG CONTRIBUTION, which will be UPDATED WEEKLY with comments and trade ideas.
| This way, I generate a SERIES for you, where you, as a reader, can - ACTIVELY - learn from the analyses, decisions, & interactions |
In the following analysis, I do NOT highlight any specific scenario but neutrally look at the higher timeframes in the > FX:EURUSD <
We focus on the technical KEY points and KEY areas that will be relevant in the coming weeks & months.
As soon as candlestick closes emerge that suggest a temporary direction for the price intra-day, I create a separate post below.
This post will be under a similar name, which is as follows: " EUR / USD - JOURNAL - ACTIVE SERIES " (Includes: entries, stop loss & take profit levels)
Once published, it will be added as a comment, and when this post is saved, you will receive a notification about it.
How do I save an idea so that I receive a notification when it’s updated?
MARKED POINTS OF INTENTION (POI)
Looking at the big monthly chart picture, we can see that we are still in a downtrend channel that started in 2008. The market has been moving up since last September to test the upper trend line of the channel. There will most likely be another run-up attempt by the price, which will come after the current bottoming. In the weekly chart - MACD indicator, one can already see a clear "Bearish Divergence", which argues for an HTF sell-off. However, in the 1-day chart, one can sense a further move to the upside, which will extend the bearish divergence more to the extreme in the higher timeframes. At the current moment of analysis, we are on very strong support areas, which could be the bottom for the next move to the upside.
Z - You have to understand the big picture to not drown in the noise of the small one - Z
| ZielIstDieAutarkie |
If this idea and explanation have added value to you, I would appreciate a COMMENT or BOOST very much.
Thank you and happy trading!
Z
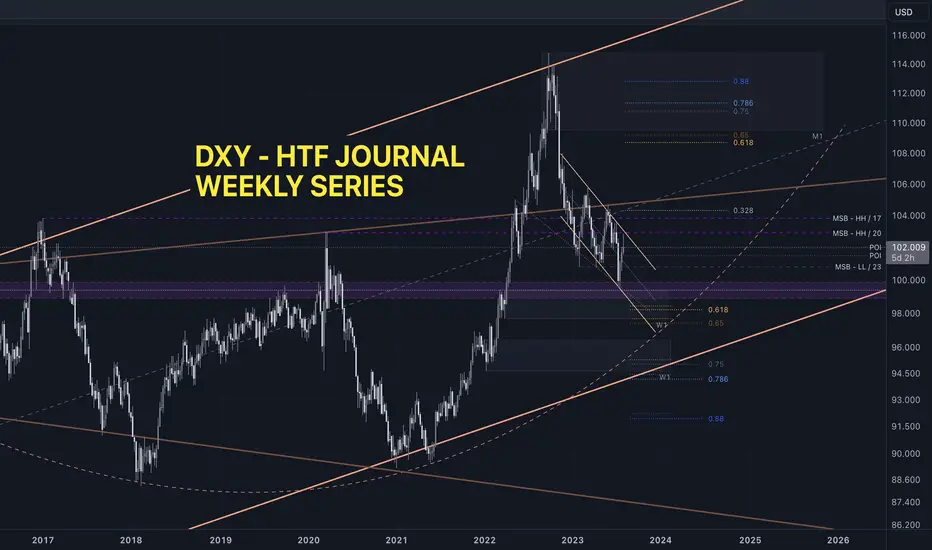
DXY – HTF JOURNAL - WEEKLY SERIESThis is an ACTIVELY managed BLOG CONTRIBUTION, which will be UPDATED WEEKLY with comments and trade ideas.
| This way, I generate a SERIES for you, where you, as a reader, can - ACTIVELY - learn from the analyses, decisions, & interactions |
In the following analysis, I do NOT highlight any specific scenario but neutrally look at the higher timeframes in the > TVC:DXY <
We focus on the technical KEY points and KEY areas that will be relevant in the coming weeks & months.
As soon as candlestick closes emerge that suggest a temporary direction for the price intra-day, I create a separate post below.
This post will be under a similar name, which is as follows: " DXY - JOURNAL - ACTIVE SERIES " (Includes: entries, stop loss & take profit levels)
Once published, it will be added as a comment, and when this post is saved, you will receive a notification about it.
How do I save an idea so that I receive a notification when it’s updated?
MARKED POINTS OF INTENTION (POI)
The price successfully tested the higher high of 2020 and closed with a strong reaction below it.
The "HH" was joined by the upper resistance line of the lower downtrend channel, which is an additional and very strong resistance.
From a short-term investment point of view, we should look for a coming correction in the DXY, but it might not be short-lived.
The MACD momentum indicator reflects a bullish divergence building up. This again supports the thesis that we are getting, for the long-term picture, further price appreciation in the DXY.
This confirms the picture of the "bubble-holding stock market" and the excessive overvaluation of individual stocks and currency pairs. As soon as the divergence plays out, and we see another rise after a correction, we will see a bloodbath in the traditional markets.
The needed correction in the traditional markets is long overdue and has been artificially delayed to this day.
Z - You have to understand the big picture to not drown in the noise of the small one - Z
| ZielIstDieAutarkie |
If this idea and explanation have added value to you, I would appreciate a COMMENT or BOOST very much.
Thank you and happy trading!
Z
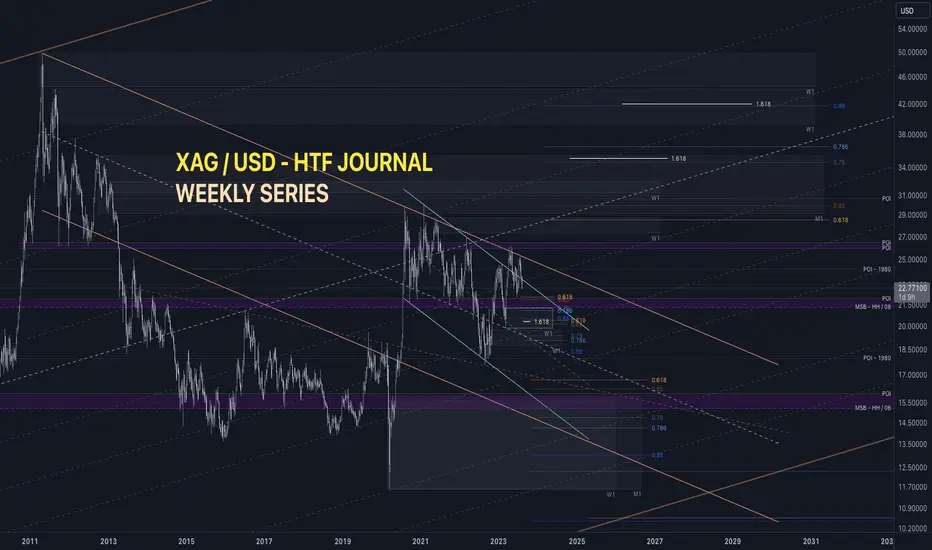
XAG / USD – HTF JOURNAL - WEEKLY SERIESThis is an ACTIVELY managed BLOG CONTRIBUTION, which will be UPDATED WEEKLY with comments and trade ideas.
| This way, I generate a SERIES for you, where you, as a reader, can - ACTIVELY - learn from the analyses, decisions, & interactions |
In the following analysis, I do NOT highlight any specific scenario but neutrally look at the higher timeframes in the > FX:XAGUSD <
We focus on the technical KEY points and KEY areas that will be relevant in the coming weeks & months.
As soon as candlestick closes emerge that suggest a temporary direction for the price intra-day, I create a separate post below.
This post will be under a similar name, which is as follows: " XAG / USD - JOURNAL - ACTIVE SERIES " (Includes: entries, stop loss & take profit levels)
Once published, it will be added as a comment, and when this post is saved, you will receive a notification about it.
How do I save an idea so that I receive a notification when it’s updated?
MARKED POINTS OF INTENTION (POI)
The price is below the mid-trend line of the oldest and most influential trend channel, which originated in 1971.
Additionally, we are at the upper resistance line of a slightly younger trend channel, which formed in 2011 and has served as resistance since 2020.
The "Higher High" of 2008 will serve as our next support, as well as the zone formed around it (21,355 - 22,000).
In our recent trend channel, another subordinate trend channel has emerged, which is currently contested.
Momentum indicators in the weekly TFs show declining momentum, which is additionally noted in the daily TFs.
The daily "moving averages" have all broken through the 200s and are now serving as resistance.
Z - You have to understand the big picture to not drown in the noise of the small one - Z
| ZielIstDieAutarkie |
If this idea and explanation have added value to you, I would appreciate a COMMENT or BOOST very much.
Thank you and happy trading!
Z
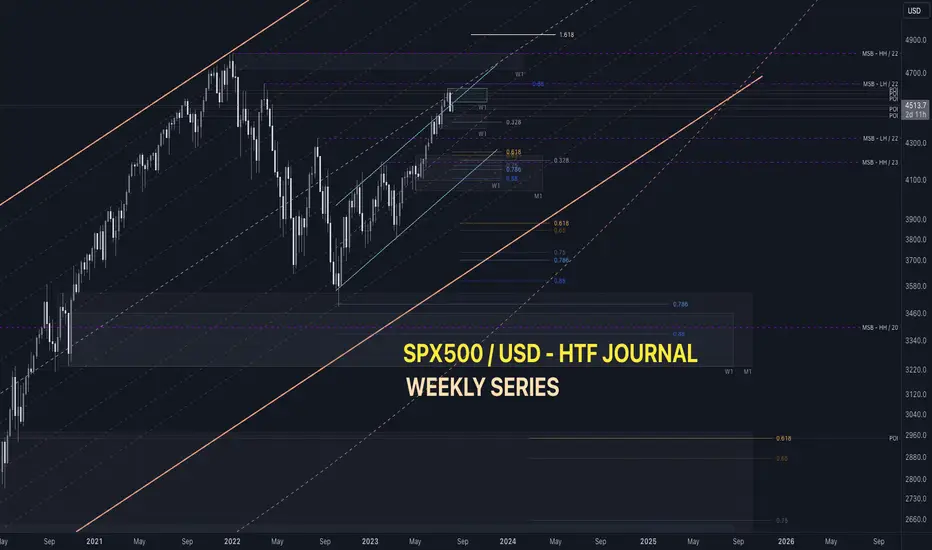
SPX / USD – HTF JOURNAL - WEEKLY SERIESThis is an ACTIVELY managed BLOG CONTRIBUTION, which will be UPDATED WEEKLY with comments and trade ideas.
| This way, I generate a SERIES for you, where you, as a reader, can - ACTIVELY - learn from the analyses, decisions, & interactions |
In the following analysis, I do NOT highlight any specific scenario but neutrally look at the higher timeframes in the > OANDA:SPX500USD <
We focus on the technical KEY points and KEY areas that will be relevant in the coming weeks & months.
As soon as candlestick closes emerge that suggest a temporary direction for the price intra-day, I create a separate post below.
This post will be under a similar name, which is as follows: " SPX / USD - JOURNAL - ACTIVE SERIES " (Includes: entries, stop loss & take profit levels)
Once published, it will be added as a comment, and when this post is saved, you will receive a notification about it.
How do I save an idea so that I receive a notification when it’s updated?
MARKED POINTS OF INTENTION (POI)
The all-time high of 2022, is only 4.56% away from the current top, which is scary in terms of the economic situation.
The overvaluation of stocks has reached a point where the fall will result in a hard landing.
The institutions and central banks know this and are currently delaying disaster. From a technical perspective, we are below / at the mid-trend line of the overarching uptrend channel.
From a subordinate perspective, the price has broken out of a recent trend channel and has not had enough momentum on the reconfirmation.
Momentum indicators in the weekly TFs and higher are not meaningful; however, a small bearish divergence can be seen in the daily TFs.
There are a lot of support areas standing in the way of a serious sell-off, which would have to be broken first - both scenarios are thus not to be ruled out | LONG / SHORT.
Z - You have to understand the big picture to not drown in the noise of the small one - Z
| ZielIstDieAutarkie |
If this idea and explanation have added value to you, I would appreciate a COMMENT or BOOST very much.
Thank you and happy trading!
Z
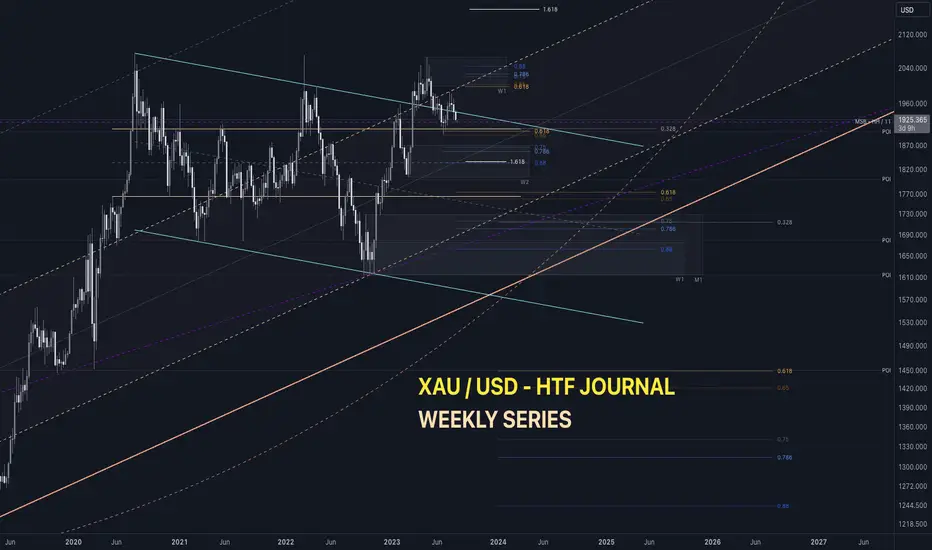
XAU / USD – HTF JOURNAL - WEEKLY SERIESThis is an ACTIVELY managed BLOG CONTRIBUTION, which will be UPDATED WEEKLY with comments and trade ideas.
| This way, I generate a SERIES for you, where you, as a reader, can - ACTIVELY - learn from the analyses, decisions, & interactions |
In the following analysis, I do NOT highlight any specific scenario but neutrally look at the higher timeframes in the > FX:XAUUSD <
We focus on the technical KEY points and KEY areas that will be relevant in the coming weeks & months.
As soon as candlestick closes emerge that suggest a temporary direction for the price intra-day, I create a separate post below.
This post will be under a similar name, which is as follows: " XAU / USD - JOURNAL - ACTIVE SERIES " (Includes: entries, stop loss & take profit levels)
Once published, it will be added as a comment, and when this post is saved, you will receive a notification about it.
How do I save an idea so that I receive a notification when it’s updated?
MARKED POINTS OF INTENTION (POI)
The all-time high from 2011 has been attempted to turn into support since 2020, which has been unsuccessful to date.
At this moment, we are above this all-time high, running it for a retest.
A 3-year RANGE has formed under this POI, which will serve as additional support.
We are also in a downtrend channel whose upper trend line continues to be contested.
Momentum indicators in the weekly TFs and higher are not meaningful; however, a small bearish divergence can be seen in the daily TFs.
There are a lot of support areas standing in the way of a serious sell-off, which would have to be broken through first - both scenarios can thus not be ruled out | LONG / SHORT.
Z - You have to understand the big picture to not drown in the noise of the small one - Z
| ZielIstDieAutarkie |
If this idea and explanation have added value to you, I would appreciate a COMMENT or BOOST very much.
Thank you and happy trading!
Z
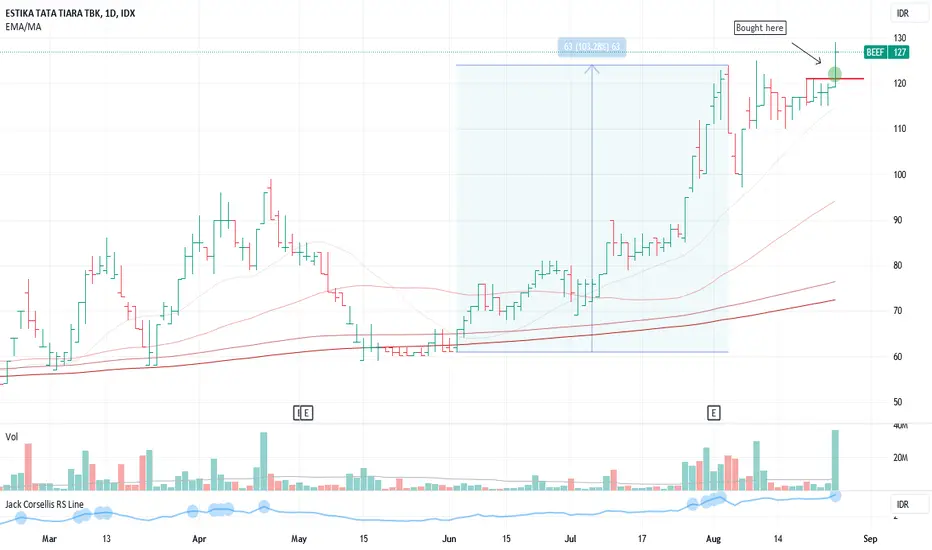
BEEF - POWER PLAYI bought my positions today
August 25, 2023
The reasons:
1. Low-risk entry point
2. The stock is up >100% in less than 8 weeks
3. Corrected the least during the pause, less than 25% correction
4. Volume dries up as a sign of less supply coming to the market
5. High alpha stock with a low standard deviation
6. It has VCP characteristics
7. Huge volume on the breakout
8. The theme: Power play. The setups work well in this current market environment
The flaw:
No identifiable flaws thus far
This is a textbook Power Play stock breaks out of a base. I like to see the stock moves constructively in the upcoming days.
BTC / USD – HTF JOURNAL - WEEKLY SERIESThis is an ACTIVELY managed BLOG CONTRIBUTION, which will be UPDATED WEEKLY with comments and trade ideas.
| This way, I generate a SERIES for you, where you, as a reader, can - ACTIVELY - learn from the analyses, decisions, & interactions |
In the following analysis, I do NOT highlight any specific scenario but neutrally look at the higher timeframes in the > BINANCE:BTCUSDT <
We focus on the technical KEY points and KEY areas that will be relevant in the coming weeks & months.
As soon as candlestick closes emerge that suggest a temporary direction for the price intra-day, I create a separate post below.
This post will be under a similar name, which is as follows: " BTC / USDT - JOURNAL - ACTIVE SERIES " (Includes: entries, stop loss & take profit levels)
Once published, it will be added as a comment, and when this post is saved, you will receive a notification about it.
How do I save an idea so that I receive a notification when it’s updated?
MARKED POINTS OF INTENTION (POI)
The "Higher Low" of June 2021 has been contested since mid-April this year and could be confirmed as support or resistance with the upcoming weekly close.
Prior to the 2017 price rally, the bottom of the existing overarching uptrend channel was formed, at whose mid-trend line (resistance) we are currently located.
Additionally, price is holding at the upper resistance line of the downtrend channel, which was formed at the last peak and has so far proven to be a significant directional guide. If this downtrend channel is broken and confirmed, we could see the USD 40,000 approach.
The momentum indicators in the weekly TFs and higher are not meaningful; however, one can notice a small bearish divergence in the daily TFs, which argues against the aforementioned scenario.
It is necessary to wait and evaluate the weekly closes neutrally, so that in the current noise of news, one does not rely on an erroneous assessment.
Z - You have to understand the big picture to not drown in the noise of the small one - Z
| ZielIstDieAutarkie |
If this idea and explanation have added value to you, I would appreciate a COMMENT or BOOST very much.
Thank you and happy trading!
Z
