[PAIBTC](66%) Project PAI by request on Huobi by Alan MastersProject PAI (PAIBTC) Overview
ABOUT PROJECT PAI
We have entered a new era of artificial intelligence, where we can create intelligent avatars made from the digital profiles of our behaviors online. We call them Personal Artificial Intelligence, or PAI.
Project PAI is founded on the belief that every person in the world should have their own digital avatar, one that speaks, thinks, and behaves just like their self.
WHAT IS PAI
A person’s Personal Artificial Intelligence (PAI), is a verified intelligent 3D avatar that looks like you, sounds like you, and can perform activities on your behalf.
--
Project PAI (PAIBTC) Chart Analysis
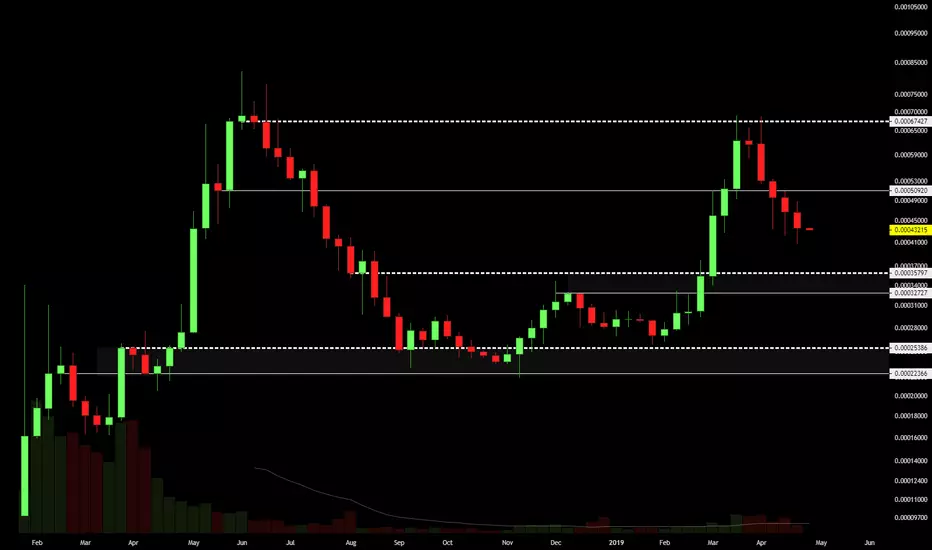
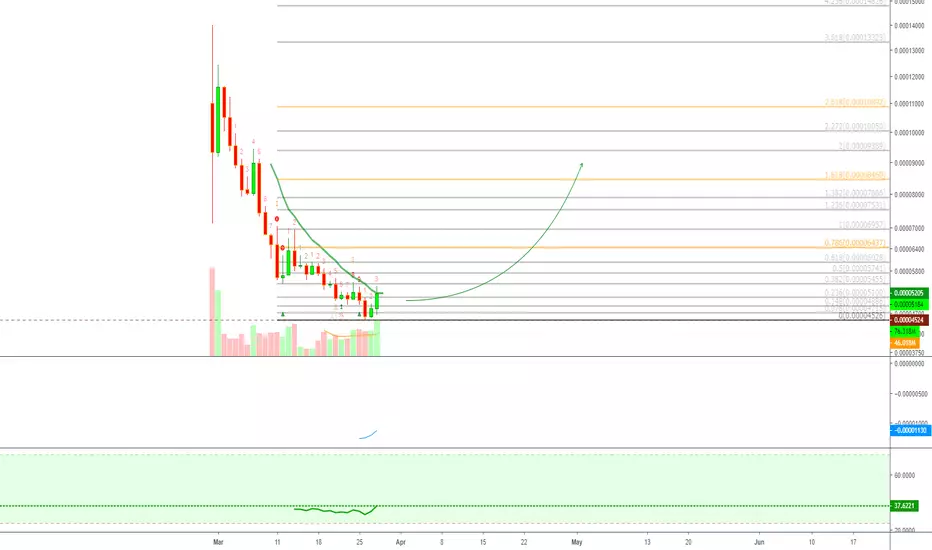
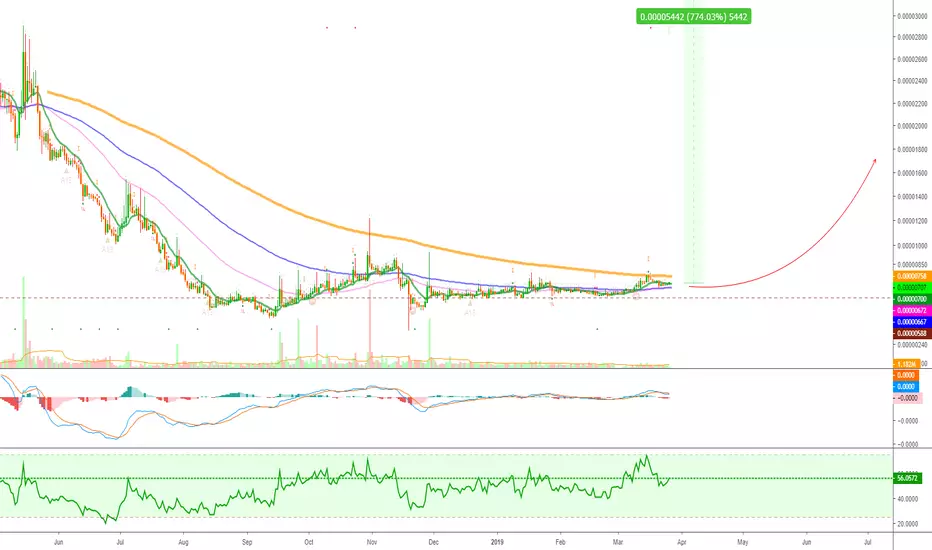
PAIBTC hit a low on the 25th April at 705 satoshis (0.00000705), marking a higher low compared to its recently hit all-time low at 0.00000697 on the 22nd February.
If this level holds here, PAIBTC can produce an impulse to the upside, let's take a look at why... But first, remember to hit like... Thanks a lot for the support.
We can see that the downtrend line from the 5th April has been broken and PAIBTC is now challenging EMA10 (green line).
We see the MACD starting to curve and the histogram clearly moving in favor of the bulls.
The RSI recently hit oversold and is starting to move up. Clearly, there isn't much left to sell as it can be seen from this long term chart:
So we have multiple signals pointing to a bottom being reached and the potential for a move to the upside, but before that happens EMA10 needs to be broken first and confirmed with above-average volume.
If PAIBTC remains below EMA10, then it is likely to move lower and create a new all-time low or bounce at the last low.
If it can move above EMA10, then expect for it to move to the upside.
For us, this is a good set-up and I would normally trade something like this.
There are different ways to trade, you can trade after a confirmed breakout to reduce risk or you can trade before the breakout to increase potential profits with a tight stop-loss in case there is no follow up on the above signals.
Here is an example trade for Project PAI (PAIBTC).
--------------
Buy-in: 0.00000760 - 0.00000830
Targets:
(1) 0.00000961
(2) 0.00001111
(3) 0.00001381
Stop-loss: Close daily below 0.00000690.
--------------
And to close, a quick phrase with the intention to inspire your Soul...
BEGINNER BUSINESS
Everything can be confusing, hard or scary at the start, even fear can creep up…
What is going on, what is this feeling? … It is the first day at work.
We are not really afraid or scared, this is the signal that action is on its way.
The shivering and the confusion is our Soul, our body is trembling because today starts the growth.
This is very exciting, I am starting to work.
Namaste.
Huobi


HB10USDT With HB10 Index as its tracking subject, HB10 is an index digital asset promoting the exchange and circulation of digital assets at low risks.
HB10 will use the full replication method and its holdings are adjusted according to the component coin pairs of HB10 Index and their weights, so as to effectively track the underlying index trend.
By exchanging for HB10, users can hold HB10 Index. Users can have the opportunity to exchange for a basket of corresponding digital assets so that they can invest in a non-systemic risk diversification digital asset portfolio with fewer virtual currencies.
In a non-one-sided market, HB10 can help to provide users with a risk-distributed and diversely targeted tool for long-term digital asset exchange.
BCH 8.06% EOS 16.91% HT 6.63% BTC 34.64% ONT 1.37% ETC 1.39% XRP 3.15% ETH 14.24% LTC 9.87% TRX 3.67%
Total books: $1,170,130.12 (+38.84%)
Global Bids: $694,122.04 (+56.88%)
Global Asks: $476,008.08 (+12.55%)
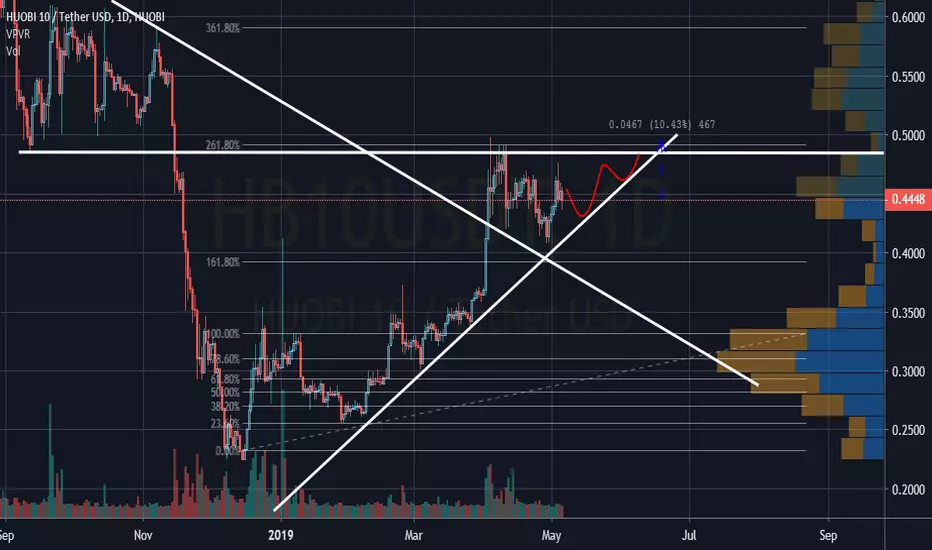
The other exchange tokenInterested to see if it can hold support on the next level
Will update this if it reaches it
Tron (TRXUSDT)(Huobi) Buy $0.02354 >>> $0.0500Tron (TRX/USDT)
Exchange: Huobi
Information:
Tron sank very hard.
Yesterday watched large orders.
Tt seems that they have now sent Bitcoin for correction and Alt Coins will start pamping.
About stop loss:
- Stop loss for a minimum and not a large margin in case of testing.
- Short stop loss and distant target.
Without Margin!
------
Buy = $0.02354
Take Profit = $0.5000
Stop Loss = $0.0210
------
Take Profit = +112.40%
Stop Loss = -10.79%
---------------------
Profit:Risk = 10 : 1
Profit:Risk = +112.40% : -10.79%

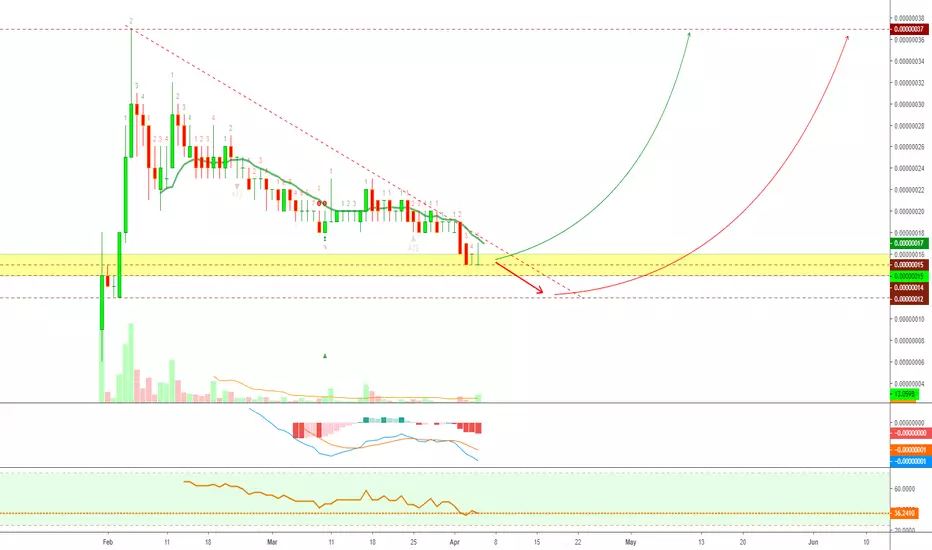
Fetch.AI Trade Signal (80% Profits Potential)I am looking at Fetch.AI and the chart is young, so I needed some outside information in order to decide if I wanted to share this trade or not.
Looking at the chart on CoinMarketCap, this altcoin did hit a low on the 26-March at 0.00004500 btc.
Looking at the weekly, the candlestick is also showing early signals of a reversal, which is also supported by growing volume.
Here is my trade signal, I hope you enjoy it and hit like.
Trade: Fetch.AI (FETBTC)
BUY: 0.00004800 - 0.00005300
TARGETS:
(1) 0.00006020
(2) 0.00006430
(3) 0.00006950
(4) 0.00007530
(5) 0.00007880
(6) 0.00008460
(7) 0.00009380
STOP: Close weekly below 0.00004500.
---
Thanks a lot for the amazing support... I LOVE YOU!
Namaste.

HT USDT short ?Huobi token
not interested in the market
before the new release of IEO
Until April 16, the asset is not interesting
because short is not where
BitTorrent A Full Dissapointment (YES/NO?!)It is true we have been tracking BitTorrent (BTTBTC) since the beginning with a bullish bias all of the time, but it is also true that we have been open to exactly the scenario that has been playing out.
Each time I mentioned BitTorrent and the pair BTTBTC for trading, I also mentioned the word "long-term potential" and "if it goes lower we buy more and remain bullish long-term after the drop".
So BitTorrent continues dropping, and these levels were all already marked in previous chart.
If you enjoy the potential of this project, you keep on loading and reloading with a long term view in mind, or you simply set it and forget... BitTorrent (BTTBTC) is in my top 5 altcoins to generate good gains in April 2019... Knowing this, we know that the month just started and obviously having patience is key!
BitTorrent (BTTBTC) Chart Analysis
BTTBTC can continue trading within the descending triangle until it reaches the final support and breaks out passively and start to climb up. This is the main scenario because it hasn't been able to break above EMA10 (bearish potential) and volume still hasn't grown enough.
Even with a strong move happening, we wouldn't act unless it is confirmed by big volume.
So we wait for a high volume breakout above EMA10 and the descending triangle to confirm that the bleeding is over and it is time to move up.
We do remain BULLISH LONGTERM.
This is Alan Masters now, make sure to hit like... If you want to of course... Your support we appreciate.
Namaste.
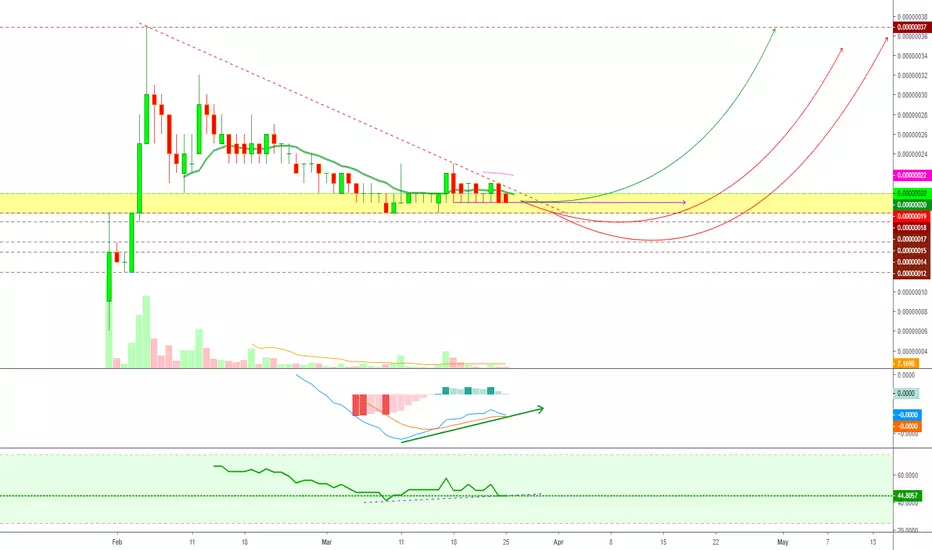
HT:USDt - Huobi Token on the rise soon!The yellow trend line has served both as support and resistance from early Feb, which makes it a very strong trend line. The yellow bubbles have shown points in which HT has bounced off and continued rising and the green bubbles have acted as resistance points. Based on this, I would expect HT to bounce off the line once more and it is being sandwiched in from the green trendline.
This is not investment advice, this is just my take on HT:USDt. Happy investing.
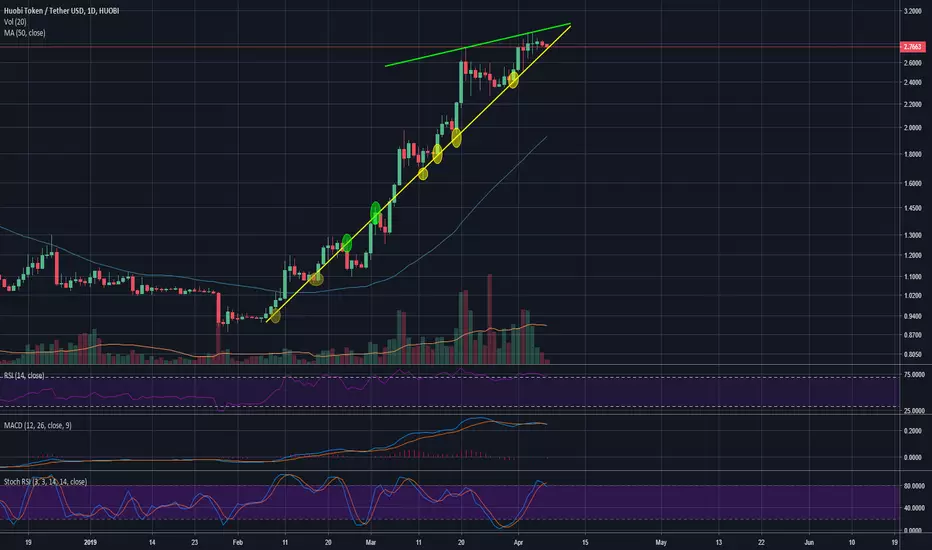
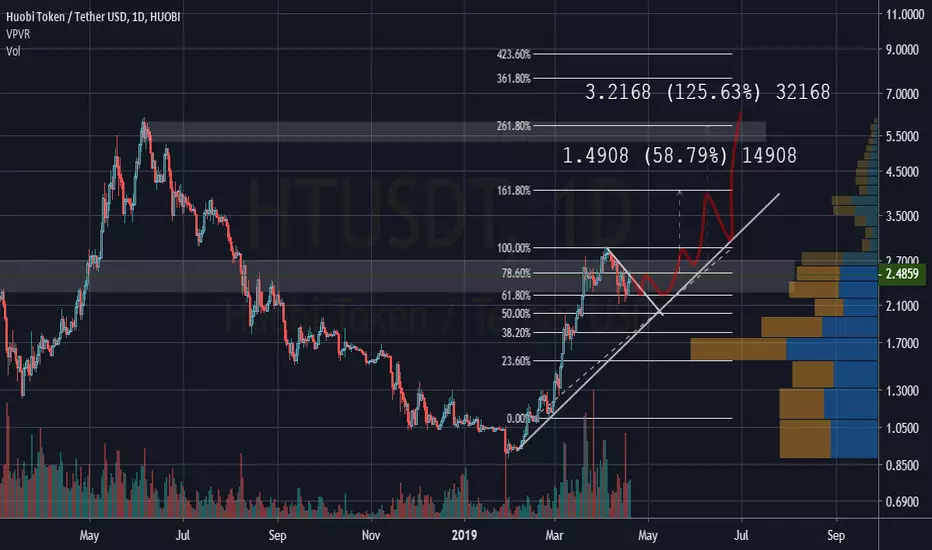
HTUSDT: LONGHTUSDT: LONG
Base prise: 2.7$
Target 1: 3.3$
Target 2: 3.4$
Stop loss: 2.45$
2.4:1, R:R Ratio (target 1)
2.8:1, R:R Ratio (target 2)

#ONTUSDT 1D BinanceSO Blullish And Sharp COin , Better Than ANy SHitcoin on Btc Up trend Movements
Remember StopLoss

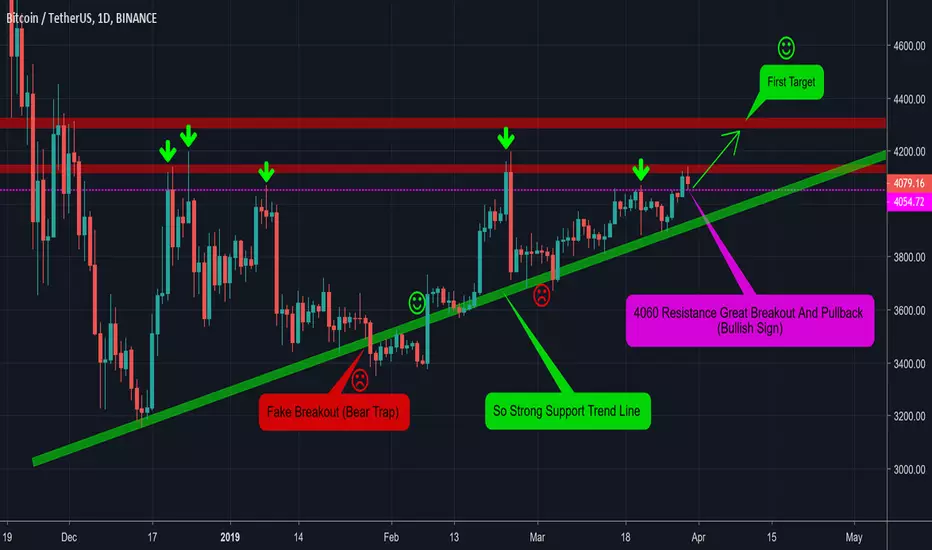
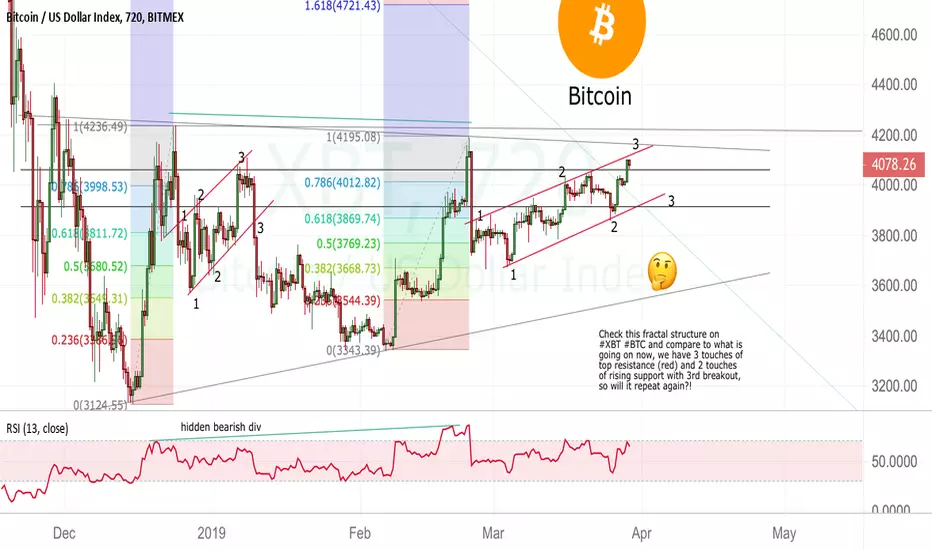
Is there any manipulation on the Bitcoin going on?!Another Manipulation from whales?! Or whales forget about us?!
Check this fractal structure on XBT BTC and compare to what is going on now, we have 3 touches of top resistance (red) and 2 touches of rising support with 3rd breakout, so will it repeat again?!
RSI long time ago showing hidden bearish divergence: Price peaks going down, and RSI peaks goes Up.
Previous ideas chart you can find here:
Weekly chart overview:
Wyckoff Accumulation and Distribution Phases on Bitcoin:
Monthly Bullish Engulfing and Inside bar (will it drive prices up?!):
Viberate Starts To Prepare For A Bullish WaveViberate (VIBBTC) has been consolidating for a while now and hasn't done any strong moves since around October 2018.
We have an active, and in profits, trade for VIBBTC, you can find it here:
This is a friendly reminder to let you know Viberate is one that can move in the weeks/months ahead.
RSI remains strong above 50.
MACD remains on the bullish zone.
Trading above EMA10, EMA50, and EMA100.
EMA200 (orange line) is the next resistance to break.
If VIBBTC, or when, can break above EMA200, expect some strong bullish action and great profits.
This is just a friendly reminder.
Thanks a lot for your continued support.
Namaste.
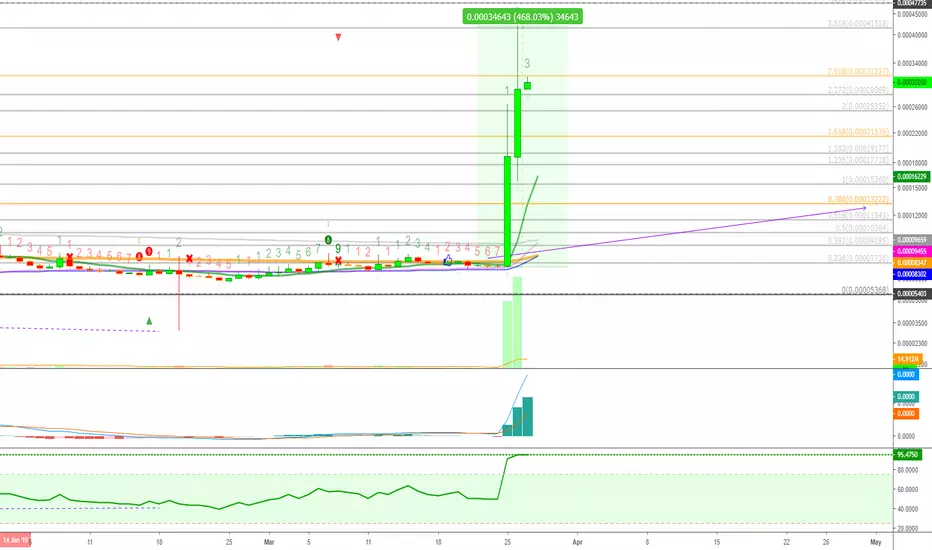
Everex Does 468% In 2 Days (Similar Opportunities Inside)If you follow Alan Masters, you are aware of Everex (EVXBTC), which is a great cryptocurrency project which generated a massive 460%+ profits in a matter of just 2 days.
This is massive bullish action and I mentioned that something like this would happen in my recent Binance Coin (BNB) trade idea update called " Binance Coin (BNB) & Binance Altcoins Already On A Bull Run ".
Now, I am writing to let you know that many more opportunities like this one are developing and you can find these by visiting my profile.
Here on Trading View, I have the ability to post 10 charts per day, so you can be sure to find many new opportunities daily, you just have to go here and click "Follow", or visit daily: tradingview.sweetlogin.com
We are seeing many Binance altcoins explode in profits with surely much more to come.
Here you can find my Everex (EVXBTC) Round 3 trade idea shared on the 15th March, almost two weeks before this ultra bullishness:
Let me tell you that this is just the beginning. The cryptocurrency market had a very long bear market all throughout 2018 and only recently we starting to see some bullish action. Yes, this massive growth will slow down but we will have altcoin, after altcoin doing similar numbers to what we are seeing with Binance coins.
Take a look at openANX for example, another one that generated over 200% profits.
We also have ADEX, SNGLS, and many others. Feel free to visit my profile for more.
You can always hit like and leave a comment with your favorite altcoin, and I will be sure to post analysis and trade for you.
Thanks a lot for the continued support.
This is Alan Masters.
Namaste.
More booming alts:
AdEx (ADXBTC) +94%
Ren (RENBTC) +102%
Enigma (ENGBTC) +52%
Lunyr (LUNBTC) +47%
Streamr DATAcoin (DATABTC) +44%
QLC Chain (QLCBTC) +52%
Basic Attention Token (BATBTC) +55%
SingularDTV (SNGLSBTC) +113%
Monetha (MTHBTC) +50%
BitTorrent Goes Sideways + Quick Update: Bullish After The DropBitTorrent (BTTBTC) continues consolidating with pure sideways action.
When BitTorrent broke the 20 satoshis resistance that was sitting at EMA10 on the 17th March, it didn't gain enough momentum to remain above 22 satoshis. It did hit 23 satoshis but it failed to remain above this level. BTTBTC needed a close above 22 satoshis in order to be able to continue its climb up.
Now it is sitting in an accumulation phase before the next move... A drop can happen... Feel free to hit like now, if you want to, and let's continue with the charts and signals:
Now trading below EMA10, bearish potential dominates.
The MACD is trending up.
RSI is creating higher lows.
BTTBTC can have a small drop to 17-18 satoshis just to bounce and continue with its sideways consolidation.
This is just a friendly warning.
If you are trading BitTorrent long term, you can use this opportunity to rebuy and reload for future gains.
I've drawn multiple scenarios on the chart with a purple, green, and red arrows... As you can see, ultimately BTTBTC remains bullish long term.
Where you think BitTorrent is headed next?
Please share your thoughts in the comments section below.
Remember to hit like.
Namaste.
DATA (DTABTC) on Huobi Prepares For Bullish Action (1700% - 2800Good SUNday my successful and profitable cryptocurrency trader, today I would like to take a few minutes to take a look at DATA (DTABTC) on Huobi, we have a few strong and very clear signals to look at.
So let us start by hitting like now so we can continue with this analysis...
Ok, thanks a lot for the support.
Now, this is not a piece of trade advice, I will be reading the chart for you, if you decide to trade or not this altcoin that is completely up to you.
DATA (DTABTC) on Huobi Charts Analysis by Alan Masters
Let's start with the charts...
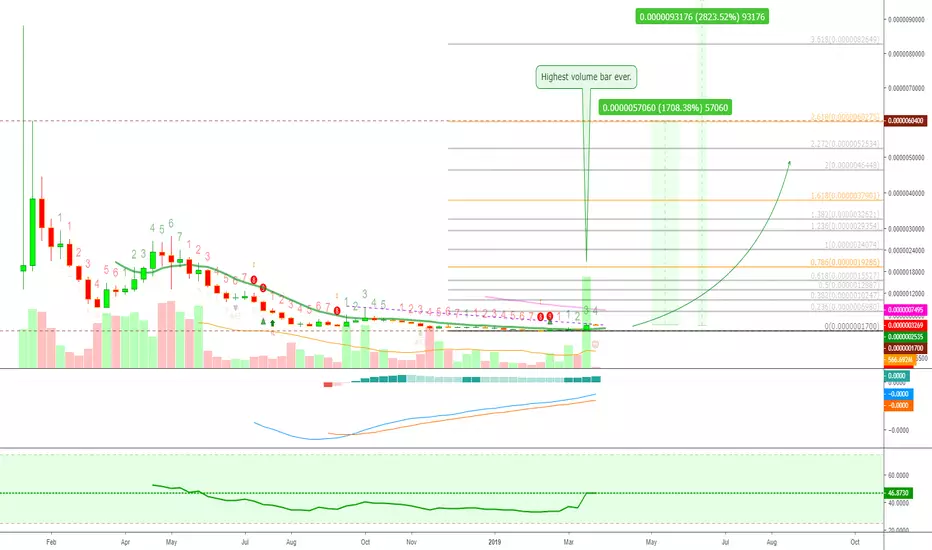
LONG TERM WEEKLY:
Here the first thing I would like to attract your attention to is the high volume bar produced last week. This is the highest volume bar ever for DTABTC, even higher than January's 2018 bull run volume. This is a good indication that the whales/miners/exchanges are starting to load up on this altcoin. If these entities/people are buying up, we can take it as a signal that bullish action will be coming soon.
This super high volume also marks a break of the EMA10 resistance, which is the green line you see on the chart. DTABTC traded below EMA10 since May 2018. So this is now a resistance turned support.
Below EMA10 = bearish potential.
Above EMA10 = bullish potential.
This is just a basic indicator that I use and share with my readers so that you can easily start to do your own charting. Now that DTABTC is above EMA10, we can start looking at it with a bullish bias.
The TD Sequential started a new positive count after completing a perfect negative nine. Supporting the high volume bar we are seeing and the break above EMA10.
On February 2018 DTABTC marked a new all-time low at 0.0000001700. After we hit bottom, the only place left to go is up.
We are looking at 1700% profits potential to the all-time high, and over 2800% to a new high (Fib. projection).
These are some basic signals, let's take a look at a few more for our own learning and entertainment.
A closer look at the weekly:
When looking at it closer, it is easier to appreciate last week strong bullish candlestick which broke above the EMA10 resistance.
The MACD is trending up with good momentum.
The RSI is turning bullish and trading above all resistance and at its highest since May 2018.
Looking at these signals, we can expect DATA to have a strong move in the months ahead that can generate massive gains.
Remember to hit like... Let's continue.
Note: This is not a piece of trade advice, all of my trades contain targets, buy-in, stop-loss, and additional information. Let me know in the comments section if you would like to see a full trade for DATA (DTABTC).
Thanks a lot for reading, I hope you were entertained.
This is Alan Masters and I appreciate your time, energy, and support.
Namaste.
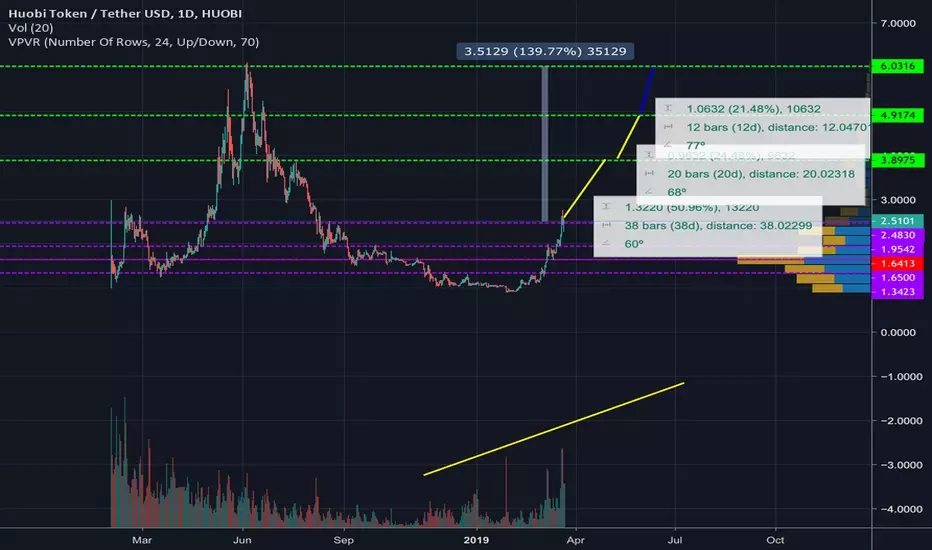
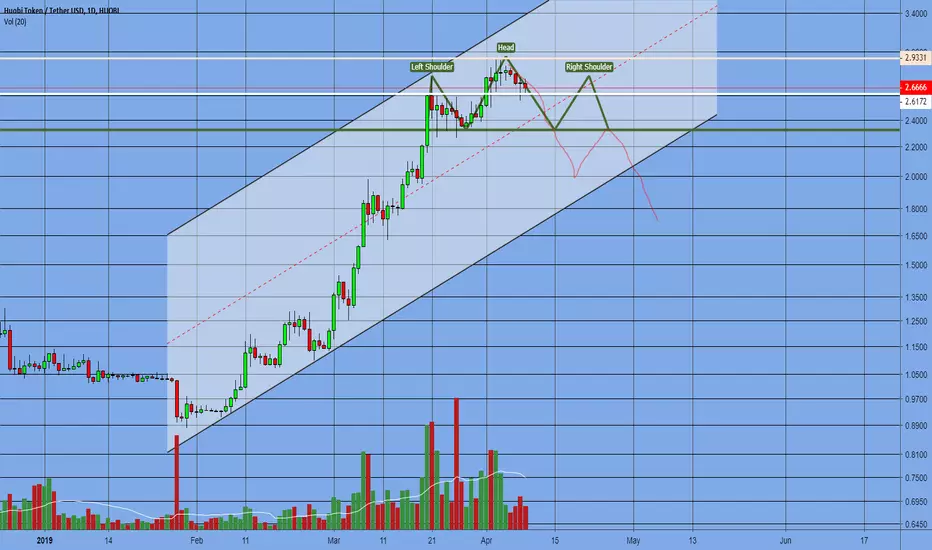
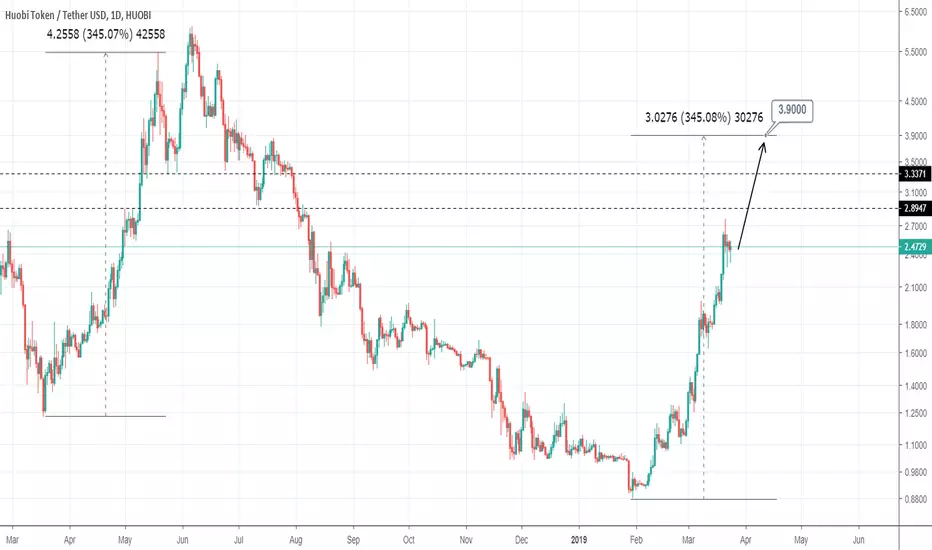
HUOBI TOKEN +70% Upside potentialPattern: Parabolic bullish curve on 1D.
Signal: Bullish on every pull back.
Target: 3.9000 (+345% from bottom similar to the previous bullish parabola).
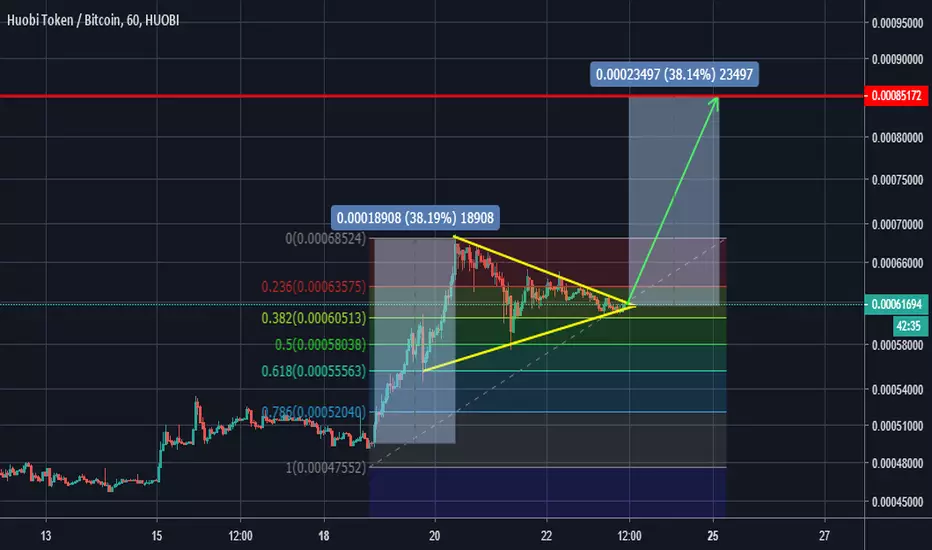
Huobi Token - Strong bullish playThis is a possible short term move for HT if we breakout of the ascending triangle to the upside.
There is also a very strong FA with HT. They recently announced their first Prime listing and can only be purchased with the HT token. In order to participate in the next Prime listings, users must hold 500 HT for a minimum of 30 days before the next listing.
HT has the possibility of rising similar to BNB.
This is not financial advice. I am not a financial advisor.
- Wiz
HT Bull Flag and Falling Wedge AnalysisAs TA shows above that HT is very bullish at the moment. Considering Huobi's upcoming token sale (ICO, IEO or whatever they call it) will create a higher demand. Also Huobi stated that the other upcoming token sales will require investors to hold at least 500 HT for 30 days in order to participate in token sales which will cause a lot higher demand.
This is not a trade or investment advice. Just for educational purposes. Do your own research.

HT, Huobi token will X3.5 soonViolet - support zones, where to buy up to your MM,
Green - sale and resistance zones +-5% area around,
Good luck!